VALIDATING THE COBEA ALGORITHM AT THE DELTA STORAGE RING
B. Riemann ∗ , S. Koetter, B.D. Isbarn, S. Khan, T. Weis DELTA, Dortmund, Germany
Abstract
Closed-Orbit Bilinear-Exponential Analysis (COBEA) is an algorithm to decompose monitor-corrector response matrices into (scaled) beta optics values, phase advances, scaled dispersion and betatron tunes. No explicit magnetic lattice model is required for COBEA - only the sequence of monitors and correctors along the beam path (no lengths, no strengths approach). To obtain absolute beta values, the length of one drift space can be provided as optional input.
In this work, the application of COBEA to the DELTA stor- age ring, operated by TU Dortmund University, is discussed, and its results for betatron tunes and scaled dispersion are compared with those of conventional, direct measurement methods. COBEA is also put in a historical perspective to other diagnostic algorithms. Improvements in the Python im- plementation of COBEA, which is available as free software, are presented. Due to COBEA being relatively modest re- garding its requirements on input data respectively hardware, it should be applicable to the majority of existing storage rings.
INTRODUCTION
In the following, only a brief introduction to Closed-Orbit Bilinear-Exponential Analysis (COBEA) is given due to space limitations; the interested reader is referred to [1, 2].
Linearized single-particle motion around a closed orbit ob- served at monitor j in direction w for consecutive turns n can be described via
˜
r
(n)jw= X
m
<
R
jmwe
inµm, (1)
with complex-valued parameters R
jmwthat are linked to (coupled) Ripken optics parameters [3, pp. 30–31] at monitor positions s
jR
jmw= q
mβ
wm(s
j) e
iφw m(sj)(2) with the respective betatron amplitude and phase parameters β
wm, φ
wmand a single-particle invariant of motion
m, and betatron tunes µ
m/(2π).
To describe closed-orbit distortion by a corrector at posi- tion ˜ s
k, one can introduce a topology matrix
S
jk= sign(s
j− s ˜
k) ∈ {− 1, +1 }
and complex coefficients A
kmthat implicitly depend on strength, betatron amplitude and phase at mode m of the re- spective corrector. Via dispersion effects, the low-frequency
∗
bernard.riemann@tu-dortmund.de
synchrotron motion is projected into the transverse plane;
introducing the scaled dispersion orbit d
jwat monitor po- sitions and coefficients b
kfor all correctors, the expression for a linear closed-orbit perturbation is [2]
r
modelk jw= X
Mm
<(R
jmwe
−iSj kµm/2A
∗km) + d
jwb
k(3)
for each response element r
k jwusing corrector k at monitor j in direction w. COBEA is able to decompose a measured response matrix r
k jwinto the unknown right-hand parame- ters (absolute for µ
m, including scaling invariants for other quantities) with the only additional information being given by the ordering (not distance) of the monitors and correc- tors along the beam path; results for the two storage rings Metrology Light Source and BESSY II can be found in [1,2].
MEASUREMENTS AT DELTA STORAGE RING
DELTA is a 1.5 GeV synchrotron light source located at TU Dortmund University, Germany. Beam position moni- tors of the DELTA storage ring experience un-rectified pin- cushion distortion (especially near the injection region); the utilized types of orbit measurement in this work are influ- enced by this effect in the same fashion and does not com- promise the following comparison.
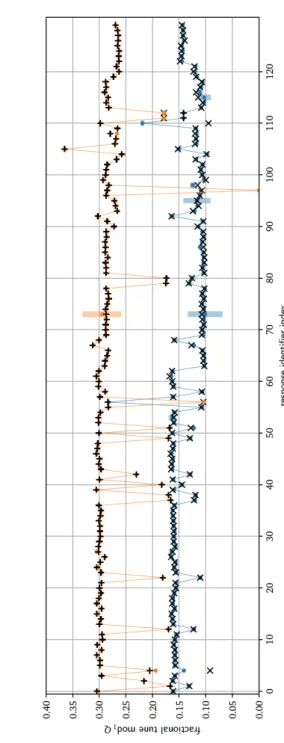
Long-Term Betatron Tune Comparison
In the following, results for standard response matrices of the DELTA storage ring are evaluated using an imple- mentation of the COBEA algorithm [4]. The betatron tunes of the DELTA storage ring are routinely monitored at an effective rate of ≈ 1 Hz by pulsed excitation of a slotted- pipe rf kicker [5] and monitoring of turn-by-turn data at a dedicated beam position monitor [6]. Since 2008, these mea- surement results are also stored as additional information when recording a corrector-monitor response. This allows to compare the response-matrix-intrinsic betatron tune that can be extracted using COBEA with the measured betatron tune via pulse excitation over a time interval of ≈ 10 years.
The results of this comparison are shown in Fig. 1. It can be observed that for the majority of cases, the betatron tunes of both methods coincide within the error margins of COBEA.
11
It is interesting to note that COBEA allows to extract betatron tunes from before 2008, when no tune measurement results were routinely recorded.
As no comparison data exists, those responses are not discussed in this work.
9th International Particle Accelerator Conference IPAC2018, Vancouver, BC, Canada JACoW Publishing
ISBN: 978-3-95450-184-7 doi: 10.18429/JACoW-IPAC2018-THPML084
06 Beam Instrumentation, Controls, Feedback, and Operational Aspects T33 Online Modeling and Software Tools
THPML084 4851
Content from this w ork ma y be used under the ter ms of the CC BY 3.0 licence (© 2018). An y dis tribution of this w ork mus tmaintain attr ibution to the author(s), title of the w ork, publisher ,and DOI.
Figure 1: Comparison of COBEA tunes (colored lines and error bars, blue for horizontal, red for vertical plane) with turn-by-turn measurements (black + and × markers)
Dispersion Comparison
Due to the reduced error margins in recent versions of COBEA (see appendix), effects like spurious dispersion coupling of corrector magnets, that typically generate less than 10% of the response signal, can be used to extract the shape of the dispersion function, d
jw, at monitor positions.
This can be seen as a testcase for the precision of our method.
For the dispersion measurement, the storage ring’s refer- ence rf frequency ν
ref= 499.819 MHz was varied in steps of 1 kHz in the interval ± 5 kHz, measuring the closed orbit positions at beam position monitors j. The resulting data
x
n jwas processed using a quadratic fit
x
n j= x
(0)j+ x
(1)j(ν
n− ν
ref) + x
(2)j(ν
n− ν
ref)
2and the linear coefficients x
(1)jwere assumed to be propor- tional to the dispersion D(s
j).
Agreement between dispersion predictions by COBEA and the rf detuning measurement can be quantified by a normalized product of arrays x
(1)jand d
jxa =
P
jx
(1)jd
jxq
P
j
(x
(1)j)
2q P
j
d
2jx.
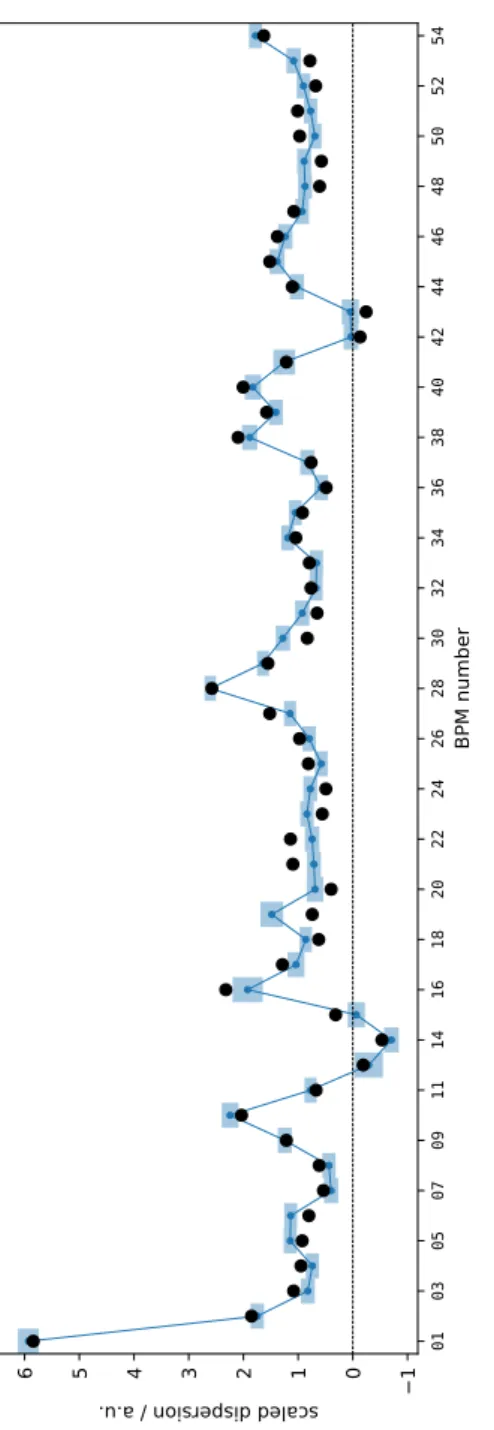
In case of perfect agreement, the vectors should be paral- lel (a = 1). For the present comparison between COBEA results and rf detuning, the agreement is a = 0.984. The normalized shape of the COBEA dispersion prediction is compared with rms-normalized x
(1)jvalues in Fig. 2.
HISTORICAL PERSPECTIVE
Our comparison with related work is based on the recent review in [7] and on [2].
COBEA allows to obtain approximations (limited by noise) of particle oscillation parameters R
jmw, µ
mdirectly from elements of the response matrix. To the authors’ knowl- edge, this largely lattice-independent procedure is not used in common codes that extract beam optics information from closed-orbit responses; instead, start values (design values) from an optics model are used at some stage of each algo- rithm. Using the monitor-corrector subspace (MCS) rou- tine [1, 2] as “missing piece” allows the COBEA to function without any input of lattice optics, but only requiring the ordering of monitors and correctors.
Mapping of known corrector optics to monitor optics had been explored in [8]. The most similar work to the COBEA algorithm has been found to be [9], where the ansatz of [8]
was further developed, including a reverse mapping from monitor optics to corrector optics, and normalization of beta functions using drift spaces. The iterative procedure de- scribed in [9] (in which tune optimization may enter in an outer control loop) corresponds to an iteration until conver- gence of corrector-monitor mapping in our context, which would replace the optimization layer.
2A major difference to COBEA is given by the usage of external initial values from a pre-existing lattice model in [9]; COBEA generates its own initial values using MCS [1, 2] and also includes linear betatron coupling and dispersive effects.
Similar comparisons hold for the fast phase determination technique in [10] and optics correction at KEKB [11]. In
2
This mapping between spaces is also a technique for bilinear systems – when the
µmvalues are not included in the optimization procedure, the remaining problem can be reformulated as a bilinear equation system [2].
While it is guaranteed that each step of this iteration reduces
χ2, stagnation for a non-optimal
χ2value outside of a local minimum is still possible and occurs in practice. This limits the applicability especially for randomly generated initial values.
9th International Particle Accelerator Conference IPAC2018, Vancouver, BC, Canada JACoW Publishing
ISBN: 978-3-95450-184-7 doi: 10.18429/JACoW-IPAC2018-THPML084
THPML084 4852
Content from this w ork ma y be used under the ter ms of the CC BY 3.0 licence (© 2018). An y dis tribution of this w ork mus tmaintain attr ibution to the author(s), title of the w ork, publisher ,and DOI.
06 Beam Instrumentation, Controls, Feedback, and Operational Aspects
T33 Online Modeling and Software Tools
further development of the latter, reference [12] introduces a least-squares optimization procedure not including gradient information and using initial model optics as input; the beta- tron tunes are determined from an additional measurement source.
The class of lattice-model optimizers is most prominently known by LOCO [13] while other programs like CALIF [14]
utilize lattice models in a varying degree. For these tech- niques, the difference to COBEA is found by their necessity of a detailed, reasonably well-tuned lattice model, the pa-
010305070911141618202224262830323436384042444648505254
BPM number
1
0
1
2
3
4
5
6 scaled dispersion / a.u.
Figure 2: Comparison of COBEA predictions for scaled dispersion at monitors (blue dots and bars, the latter denoting computed error margins) with analysis of measurement data by rf detuning.
rameters of which are tuned to a local optimum; strongly mismatched or locally incorrect models can lead to poor or no convergence. While this procedure certainly has many advantages (like the possibility of fitting monitor errors), one drawback of this approach is that the output is always correlated with the underlying assumptions implicit in the used lattice model and the (more or less arbitrary) free pa- rameters selected for optimization by the user. To give an elementary example, optical functions from a ring with a given (assumed) symmetry must always be symmetric.
In recent years, direct measurement of beam oscillation data at its eigenfrequncies (turn-by-turn data) has been successfully used to measure optical parameters instantly, e.g. [15]. However, the resolution and usability of this data source depends on the ring size (circulation time), achiev- able timing accuracy, high environmental stability (thermal and electric shielding) and, for some techniques, relative strength of decoherence by anharmonic and/or off-energy oscillations. In a recent case study it has been suggested that, depending on the machine parameters, usage of closed-orbit measurements can still be advantageous [16].
CONCLUSION
COBEA response matrix analysis results have been pre- sented in comparison with direct dispersion and tune mea- surements for the DELTA storage ring. An implementation of COBEA is available online [4] and should be usable for many storage rings.
ACKNOWLEDGEMENTS
The authors would like to thank all colleagues performing accelerator research with as well as developing and main- taining the DELTA storage ring.
APPENDIX
Based on measurements with K correctors at J moni- tors for M transverse modes respectively directions, and the effective degrees of freedom of the BE model including dis- persion being N = (K + J M)(2M + 1) − (M + 1) [2], the scalar variance estimate is [17]
hσ
2i = χ
2K J M − N = f
f − 1 h χ
2i, (4) with f = K J M
N > K J M K + J M · 1
2M + 1
being the overdetermination factor of the problem. As a rule of thumb (assuming K ∝ J), f scales linear with the number of monitors J in a storage ring
3. For DELTA, f ≈ 7.36 yields a reasonable, although not precise, error estimate.
This scalar variance estimate replaces the one used in [2], which is considerably larger, in all subsequent error computations of the Jacobian and Hessian matrices.
3