BEAM DIAGNOSTICS
BY USING BUNCH-BY-BUNCH FEEDBACK SYSTEMS AT THE DELTA STORAGE RING
∗M. H¨oner
†, H. Huck, M.Huck, S. Khan, R. Molo, A. Schick, P. Ungelenk
Center for Synchrotron Radiation (DELTA), TU Dortmund University, Dortmund, Germany
Abstract
At the DELTA electron storage ring operated by the TU Dortmund University, longitudinal and transverse bunch- by-bunch feedback systems are in use to detect and sup- press multi-bunch instabilities. Besides that, the digital feedback systems are excellent diagnostics tools. As an ex- ample, by exciting a certain number of bunches within the bunch train, the coupling to the non-excited bunches can be investigated below and above the instability threshold.
Other examples include studies of the injection process and monitoring bunch oscillations during sudden beam loss.
First experimental results are presented in this paper.
INTRODUCTION
At the 1.5-GeV electron storage ring DELTA (Fig. 1 and Tab. 1) operated by the TU Dortmund University, longitu- dinal multi-bunch instabilities occur during user operation.
These instabilities can be suppressed by an RF-phase mod- ulation, which also increases the beam lifetime. However, the RF-phase modulation is corrupting the electron den- sity distribution and arrival time, and is, e.g., incompatible with the short-pulse facility at DELTA, in which a laser- induced energy modulation is employed to generate ultra- short VUV and THz pulses [1]. Therefore, three bunch-by- bunch feedback units [2] and the respective kicker struc- tures [3] have been installed in the northern part of the stor- age ring [4]. Besides suppressing multi-bunch instabilities, the bunch-by-bunch feedback systems can be used as pow- erful diagnostics tools, since they are capable of storing digitized bunch positions in all three dimensions for each bunch at every turn over an extended time period (up to 800 ms), e.g., to investigate the inter-bunch coupling. Further- more, data of beam-loss events and studies of the injection process will be discussed.
INTER-BUNCH COUPLING
The electron bunches interact with each other due to wakefields driven by, e.g., the resistive-wall impedance and higher-order modes of the RF cavity (e.g. [5]). To study the coupling between the bunches, several measurements have been performed.
Measurements Above the Instability Threshold
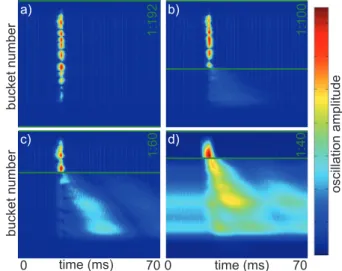
Figure 2a shows a standard grow-damp measurement of all bunches, which was performed above the instability
∗Work supported by BMBF (05K10PEB)
†markus.hoener@tu-dortmund.de
Figure 1: Overview of the DELTA synchrotron light source comprising a linear accelerator, a booster synchrotron and a storage ring with three insertion devices.
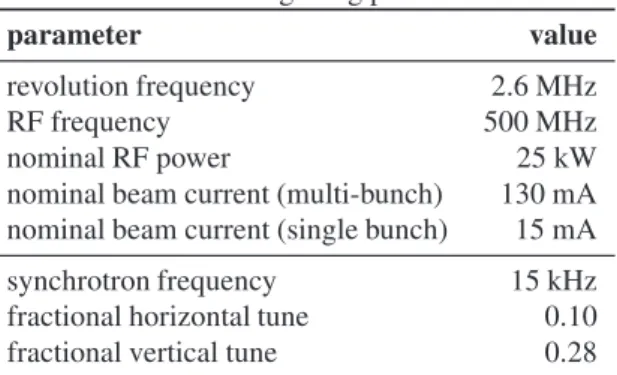
Table 1: Storage ring parameters
parameter value
revolution frequency 2.6 MHz
RF frequency 500 MHz
nominal RF power 25 kW
nominal beam current (multi-bunch) 130 mA nominal beam current (single bunch) 15 mA
synchrotron frequency 15 kHz
fractional horizontal tune 0.10
fractional vertical tune 0.28
threshold of about 70 mA. At the beginning, all bunches are stabilized by the feedback system until the feedback out- put is shifted by180◦in phase causing an excitation of all bunches. This positive feedback is enabled for 5 ms until the oscillation is damped again. Figure 2b shows a grow- damp measurement where a small number of bunches is not affected by the feedback system at all. They are ini- tially stable but start to oscillate for a small period of time due to coupling between them and the excited bunches. By reducing the number of excited bunches even more, the os- cillation amplitude of the non-excited bunches is increased (Fig. 2c). Eventually, all bunches which are not affected by the feedback are unstable even before the excitation (Fig. 2d), since the measurement is performed above the instability threshold. It is evident from Figs. 2c and 2d that the maximum oscillation of the subsequent bunches is shifted by several ms depending strongly on the bunch po- sition relative to the excited bunch train.
Proceedings of IPAC2013, Shanghai, China MOPME008
06 Instrumentation, Controls, Feedback and Operational Aspects T03 Beam Diagnostics and Instrumentation
ISBN 978-3-95450-122-9 485 Copyrightc○2013byJACoW—ccCreativeCommonsAttribution3.0(CC-BY-3.0)
Figure 2: Grow-damp measurements above the instability threshold for different feedback patterns. The green lines indicate the fraction of the bunches which are temporarily excited by positive feedback while the other bunches are not influenced by the feedback system at all.
Measurements Below the Instability Threshold
Below the instability threshold, a positive feedback would not affect the bunches significantly. Therefore, the bunches have been excited by a drive signal corresponding to the synchrotron frequency of the beam. To limit the drive signal generated by the bunch-by-bunch feedback system to a short period of time, a fast pin diode was used, which blocked the drive signal periodically with a period of 100 ms. In Fig. 3a, the first 60 bunches of the bunch train were excited, while Fig. 3b shows the excitation of the last 124 bunches. Similar to the measurements above the instabil- ity threshold, the non-excited bunches are influenced due to inter-bunch coupling. However, the oscillation of the non- excited bunches is limited to the excitation interval which is in clear contrast to the measurements above the instability threshold.
Figure 3: Periodic longitudinal excitation of parts of the bunch pattern below the instability threshold.
Hybrid Mode
Besides exciting a certain number of bunches in a stan- dard multi-bunch mode, similar measurements have been
performed at DELTA within a hybrid filling pattern. Here, one high-charge single bunch was injected into the clearing gap of the multi-bunch pattern. This single bunch was tem- porally and spatially overlapped with a Ti:Sapphire laser pulse to create ultrashort VUV pulses by coherent har- monic generation (CHG) [1] as well as laser-induced co- herent THz pulses [6]. To achieve an intense and stable CHG signal, the arrival time of the single bunch must not oscillate, which is achieved by the longitudinal bunch-by- bunch feedback system. To investigate the dependence of the CHG signal on the oscillation amplitude of the single bunch, the longitudinal feedback system was used to stabi- lize parts of the multi-bunch train. In the case of stabilizing the entire multi-bunch pattern except the single bunch, the single bunch itself is stable as well, since the wakefields of the preceding bunches are strongly reduced. By reducing the part of the multi-bunch pattern which is stabilized by the feedback system, the single bunch starts to oscillate at a certain threshold. In Fig. 4, the laser-induced CHG and THz signals as well as the oscillation amplitude of the sin- gle bunch are plotted versus the fraction of the multi-bunch fill which is stabilized. Oscillation amplitude and loss of laser-induced signals are clearly correlated. Without any feedback, the laser-induced signals drop by more than a factor of two.
1 0.9 0.8 0.7 0.6 0.5 0.4 0.3 0.2 0.1 0 1
0.8 0.6 0.4 0.2 0
osc. amplitude (a.u.)
fraction of feedback pattern (a.u.)
1 0.9 0.8 0.7 0.6 0.5 0.4 0.3 0.2 0.1 00 0.2 0.4 0.6 0.8 1
laser − induced signals (a.u.)
laser−induced CHG signal laser−induced THz signal feedback data
Figure 4: Oscillation amplitude of the single bunch in a hy- brid filling pattern and laser-induced CHG and THz signals while varying the fraction of feedback-stabilized bunches.
DIAGNOSTICS
In addition to stabilizing or exciting the electron beam or parts of it, the signal processing units can be used to store bunch position data triggered by external events for post- processing.
Beam Loss
All feedback units can be triggered by a sudden beam loss event. The beam-loss trigger pulse itself is generated by using the differential output of the parametric current transformer which is routinely employed for beam current measurements. If the differential signal exceeds a given MOPME008 Proceedings of IPAC2013, Shanghai, China
ISBN 978-3-95450-122-9 486
Copyrightc○2013byJACoW—ccCreativeCommonsAttribution3.0(CC-BY-3.0)
06 Instrumentation, Controls, Feedback and Operational Aspects T03 Beam Diagnostics and Instrumentation
threshold, a TTL trigger pulse initiates the data storage.
The feedback units allow to store the bunch position data of each bunch for several 100 ms before the trigger event, which allows to analyze the beam loss events post mortem.
Figure 5a shows the horizontal oscillation amplitudes of all bunches versus time for a beam-loss example, while Fig. 5b shows the temporal evolution of the respective mode spec- trum. In this example, the multi-bunch mode 12 is signifi- cantly increased, which might be responsible for the beam loss.
Figure 5: Horizontal bunch position in the time domain (a) and corresponding mode spectrum (b).
Injection
As shown in Ref. [4, 7], the feedback systems can be synchronized with the injection trigger to analyze the in- fluence of the injection kicker bump on the oscillation of the stored electron bunches. At DELTA, three kickers are used to create a bump for about 2 turns (∼1μs). As shown in Ref. [4], these excitations influence the beam for sev- eral thousand revolutions (∼1 ms). In addition, the dipole magnets of the transfer channel from the synchrotron to the storage ring, which are not permanently activated but ramped several ms before the injection kickers, create a dis- turbance over 100 ms. In Fig. 6, the horizontal rms bunch position is shown versus time for the standard injection pro- cess and with reduced voltage of the dipoles in the transfer channel. With a reduced voltage, no injection is possible, but the measurement shows the strong influence of these dipoles on the electron oscillations.
0 20 40 60 80 100 120 140 160 180 200
0 20 40 60 80 100
rms (a.u.)
time (ms)
reduced T2 dipoles standard operation
Figure 6: Beam oscillation versus time during the injec- tion for two different configurations of the transfer-channel dipoles. The spike at about 75 ms results from the short- term oscillations due to the kicker bump mismatch.
In Fig. 7, the voltage of the first injection kicker is var- ied while observing the change in oscillation amplitude and loss current. Beyond a certain range of the kicker voltage, the kicker bump is detuned in such a way that the stored electrons are lost. In order to measure the correct loss cur- rent, the electron gun was disabled during this experiment.
The measurement shows zero loss current when the bunch oscillations are reduced. On the other hand, there is a volt- age range in which the bunches oscillate without causing any loss current. The final goal of this and other measure- ments is to study the injection process and to provide the operator with a tool to optimize the injection parameters.
18 19 20 21 22 23
700 750 800 850 900
osc. amplitude (a.u.)
kicker voltage (kV)
18 19 20 21 22 23 0
0.2 0.4 0.6 0.8
loss current (mA)
Figure 7: Bunch oscillation amplitudes and loss current due to a mismatch of the injection kickers under variation of the voltage of the first kicker.
OUTLOOK
Ongoing simulations aim at improving the understand- ing of the inter-bunch coupling leading to the results shown in this paper. Furthermore, an automated readout of rele- vant bunch oscillation data during injection is planned to visualize bunch oscillations in order to assist the operator in improving the injection efficiency.
ACKNOWLEDGMENT
It is a pleasure to thank our colleagues at DELTA and the Faculty of Physics for their continuous support. The project has profited strongly from the expertise of D. Teytelman (Dimtel Inc.).
REFERENCES
[1] S. Khan et al., Sync. Rad. News 24, 18 (2011).
[2] Dimtel Inc. http://www.dimtel.com.
[3] T. Knuth, S. Khan, Proc. PAC 1999, New York, 1147.
[4] M. H¨oner et. al., Proc. IPAC 2012, New Orleans, 809.
[5] Chao, A. W., Physics of Collective Beam Instabilities in High Energy Accelerators, New York, 1993.
[6] P. Ungelenk et al., this conference (MOPEA014).
[7] D. Teytelman, F.-J. Decker, Proc. DIPAC 2007, Venice, 322.
Proceedings of IPAC2013, Shanghai, China MOPME008
06 Instrumentation, Controls, Feedback and Operational Aspects T03 Beam Diagnostics and Instrumentation
ISBN 978-3-95450-122-9 487 Copyrightc○2013byJACoW—ccCreativeCommonsAttribution3.0(CC-BY-3.0)