Hepatobiliary MRI: Signal intensity based assessment of liver function correlated to 13 C-Methacetin breath test
Michael Haimerl
1, Ute Probst
1, Stefanie Poelsterl
1, Lukas Beyer
1, Claudia Fellner
1, Michael Selgrad
2, Matthias Hornung
3, Christian Stroszczynski
1& Philipp Wiggermann
1Gadoxetic acid (Gd-EOB-DTPA) is a paramagnetic MRI contrast agent with raising popularity and has been used for evaluation of imaging-based liver function in recent years. In order to verify whether liver function as determined by real-time breath analysis using the intravenous administration of
13
C-methacetin can be estimated quantitatively from Gd-EOB-DTPA-enhanced MRI using signal intensity (SI) values. 110 patients underwent Gd-EOB-DTPA-enhanced 3-T MRI and, for the evaluation of liver function, a
13C-methacetin breath test (
13C-MBT). SI values from before (SI
pre) and 20 min after (SI
post) contrast media injection were acquired by T1-weighted volume-interpolated breath-hold examination (VIBE) sequences with fat suppression. The relative enhancement (RE) between the plain and contrast-enhanced SI values was calculated and evaluated in a correlation analysis of
13C-MBT values to SI
postand RE to obtain a SI-based estimation of
13C-MBT values. The simple regression model showed a log-linear correlation of
13C-MBT values with SI
postand RE (p < 0.001). Stratified by 3 different categories of
13C-MBT readouts, there was a constant significant decrease in both SI
post(p ≤ 0.002) and RE (p ≤ 0.033) with increasing liver disease progression as assessed by the
13C-MBT. Liver function as determined using real-time
13C-methacetin breath analysis can be estimated quantitatively from Gd- EOB-DTPA-enhanced MRI using SI-based indices.
To monitor patients with hepatic dysfunction, various liver function tests are used routinely in clinical practice.
These tests may evaluate the increasing severity of illness, differ between stages of disease and offer a prediction of therapy outcome
1–3. The routine part of clinical investigations is based on analysis, where the levels of non-volatile compounds, such as proteins and ions, are measured and checked for abnormalities. As a complement to blood parameters, volatile compounds carry information concerning the biochemical status of the individual, which might be examined via breath tests
4–10.
Different orally or intravenously administered
13C-labeled substrates can reflect the function of specific hepatocyte compartments in real time as they are processed by liver function-dependent metabolic pathways.
Therefore, cytosolic, mitochondrial and microsomal processes can be investigated non-invasively to obtain infor- mation about site-specific physiological and pathological metabolism
5. A novel approach, which is already used in clinical routine, is the
13C-methacetin breath test (
13C-MBT) established by Stockmann et al.
11. The principle underlying this real-time test is the ability to metabolize
13C-labeled methacetin by the hepatocyte endoplasmic reticulum-located cytochrome P
4501A2 (CYP1A2) into paracetamol and
13C-labeled formaldehyde, which will be eliminated as
13CO
25,11–13. After intravenous (i.v.) injection,
13CO
2will be exhaled, and a
13CO
2:
12CO
2ratio can be determined by a suitable device for breath analysis. Based on the values obtained by the
13C-MBT, real-time information of patients’ liver function can be directly obtained.
The hepatocyte-specific magnetic resonance imaging (MRI) contrast agent gadoxetic acid (Gd-EOB-DTPA) has been established and used for diagnostic purposes to detect and characterize focal liver lesions. Several studies have reported the use of Gd-EOB-DTPA-based MRI to evaluate liver function, usually expressed via the
1
Department of Radiology, University Hospital Regensburg, Regensburg, Germany.
2Department of Internal Medicine I, University Hospital Regensburg, Regensburg, Germany.
3Department of Surgery, University Hospital Regensburg, Regensburg, Germany. Correspondence and requests for materials should be addressed to M. Haimerl (email: michael.haimerl@ukr.de)
Received: 9 March 2018 Accepted: 1 June 2018 Published: xx xx xxxx
OPEN
Child-Pugh score. However, no studies have yet compared the direct assessment of hepatic metabolic capacity and the indirect estimation of liver function based on MRI.
The purpose of this retrospective analysis was to evaluate the diagnostic performance of the Gd-EOB- DTPA-enhanced signal intensity (SI)-based quantification of liver function compared with an established liver function test, the
13C-MBT.
Results
The baseline characteristics of the 110 patients (83 men and 27 women; mean age, 60.84 ± 9.52 years; range, 39–82 years) who were included in this study and underwent a
13C-MBT and T1-weighted VIBE MRI are sum- marized in Table 1. Representative T1-weighted MRI scans and the corresponding SI-based indices, SI
pre, SI
postand RE, are shown in Figs 1 and 2.
SI in T1-weighted MRI scans compared with
13C-MBT readout. In a simple linear regression model, RE values were strong linear predictors of the logarithmic values of uncategorized
13C-MBT readout values (r = 0.665, p < 0.001), while the SI values obtained from the HBP showed less predictive power (r = 0.554, p < 0.001). In contrast, SI values obtained without contrast enhancement showed no significant correlation (p = 0.120) (Table 2). Scatterplots of SI
pre, SI
postand RE values plotted against the logarithmic values of
13C-MBT are shown in Fig. 2.
SI-based results compared with
13C-MBT readout categories. Patients with normal liver function (Category 1) had a mean
13C-MBT readout of 391.21 ± 53.28 µg/kg/h, whereas patients with intermediate liver function (category 2) had a mean
13C-MBT readout value of 217.78 ± 49.39 µg/kg/h, and patients with severely impaired liver function had a mean
13C-MBT readout value of 93.03 ± 33.59 µg/kg/h (Table 1). All pairwise com- parisons between Categories 1, 2 and 3 showed significant differences (p ≤ 0.05) in the evaluated SI-based indices, except for SI
prevalues between Categories 1 and 3 and Categories 2 and 3 (Fig. 3A). The SI values obtained from the HBP (SI
post; p < 0.005; Fig. 3B) and the RE values (p < 0.05; Fig. 3C) differed significantly among the three
13
C-MBT based categories.
Discussion
One of the most common types of liver cancer is HCC, with a global cancer mortality rate of 9.1%
14. As HCC is mostly based on preexisting liver cirrhosis, the early detection and assessment of liver cirrhosis is of high clinical relevance. Patients benefit from rapid and accurate examinations of the liver condition. Thus, the
13C-MBT has become more common, as it can provide liver failure predictions, liver transplant control, and liver disease sever- ity estimations
13,15–17. The test is based on the analysis of volatile components exhaled during the
13C-methacetin metabolism by CYP1A2 in the endoplasmic reticulum
12. Different studies have demonstrated the predictive power of enzymatic hepatocyte functionality for liver resection
13,15,17–21. Even in cases of non-cirrhotic, early-stage and primary biliary cirrhosis, the
13C-MBT can reliably indicate decreased liver function
10. Nevertheless, this tool has some diagnostic restrictions, as it is unable to determine and distinguish between areas of reduced hepato- cyte function and healthy areas. Therefore,
13C-MBT values describe the function of the whole liver. However, diagnostic imaging techniques might provide these details, which are crucial for both liver resection and liver transplantation. To reduce the number of different examinations, researchers aim to establish liver tests capable of not only reliably reflecting liver function but also revealing hepatic lesions in a single examination.
To this end, Gd-EOB-DTPA-enhanced MRI has been established as a promising approach for assessing liver function in the past few years. Gd-EOB-DTPA consists of a gadolinium ion covalently bound to a lipophilic eth- oxybenzyl group and is absorbed by intact hepatocytes via triggered ATP-dependent organic anion-transporting polypeptide (OATP1 B1/B3) channels. Subsequently, Gd-EOB-DTPA will be excreted by multidrug-resistance protein 2 (MRP2) into the biliary system
22–24. The strength of Gd-EOB-DTPA is its hepatocyte-specific character, which improves the contrast-to-noise ratio, as it will not be taken up by cells other than hepatocytes (e.g., cells in
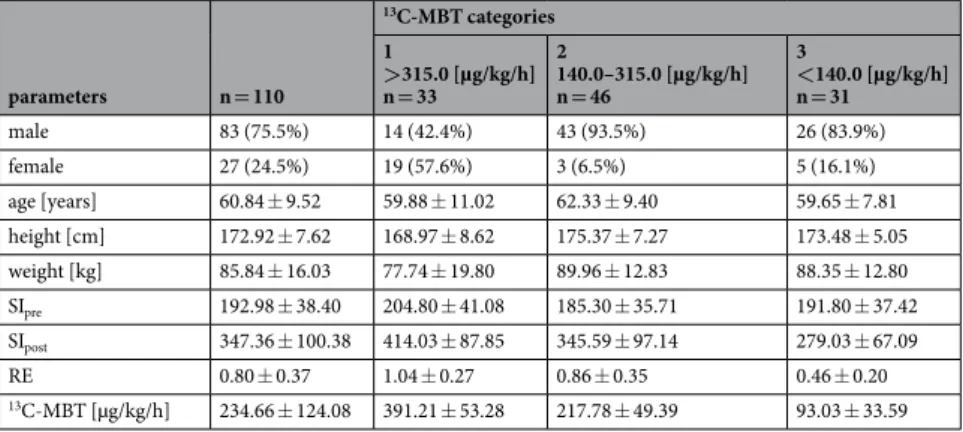
parameters n = 110
13C-MBT categories 1>315.0 [µg/kg/h]
n = 33
2140.0–315.0 [µg/kg/h]
n = 46
3<140.0 [µg/kg/h]
n = 31
male 83 (75.5%) 14 (42.4%) 43 (93.5%) 26 (83.9%)
female 27 (24.5%) 19 (57.6%) 3 (6.5%) 5 (16.1%)
age [years] 60.84 ± 9.52 59.88 ± 11.02 62.33 ± 9.40 59.65 ± 7.81 height [cm] 172.92 ± 7.62 168.97 ± 8.62 175.37 ± 7.27 173.48 ± 5.05 weight [kg] 85.84 ± 16.03 77.74 ± 19.80 89.96 ± 12.83 88.35 ± 12.80
SIpre 192.98 ± 38.40 204.80 ± 41.08 185.30 ± 35.71 191.80 ± 37.42
SIpost 347.36 ± 100.38 414.03 ± 87.85 345.59 ± 97.14 279.03 ± 67.09
RE 0.80 ± 0.37 1.04 ± 0.27 0.86 ± 0.35 0.46 ± 0.20
13C-MBT [µg/kg/h] 234.66 ± 124.08 391.21 ± 53.28 217.78 ± 49.39 93.03 ± 33.59
Table 1. Characteristics for all patients and each
13C-MBT readout category. Values indicate the mean ±
standard deviation. RE: relative enhancement as a function of SI-based indices. SI: mean signal intensity of the
liver.
13C-MBT:
13C-labeled methacetin metabolism liver function breath test.
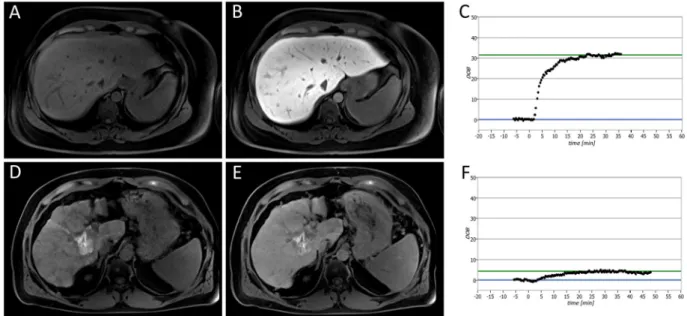
Figure 1. Liver function analysis in patients with normal liver function (A,B,C) and severely impaired liver function (D,E,F). The patients underwent plain (A,D) and Gd-EOB-DTPA-enhanced HBP (B,E) T1-weighted VIBE sequences with fat suppression, as well as a
13C-MBT, over a maximum time span of 60 min (C,F). In the case of the displayed patients, a
13C-MBT readout value of 409 µg/kg/h (C) was considered normal liver function (SI
pre, 182.67; SI
post, 441.67; RE, 1.42), while a
13C-MBT readout value of 57 µg/kg/h (F) was considered impaired liver function (SI
pre, 258.50; SI
post, 332.83; RE, 0.29). The lesion observed in the liver with impaired function (D,E) was caused by former radiofrequency ablations treatments. The delta-over-baseline (DOB) was assessed inline automatically and describes the increase in the R
PDB-corrected
13CO
2:
12CO
2ratio to the basal value (blue line). The evaluated
13C-MBT value was calculated as the product of the DOB
max, R
PDB, CO
2production and molar mass of
13C-methacetin per body weight
13. The DOB
max(green line) was defined after an increase in DOB was no longer observable. At the time point 0, the
13C-methacetin was applied via bolus injection.
Figure 2. Correlation analysis of SI-based liver function indices to logarithmic values of
13C-MBT readout in scatterplots. The SI values obtained without contrast enhancement (SI_pre) show no predictive power for the logarithmic values of
13C-MBT (r = 0.213, p = 0.120; A), while the contrast-enhanced SI values (SI_post) show a significant correlation (r = 0.554, p < 0.001; B). A strong linear prediction of logarithmic
13C-MBT values can be observed for the relative enhancement (RE) values (r = 0.665, p < 0.001; C).
B (95% CI) p-value r
Log(13C-MBT)
RE 0.507 (0.398–0.615) <0.001 0.665 SIpre 0.001 (−0.001–0.002) 0.213 0.120 SIpost 0.002 (0.001–0.002) <0.001 0.554
Table 2. Simple linear regression models of SI-based indices with logarithmic values of
13C-MBT. RE: relative enhancement as a function of SI-based indices. SI: mean signal intensity of the liver.
13C-MBT:
13C-labeled methacetin metabolism liver function breath test. r: correlation coefficient. B: linear regression coefficient. CI:
confidence interval.
metastatic lesions)
25–27. At 20 min after contrast agent application, a significant increase in the SI of the liver paren- chyma is recorded, and the extent of this phenomenon is dependent on the integrity of the liver parenchyma. The highest SI is exhibited by healthy liver tissue, while cirrhotic liver parenchyma shows only a slight increase in SI
28,29. A loss of functioning hepatocytes, bridging of portal spaces or nodular regeneration of the liver parenchyma is associated with liver cirrhosis and hindered hepatocyte contrast agent uptake, causing decreased SI-based values
30.
The estimation of SI-based indices provides insights into regional hepatocyte-specific function, efficiency, functionality and condition
31. Nevertheless, the analysis is restricted by the relative character of the obtained SI values
32. However, by the mathematical computation of SI
postwith SI
pre, a liver function index with increased reliability can be achieved. By calculating the RE, we correct the enhanced SI values to gain a SI ratio independent from artificial signal enhancement with increased explanatory power
29,33–38.
To the best of our knowledge, this is the first study comparing SI-based MRI values reflecting hepatocyte OATP1 B1/B3 and MRP2 pathway activity with the
13C-MBT.
We could demonstrate that the SI-based MRI values assessed in the HBP reflect liver function in a suita- ble manner, as estimated by
13C-MBT readout values. Similar to a previous study
39, we observed that patients with normal liver function expressed the highest SI-based values (Category 1: SI
pre, 204.80 ± 41.08; SI
post, 414.03 ± 87.85; RE, 1.04 ± 0.27), while patients with decreased liver function showed decreased SI-based values (Category 2: SI
pre, 185.30 ± 35.71; SI
post, 345.59 ± 97.14, RE, 0.86 ± 0.35; Category 3: SI
pre, 191.80 ± 37.42; SI
post, 279.03 ± 67.09; RE, 0.46 ± 0.20). In a correlation analysis of SI-based indices to
13C-MBT values, we were able to show that SI-based RE values significantly support the
13C-MBT findings (RE, r = 0.665, p < 0.001) and there- fore reflect liver functionality. Similar to Utsunomiya et al.
31, in this study, we tested the correlation of the mean SI obtained after contrast agent application (SI
post) to the results of a liver function test. In their case, the tested SI values showed a higher prediction of indocyanine green dye (ICG) retention at 15 min (r = − 0.67, p < 0.01) than we obtained when testing against
13C-MBT values (r = 0.554, p < 0.001). However, this difference seems plausible because the ICG clearance test is, similar to the GD-EOB-DTPA pathway, dependent from OATP trans- porter activity. Therefore, we expected a slightly less pronounced correlation between the
13C-MBT and SI-based values, as the
13C-MBT relies on an enzymatic metabolism, whereas contrast-enhanced MRI relies on OATP channel-triggered contrast agent uptake. In general, the ICG clearance test has certain limitations, as constant hemodynamic conditions (stable liver perfusion rate and hepatic blood flow) are required for liver function analysis
40–42and, in cases of cholestasis and hyperbilirubinemia, carrier competition of bilirubin and ICG at the OATP1 transporter might occur
43,44. It is also known that various drugs (e.g., rifampicin) exert inhibitory effects on the OATP pathway and might influence hepatocyte ICG uptake
45,46. Similar to the findings of Tamada et al.
36, we could show that the RE of the liver parenchyma serves as a reliable tool for liver function classification, as the RE significantly differs among different stages of liver function (p ≤ 0.02). Additionally, it has been shown that the hepatic enhancement during Gd-EOB-DTPA-enhanced MRI is strongly affected by the degree of liver cirrhosis, as expressed by the ICG test, the Child-Pugh score or the MELD score
34,47. These studies have shown that Gd-EOB-DTPA-enhanced MRI has potential as a reliable tool for liver function estimation in addition to its already established implementation for hepatic lesion detection.
Our study has several limitations. First, ROI placement may cause some variations due to the possible nonho- mogeneous distribution of parenchymal changes. However, using the average of six repeated ROI measurements across an area of the liver parenchyma should provide reliable values. Second, this study was retrospective in nature, with only a limited patient population. Third, the lack of histopathology is another potential limitation.
In conclusion, SI-based indices, such as the RE and contrast-enhanced SI values, can be used to determine liver function as assessed by
13C-MBT.
Materials and Methods
Patients. Local institutional review board approval of the University Hospital Regensburg was obtained for
13C-MBT and Gd-EOB-DTPA-enhanced MRI at 3 T. Only data from written informed consent patients were included for this analysis, also the study was performed in accordance with the relevant guidelines and regulations.
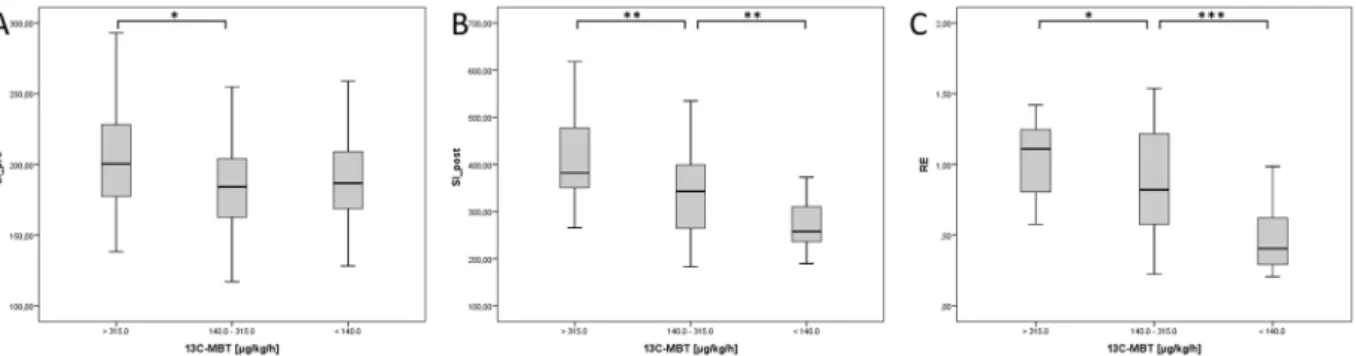
Figure 3. Boxplot analysis of SI-based indices separated by
13C-MBT readout categories. Native SI values (SI_
pre; A) show no significant difference between the different
13C-MBT readout categories, except for Categories
1 and 2. SI values obtained after contrast enhancement (SI_post; B) and corrected by native SI values (RE; C)
show significant differences among the
13C-MBT readout categories. *p < 0.05; **p < 0.01; ***p < 0.001.
The retrospective analysis includes 110 patients (83 men and 27 women; median age, 61 years) who underwent both a
13C-MBT and Gd-EOB-DTPA-enhanced MRI at 3 T. The patients underwent Gd-EOB-DTPA-enhanced T1-weighted volume-interpolated breath-hold examination (VIBE) MRI sequences with fat suppression. The included patients did not have known reactivity to liver-specific MRI contrast media,
13C-methacetin intolerance or renal-specific contraindications to either MRI and Gd-EOB-DTPA administration.
The patients underwent MRI and a liver function test for the following reasons:
• active hepatocellular carcinoma monitoring in the case of no (n = 1) or known liver cirrhosis (n = 30)
• follow-up in the case of known secondary malignancy (cholangiocarcinoma, n = 3; duodenal carcinoma, n = 1; rectal cancer, n = 4; sigma carcinoma, n = 2; uveal melanoma, n = 1) or benign hepatic lesion (focal nodular hyperplasia (FNH), n = 1; hemangioma, n = 3)
• preinterventional assessment in the case of known hepatocellular carcinoma (HCC) (n = 6) or known sec- ondary liver malignancy / focal hepatic lesion (cholangiocarcinoma, n = 2; hemangioma, n = 1; mamma car- cinoma, n = 1; rectal cancer, n = 4; sigma carcinoma, n = 1)
• postinterventional assessment in the case of known HCC (n = 19) or known secondary liver malignancy (cholangiocarcinoma, n = 3; colon carcinoma, n = 1; mamma carcinoma, n = 1; rectal cancer, n = 1; sigma carcinoma, n = 2; thymoma, n = 1)
• in the case of suspected liver disease or focal hepatic lesions with known cirrhosis (n = 12), overlap syndrome (n = 1), Budd-Chiari syndrome (n = 1), cholangiocarcinoma (n = 2), carcinoid of the ileum (n = 1), rectal cancer (n = 3), or sigma carcinoma (n = 1)
The main reasons for liver cirrhosis were alcoholic steatohepatitis (n = 30), hepatitis B infection (n = 12) and hepatitis C infection (n = 13). Only 2 patients suffered from non-alcoholic steatohepatitis (NASH). Detailed insights in underlying disease can be seen in Table 3.
13
C-MBT. The
13C-MBT was performed 24 h before or after the MRI scan, according to published recom- mendations
11,13. The patients fasted for at least 3 hours before the
13C-MBT. Ten minutes before the i.v. injection of
13C-methacetin, a breath
13CO
2:
12CO
2ratio control was recorded to calculate the delta-over-baseline (DOB).
Then, 2 mg/kg body weight
13C-methacetin was injected via i.v. bolus and flushed with 20 mL of 0.9% sodium chloride. The volatile analysis, performed by modified nondispersive isotope-selective infrared spectroscopy (FANci2-db16, Fischer Analysen Instrumente, Leipzig, Germany), was started immediately after the injection to track the hepatocyte-specific enzymatic
13CO
2production.
For the statistical analysis, the patients were grouped according to their
13C-MBT readout into 3 categories:
patients with normal liver function (Category 1):
13C-MBT > 315 [ µ g/kg/h]; patients with intermediate liver func- tion (Category 2):
13C-MBT 315–140 [ µ g/kg/h]; and patients with severely impaired liver function (Category 3):
13
C-MBT < 140 [ µ g/kg/h]
13,16.
MRI. All imaging was performed using a clinical whole-body 3-T system (MAGNETOM Skyra, Siemens Healthcare, Erlangen, Germany). T1-weighted VIBE sequences with fat suppression (repetition time (TR), 3.09 ms; echo time (TE), 1.17 ms, 2.49 ms; flip angle, 10°; parallel imaging factor, 2; slices, 64; reconstructed voxel size, 1.25 × 1.25 × 3.0 mm
3; measured voxel size, 1.71 × 1.25 × 4.5 mm
3; acquisition time, 14 sec) were acquired during breath-holding before and 20 min after Gd-EOB-DTPA (Primovist ® , Bayer Healthcare, Berlin) adminis- tration. Every sequence covered the entire liver before Gd-EOB-DTPA administration and in the hepatobiliary phase (HBP) after 20 min.
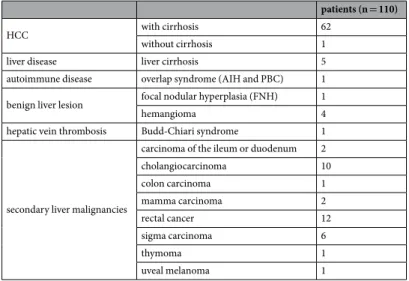
patients (n = 110)
HCC with cirrhosis 62
without cirrhosis 1
liver disease liver cirrhosis 5
autoimmune disease overlap syndrome (AIH and PBC) 1 benign liver lesion focal nodular hyperplasia (FNH) 1
hemangioma 4
hepatic vein thrombosis Budd-Chiari syndrome 1
secondary liver malignancies
carcinoma of the ileum or duodenum 2
cholangiocarcinoma 10
colon carcinoma 1
mamma carcinoma 2
rectal cancer 12
sigma carcinoma 6
thymoma 1
uveal melanoma 1
Table 3. Underlying diseases for MRI examination and
13C-MBT for each medical case.
The patients received a Gd-EOB-DTPA dose (0.025 mmol/kg body weight) adapted to their body weight administered via bolus injection at a flow rate of 1 mL/s, followed by 20 mL of 0.9% sodium chloride.
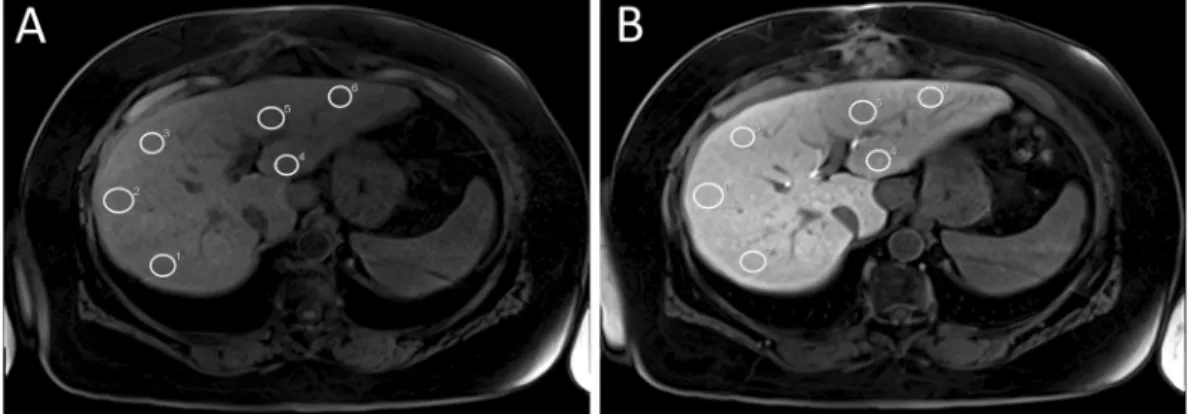
Image analysis. Operator-defined region-of-interest (ROI) measurements were used to obtain the mean SI values from the T1-weighted VIBE images (before and after Gd-EOB-DTPA injection). ROIs were manually placed at identical locations in every sequence, avoiding liver lesions, major branches of the portal and hepatic veins, and imaging artifacts. In total, 6 ROIs (3 each in the right and left lobes) were defined in the VIBE images (Fig. 4). Each ROI was a circle that was made as large as possible (liver parenchyma: 1.1 cm
2–4.6 cm
2) and manu- ally adjusted between sequences if necessary.
The relative enhancement (RE) of the liver was calculated according to following formula:
= −
RE SI post SI pre
SI pre (1)
Statistical analysis. The different
13C-MBT readout categories were compared as non-parametric independ- ent samples by the Mann-Whitney-U test. The predictive power of SI-based indices was determined by simple linear regression models, and the optimal curve fit was assessed visually. In all tests, the statistical significance level was set to 0.05 (two-sided). All analyses were performed using SPSS software (version 24; IBM, Chicago, IL, USA).
Data availability. All data that support the findings of this study are provided in the manuscript. Raw data used in this work are available on reasonable request.
References
1. Morris-Stiff, G., Gomez, D. & Prasad, R. Quantitative assessment of hepatic function and its relevance to the liver surgeon. J Gastrointest Surg 13, 374–385, https://doi.org/10.1007/s11605-008-0564-1 (2009).
2. Guglielmi, A., Ruzzenente, A., Conci, S., Valdegamberi, A. & Iacono, C. How much remnant is enough in liver resection? Dig Surg 29, 6–17, https://doi.org/10.1159/000335713 (2012).
3. Schreckenbach, T., Liese, J., Bechstein, W. O. & Moench, C. Posthepatectomy liver failure. Dig Surg 29, 79–85, https://doi.
org/10.1159/000335741 (2012).
4. Candelli, M. et al. 13C-methionine breath tests for mitochondrial liver function assessment. Eur Rev Med Pharmacol Sci 12, 245–249 (2008).
5. Afolabi, P., Wright, M., Wootton, S. A. & Jackson, A. A. Clinical utility of 13C-liver-function breath tests for assessment of hepatic function. Dig Dis Sci 58, 33–41, https://doi.org/10.1007/s10620-012-2340-z (2013).
6. Armuzzi, A. et al. Breath testing for human liver function assessment. Aliment Pharmacol Ther 16, 1977–1996, https://doi.
org/10.1046/j.0269-2813.2002.01374.x (2002).
7. Candelli, M. et al. 13C-methacetin breath test for monitoring hepatic function in cirrhotic patients before and after liver transplantation. Aliment Pharmacol Ther 19, 243, https://doi.org/10.1046/j.1365-2036.2003.01824.x (2004).
8. Candelli, M. et al. 13C-breath tests in the study of mitochondrial liver function. Eur Rev Med Pharmacol Sci 8, 23–31 (2004).
9. Grattagliano, I., Lauterburg, B. H., Palasciano, G. & Portincasa, P. 13C-breath tests for clinical investigation of liver mitochondrial function. Eur J Clin Invest 40, 843–850, https://doi.org/10.1111/j.1365-2362.2010.02331.x (2010).
10. Holtmeier, J. et al. 13C-methacetin and 13C-galactose breath tests can assess restricted liver function even in early stages of primary biliary cirrhosis. Scand J Gastroenterol 41, 1336–1341, https://doi.org/10.1080/00365520600670125 (2006).
11. Stockmann, M. et al. Prediction of postoperative outcome after hepatectomy with a new bedside test for maximal liver function capacity. Ann Surg 250, 119–125, https://doi.org/10.1097/SLA.0b013e3181ad85b5 (2009).
12. Palmer, C. N. A., Coates, P. J., Davies, S. E., Shephard, E. A. & Phillips, I. R. Localization of cytochrome P-450 gene expression in normal and diseased human liver by in situ hybridization of wax-embedded archival material. Hepatology 16, 682–687, https://doi.
org/10.1002/hep.1840160311 (1992).
13. Stockmann, M. et al. The LiMAx test: a new liver function test for predicting postoperative outcome in liver surgery. HPB (Oxford) 12, 139–146, https://doi.org/10.1111/j.1477-2574.2009.00151.x (2010).
14. Ferlay, J. et al. Cancer incidence and mortality worldwide: Sources, methods and major patterns in GLOBOCAN 2012. Int J Cancer 136, E359–E386, https://doi.org/10.1002/ijc.29210 (2015).
Figure 4. Representative example of ROI placement in unenhanced (A) and Gd-EOB-DTPA-enhanced VIBE
(B) scans of a patient with normal liver function. White circles mark ROIs manually placed at identical places in
the right and left lobe of the liver.
15. Lock, J. F. et al. Early diagnosis of primary nonfunction and indication for reoperation after liver transplantation. Liver Transpl 16, 172–180, https://doi.org/10.1002/lt.21973 (2010).
16. Stockmann, M. et al. How to define initial poor graft function after liver transplantation? - a new functional definition by the LiMAx test. Transpl Int 23, 1023–1032, https://doi.org/10.1111/j.1432-2277.2010.01089.x (2010).
17. Stockmann, M. et al. 1073 Accurate Diagnosis and grading of cirrhosis using the new LiMAx test. J Hepatol 56, S422, https://doi.
org/10.1016/S0168-8278(12)61085-X (2012).
18. Jara, M. et al. Prognostic value of enzymatic liver function for the estimation of short-term survival of liver transplant candidates: a prospective study with the LiMAx test. Transpl Int 28, 52–58, https://doi.org/10.1111/tri.12441 (2015).
19. Malinowski, M. et al. Enzymatic liver function capacity correlates with disease severity of patients with liver cirrhosis: a study with the LiMAx test. Dig Dis Sci 59, 2983–2991, https://doi.org/10.1007/s10620-014-3250-z (2014).
20. Kaffarnik, M. F. et al. Early diagnosis of sepsis-related hepatic dysfunction and its prognostic impact on survival: a prospective study with the LiMAx test. Crit Care 17, R259, https://doi.org/10.1186/cc13089 (2013).
21. Lock, J. F. et al. Predicting the prognosis in acute liver failure: results from a retrospective pilot study using the LiMAx test. Ann Hepatol 12, 556–562 (2013).
22. Ringe, K. I. Diagnosis and differential diagnosis of focal liver lesions using the hepatocyte-specific contrast agent Gd-EOB-DTPA.
Radiologie up2date 16, 15–32, https://doi.org/10.1055/s-0042-102037 (2016).
23. Leonhardt, M. et al. Hepatic uptake of the magnetic resonance imaging contrast agent Gd-EOB-DTPA: role of human organic anion transporters. Drug Metab Dispos 38, 1024–1028, https://doi.org/10.1124/dmd.110.032862 (2010).
24. Nassif, A. et al. Visualization of hepatic uptake transporter function in healthy subjects by using gadoxetic acid-enhanced MR imaging. Radiology 264, 741–750, https://doi.org/10.1148/radiol.12112061 (2012).
25. Reimer, P. et al. Phase II clinical evaluation of Gd-EOB-DTPA: dose, safety aspects, and pulse sequence. Radiology 199, 177–183, https://doi.org/10.1148/radiology.199.1.8633143 (1996).
26. Clemént, O. et al. Comparison of Gd-EOB-DTPA and Gd-DTPA for contrast-enhanced MR imaging of liver tumors. J Magn Reson Imaging 3, 71–77, https://doi.org/10.1002/jmri.1880030113 (1993).
27. Stern, W. et al. Dynamic MR imaging of liver metastases with Gd-EOB-DTPA. Acta Radiol 41, 255–262, https://doi.org/10.1034/
j.1600-0455.2000.041003255.x (2000).
28. Hamm, B. et al. Phase I clinical evaluation of Gd-EOB-DTPA as a hepatobiliary MR contrast agent: safety, pharmacokinetics, and MR imaging. Radiology 195, 785–792, https://doi.org/10.1148/radiology.195.3.7754011 (1995).
29. Nishie, A. et al. MR prediction of liver fibrosis using a liver-specific contrast agent: superparamagnetic iron oxide versus Gd-EOB- DTPA. J Magn Reson Imaging 36, 664–671, https://doi.org/10.1002/jmri.23691 (2012).
30. Popper, H. Pathologic aspects of cirrhosis. A review. The American Journal of Pathology 87, 228–264 (1977).
31. Utsunomiya, T. et al. Possible utility of MRI using Gd-EOB-DTPA for estimating liver functional reserve. J Gastroenterol 47, 470–476, https://doi.org/10.1007/s00535-011-0513-8 (2012).
32. Haimerl, M. et al. Gd-EOB-DTPA-enhanced MRI for evaluation of liver function: Comparison between signal-intensity-based indices and T1 relaxometry. Sci Rep 7, 43347, https://doi.org/10.1038/srep43347 (2017).
33. Yoneyama, T. et al. Efficacy of liver parenchymal enhancement and liver volume to standard liver volume ratio on Gd-EOB-DTPA- enhanced MRI for estimation of liver function. Eur Radiol 24, 857–865, https://doi.org/10.1007/s00330-013-3086-5 (2014).
34. Verloh, N. et al. Assessing liver function by liver enhancement during the hepatobiliary phase with Gd-EOB-DTPA-enhanced MRI at 3 Tesla. Eur Radiol 24, 1013–1019, https://doi.org/10.1007/s00330-014-3108-y (2014).
35. Motosugi, U. et al. Staging liver fibrosis by using liver-enhancement ratio of gadoxetic acid-enhanced MR imaging: comparison with aspartate aminotransferase-to-platelet ratio index. Magn Reson Imaging 29, 1047–1052, https://doi.org/10.1016/j.mri.2011.05.007 (2011).
36. Tamada, T. et al. Gd-EOB-DTPA-enhanced MR imaging: evaluation of hepatic enhancement effects in normal and cirrhotic livers.
Eur J Radiol 80, e311–316, https://doi.org/10.1016/j.ejrad.2011.01.020 (2011).
37. Watanabe, H. et al. Staging hepatic fibrosis: comparison of gadoxetate disodium-enhanced and diffusion-weighted MR imaging–preliminary observations. Radiology 259, 142–150, https://doi.org/10.1148/radiol.10100621 (2011).
38. Motosugi, U. et al. Liver parenchymal enhancement of hepatocyte-phase images in Gd-EOB-DTPA-enhanced MR imaging: which biological markers of the liver function affect the enhancement? J Magn Reson Imaging 30, 1042–1046, https://doi.org/10.1002/
jmri.21956 (2009).
39. Verloh, N. et al. Liver fibrosis and Gd-EOB-DTPA-enhanced MRI: A histopathologic correlation. Sci Rep 5, 15408, https://doi.
org/10.1038/srep15408 (2015).
40. Janssen, M. W. W. et al. Indocyanine green R15 ratio depends directly on liver perfusion flow rate. J Hepatobiliary Pancreat Sci 17, 180–185, https://doi.org/10.1007/s00534-009-0160-0 (2010).
41. Sakka, S. G. Indocyanine green plasma disappearance rate during relief of increased abdominal pressure. Intensive Care Med 32, 2090–2091, https://doi.org/10.1007/s00134-006-0411-3 (2006).
42. Spiegel, T. et al. Perioperative monitoring of indocyanine green clearance and plasma disappearance rate in patients undergoing liver transplantation. Der Anaesthesist 51, 359–366, https://doi.org/10.1007/s00101-002-0290-0 (2002).
43. De Gasperi, A., Mazza, E. & Prosperi, M. Indocyanine green kinetics to assess liver function: Ready for a clinical dynamic assessment in major liver surgery? World J Hepatol 8, 355–367, https://doi.org/10.4254/wjh.v8.i7.355 (2016).
44. Stockmann, M., Malinowski, M., Lock, J. F., Seehofer, D. & Neuhaus, P. Factors influencing the indocyanine green (ICG) test:
Additional impact of acute cholestasis. Hepatogastroenterology 56, 734–738 (2009).
45. Vavricka, S. R., van Montfoort, J., Ha, H. R., Meier, P. J. & Fattinger, K. Interactions of rifamycin SV and rifampicin with organic anion uptake systems of human liver. Hepatology 36, 164–172, https://doi.org/10.1053/jhep.2002.34133 (2002).
46. Cusin, F. et al. Hepatocyte Concentrations of Indocyanine Green Reflect Transfer Rates Across Membrane Transporters. Basic and clinical pharmacology and toxicology 120, 171–178, https://doi.org/10.1111/bcpt.12671 (2017).
47. Verloh, N. et al. Impact of liver cirrhosis on liver enhancement at Gd-EOB-DTPA enhanced MRI at 3 Tesla. Eur J Radiol 82, 1710–1715, https://doi.org/10.1016/j.ejrad.2013.05.033 (2013).