Liver fibrosis and Gd-EOB-DTPA- enhanced MRI: A histopathologic correlation
Niklas Verloh1, Kirsten Utpatel2, Michael Haimerl1, Florian Zeman3, Claudia Fellner1, Stefan Fichtner-Feigl4, Andreas Teufel5, Christian Stroszczynski1, Matthias Evert2 &
Philipp Wiggermann1
Gadolinium ethoxybenzyl-diethylenetriaminepentaacetic acid (Gd-EOB-DTPA) is a hepatocyte-specific MRI contrast agent. Because the hepatic uptake of Gd-EOB-DTPA depends on the integrity of the hepatocyte mass, this uptake can be quantified to assess liver function. We report the relationship between the extent of Gd-EOB-DTPA uptake and the degree of liver fibrosis. T1-weighted volume- interpolated breath-hold examination (VIBE) sequences with fat suppression were acquired before and 20 minutes after contrast injection. Strong correlations of the uptake characteristics of Gd- EOB-DTPA with the relative enhancement (RE) of the liver parenchyma and the grade of fibrosis/
cirrhosis, classified using the Ishak scoring system, were observed. The subdivisions between the grades of liver fibrosis based on RE were highly significant for all combinations, and a ROC revealed sensitivities ≥82% and specificities ≥87% for all combinations. MR imaging is a satisfactorily sensitive method for the assessment of liver fibrosis/cirrhosis.
MR imaging of the liver using the liver-specific contrast agent Gd-EOB-DTPA has gained attention in recent years. Gd-EOB-DTPA is an ionic complex consisting of gadolinium (III) and the ligand ethoxybenzyl-diethylenetriaminepentaacetic acid (EOB-DTPA). These biochemical properties allow for the general assessment of tissue perfusion in vascular phases in addition to the specific accumula- tion in hepatocytes in the late phase (hepatobiliary phase, HBP) after 20 minutes1–4. The ethoxybenzyl group promotes the transport of Gd-EOB-DTPA into hepatocytes through the organ-anion transporters (OATPB1/B3) found in the sinusoids5–8. Gadolinium uptake shortens the spin-lattice relaxation time in the corresponding tissue, which leads to an increase in signal intensity (SI) on T1-weighted images1–3,9. Gd-EOB-DTPA is excreted through the ATP-dependent multidrug resistance protein 2 (MRP2), which is located in the canalicular membrane10,11. The excretion of Gd-EOB-DTPA into the biliary ducts is limited and causes a temporary enhancement within the liver cells12.
Due to the liver-specific accumulation of Gd-EOB-DTPA in the HBP, which leads to increased SI in the liver parenchyma, this molecule is particularly suitable for the detection and characterization of liver lesions13–15. However, based on various clinical and biochemical parameters, the uptake of Gd-EOB-DTPA depends on liver function16–22. The underlying liver pathology that causes the delayed uptake of Gd-EOB-DTPA has not been thoroughly examined. The aim of this study was to determine the correlation of the extent of Gd-EOB-DTPA with the degree of liver fibrosis (LF).
1Department of Radiology, University Hospital Regensburg, Regensburg, Germany. 2Department of Pathology, University Hospital Regensburg, Regensburg, Germany. 3Center for Clinical Trials, University Hospital Regensburg, Regensburg, Germany. 4Department of Surgery, University Hospital Regensburg, Regensburg, Germany.
5Department of Gastroenterology, University Hospital Regensburg, Regensburg, Germany. Correspondence and requests for materials should be addressed to N.V. (email: niklas.verloh@stud.uni-regensburg.de)
Received: 16 July 2015 accepted: 17 September 2015 Published: 19 October 2015
OPEN
Results
Patients. No significant differences in the patients’ ages, genders, body weights, heights or BMIs were identified between the patients with normal liver function and those with liver disease. Table 1 provides a summary of the patient characteristics.
Differences in MR imaging between the patients with and without liver fibrosis. The mean SI between the non-contrast phase (179.39 ± 32.82) and the Gd-EOB-DTPA-enhanced phase (307.80 ± 88.10) exhibited a significant increase in all patients (p ≤ 0.001). The average relative enhance- ment (RE) was 0.71 ± 0.33.
In the non-contrast sequences, the SI differed significantly (p = 0.018) between the patients with normal liver parenchyma (no liver fibrosis (NLF); 199.15 ± 39.09) and those in any stage of LF (175.24 ± 23.00).
Following the application of Gd-EOB-DTPA, this difference increased (p ≤ 0.001) (NLF, 421.10 ± 71.21 and LF, 284.02 ± 71.39). The RE was significantly different (p ≤ 0.001) between the patients with NLF (1.13 ± 0.18) and those with LF (0.62 ± 0.29).
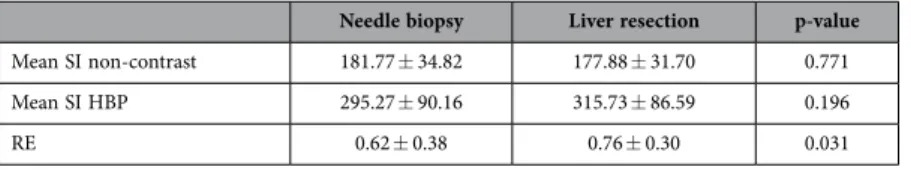
Comparison of different sample acquisition methods. A significant difference (p = 0.031) between the patients who underwent liver resection and those who underwent needle biopsy was observed in terms of RE. The patients who underwent needle biopsy exhibited a significantly lower RE (0.62 ± 0.38) than the patients who underwent liver resection (0.76 ± 0.30). No significant differences were observed regarding SI (Table 2).
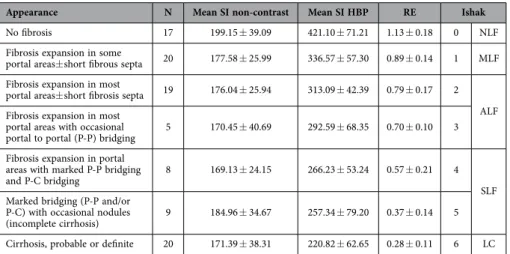
Comparison of the different stages of liver fibrosis. A comparison between the patients with NLF and those with LF as stratified according to the Ishak classification revealed that SI generally decreased in the cases of fibrosis (Tables 3–4, Fig. 1). Significant differences were observed in the RE between the patients without fibrosis (NLF, Ishak = 0; RE, 1.13 ± 0.18) and those with mild liver fibrosis (MLF, Ishak = 1; RE, 0.89 ± 0.14) (p ≤ 0.001) and between the patients with MLF and those with advanced liver fibrosis (ALF, Ishak 2 + 3; RE, 0.77 ± 0.16; p = 0.005). However, no significant differences were observed between the patients with Ishak 2 and 3 fibrotic scores (p = 0.255). The patients with severe liver fibrosis (SLF, Ishak 4 + 5) exhibited significantly (p ≤ 0.001) lower RE (0.46 ± 0.20) than the patients with ALF;
however, no significant differences (p = 0.054) were observed between the patients with Ishak scores of 4 and 5. Comparison of the patients with SLF and those with liver cirrhosis (LC, Ishak = 6) revealed a significant difference (p = 0.002) in RE. Figure 2 shows the boxplots and the corresponding significance values for the patients with NLF and those with different stages of LF.
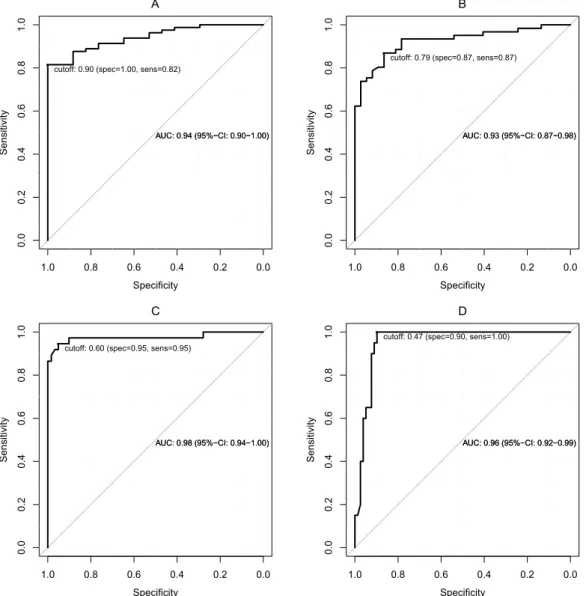
ROC analysis. We performed receiver operating characteristic (ROC) analysis to differentiate NLF from LF and the different stages of fibrosis based on the RE of the HBP.
Figure 3 shows the ROC curves according to four different fibrosis stage thresholds: MLF or greater (Ishak ≥ 1), ALF or greater (Ishak ≥ 2), SLF or greater (Ishak ≥ 4), and LC (Ishak = 6). The optimal
All (n = 98) NLF (n = 17) LF (n = 81) p-value Age (years) 57.49 ± 14.25 56.35 ± 16.85 57.73 ± 13.75 p = 0.888
Gender p = 0.66
Men, n (%) 65 (66) 8 (47) 57 (70)
Women, n (%) 33 (34) 9 (53) 24 (30)
Height (m) 1.72 ± 0.09 1.72 ± 0.10 1.72 ± 0.09 p = 0.829
Weight (kg) 80.59 ± 16.43 78.59 ± 18.18 81.01 ± 16.13 p = 0.567
BMI 27.03 ± 4.65 26.29 ± 4.99 27.19 ± 4.59 p = 0.302
Table 1. Patient characteristics. The values indicate the mean ± the standard deviation unless otherwise indicated. NLF, no liver fibrosis LF, liver fibrosis BMI, body mass index.
Needle biopsy Liver resection p-value
Mean SI non-contrast 181.77 ± 34.82 177.88 ± 31.70 0.771
Mean SI HBP 295.27 ± 90.16 315.73 ± 86.59 0.196
RE 0.62 ± 0.38 0.76 ± 0.30 0.031
Table 2. Signal intensities and relative enhancements of the liver parenchyma for patients undergoing needle biopsy or liver resection. The values indicate the mean ± the standard deviation. SI, signal intensity RE, relative enhancement HBP, hepatobiliary phase.
A
B
C
D
E
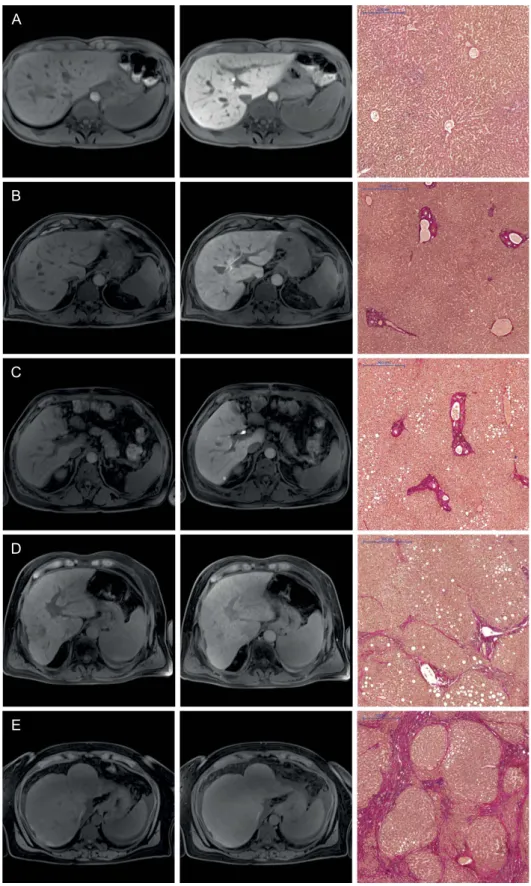
Figure 1. Images comparing the plain and hepatobiliary phases T1-weighted VIBE sequence with fat suppression for the non-contrast (1st column) and hepatobiliary phase (2nd column) of a patient with normal liver parenchyma (A) and for patients with different stages of liver fibrosis (B–E) with the corresponding histopathology images with the EVG staining (3rd column). All images displayed were taken with the same window and center level. The scale on the histopathology images represents 500 μ m. The relative enhancements of the liver parenchyma between the plain and Gd-EOB-DTPA-enhanced images were as follows: (A) no liver fibrosis (Ishak 0), RE: 1.01 (B) mild liver fibrosis (Ishak 1), RE: 0.84 (C) advanced liver fibrosis (Ishak 2), RE: 0.65 (D) severe liver fibrosis (Ishak 4), RE: 0.34 (E) liver cirrhosis (Ishak 6), RE: 0.16.
Figure 2. Relative enhancements during the hepatobiliary phase in patients with normal liver parenchyma and patients with liver fibrosis. Mann-Whitney U-tests were used to compare the following groups: RE, relative enhancement NLF, no liver fibrosis MLF, mild liver fibrosis ALF, advanced liver fibrosis SLF, severe liver fibrosis LC, liver cirrhosis.
Figure 3. ROC analysis Graphs illustrating the ROC curves for the relative enhancement measurements for the diagnoses of the patients in (A) (Ishak ≥ 1; cut-off, 0.90), (B) (Ishak ≥ 2; cut-off, 0.79), (C) (Ishak ≥ 4; cut-off, 0.60) and (D) (Ishak = 6; cut-off, 0.47).
cut-off values, the corresponding sensitivities and specificities values and the areas under the curves are presented in Table 5.
The optimal cut-off value for the RE to differentiate NLF from LF was 0.90 (area under the curve (AUC) 0.94). This cut-off value resulted in a sensitivity of 82% and a specificity of 100% for this differentiation.
Discussion
Hepatic fibrosis and cirrhosis are currently considered dynamic processes. Following adequate treatment of the underlying disease, LF can regress to a re-compensation phase23. Tests can detect the early signs of impaired liver function and lead to readjustments in patient treatment and subsequent slowing in the dynamic process of fibrosis. Obtaining a liver biopsy is the gold standard in the diagnosis and assessment of LF and LC in clinical practice. Liver biopsies are invasive procedures. They have poor patient compli- ance; are prone to sampling errors; are subject to inter-observer variability; and are associated with risks of complications, such as infection and bleeding24. The lack of characteristic fibrotic septa and nodular configurations can further complicate the histological diagnosis of LF or LC25. Furthermore, faulty sam- pling can underestimate the severity of the disease26,27.
In liver imaging, an upper abdominal ultrasonography should also be considered as a diagnostic tool for the assessment of liver function. Using elastography, liver stiffness can be measured, and indirect results regarding the degree of fibrosis can thus be obtained28,29. However, dynamic investigations are limited in their diagnostic capabilities due to their characteristics and false readings that result from incorrect measurements. Limited reproducibility and examiner dependence are also important limiting factors30.
In addition to ultrasound imaging, MR imaging of the liver with hepatocyte-specific MR contrast agents is currently an important method of investigation. Gd-EOB-DTPA is a hepatocyte-specific MR contrast agent that exhibits OATP1-mediated uptake and MRP2-mediated biliary excretion31. Because the hepatic uptake of Gd-EOB-DTPA is dependent on the integrity of the hepatocyte mass, quantifica- tion of the uptake via mean values of RE can be used to assess liver function16,19,21,32,33. The uptake of the contrast agent exhibits a significant correlation with the clinical degree of cirrhosis22,34.
Only a few studies have compared liver function as assessed by parenchyma enhancement fol- lowing Gd-EOB-DTPA administration with histopathologic data. Variable diagnostic performance of
All No fibrosis Fibrosis
Mean SI non-contrast 179.39 ± 32.82 199.15 ± 39.09 175.24 ± 23.00
Mean SI HBP 307.80 ± 88.10 421.10 ± 71.21 284.02 ± 71.39
RE 0.71 ± 0.33 1.13 ± 0.18 0.62 ± 0.29
Table 3. Signal intensities and relative enhancements of the liver parenchyma for the patients with and without fibrosis. The values indicate the mean ± the standard deviation. SI, signal intensity RE, relative enhancement HBP, hepatobiliary phase.
Appearance N Mean SI non-contrast Mean SI HBP RE Ishak
No fibrosis 17 199.15 ± 39.09 421.10 ± 71.21 1.13 ± 0.18 0 NLF
Fibrosis expansion in some
portal areas± short fibrous septa 20 177.58 ± 25.99 336.57 ± 57.30 0.89 ± 0.14 1 MLF Fibrosis expansion in most
portal areas± short fibrosis septa 19 176.04 ± 25.94 313.09 ± 42.39 0.79 ± 0.17 2 Fibrosis expansion in most ALF
portal areas with occasional
portal to portal (P-P) bridging 5 170.45 ± 40.69 292.59 ± 68.35 0.70 ± 0.10 3 Fibrosis expansion in portal
areas with marked P-P bridging
and P-C bridging 8 169.13 ± 24.15 266.23 ± 53.24 0.57 ± 0.21 4
Marked bridging (P-P and/or SLF P-C) with occasional nodules
(incomplete cirrhosis) 9 184.96 ± 34.67 257.34 ± 79.20 0.37 ± 0.14 5 Cirrhosis, probable or definite 20 171.39 ± 38.31 220.82 ± 62.65 0.28 ± 0.11 6 LC
Table 4. Signal intensities and relative enhancements of the liver parenchyma of the patients classified according to the degree of specific fibrosis/cirrhosis. The values indicate the mean ± the standard
deviation. SI, signal intensity RE, relative enhancement HBP, hepatobiliary phase NLF, no liver fibrosis MLF, mild liver fibrosis ALF, advanced liver fibrosis SLF, severe liver fibrosis LC, liver cirrhosis.
Gd-EOB-DTPA-enhanced MR imaging with AUCs ranging from 0.63 and 0.85 has been reported. These studies have used RE35, the liver-to-spleen ratio20 or dynamic measurements36 to quantify the parenchy- mal enhancement. Feier et al. reported a good correlation between the hepatic uptake of Gd-EOB-DTPA as expressed by RE and the METAVIR scoring system; however, these authors were unable to differentiate the patients with NLF from the patients with initial fibrosis in a pairwise comparison35. Feier et al. relied only on liver biopsies for the classification of LF. As mentioned above, liver biopsies may suffer from sampling errors and could have led to overlap between the groups.
Our results revealed a significant difference (p = 0.018) in the SIs of the patients with NLF and those with any stage of LF on the non-contrast T1-weighted images. This change in SI might have been caused by a change in liver architecture in the patients with LF. However, the evidence regarding surrounding this question has been contradictory. Ito et al. and Bataller et al. reported increases in the accumula- tions of iron, copper, manganese and collagen in cases of LC37,38. These paramagnetic macromolecules induce T1-shortening effects that would result in increased T1-weighted SIs on non-contrast images.
However, Lee et al. reported that the liver parenchyma is often edematous in cases of early stage fibrosis due to new vessels that have leaky interendothelial junctions and result in increased portions of pro- teins and red blood cells in the extravascular space39. This process results in the increased deposition of hepatic water content, hypercellularity and an increased ratio of free bound water in the liver paren- chyma. Consequently, this process results in a prolonged T1 relaxation time40,41 that leads to reduced SI on non-contrast T1-weighted images and vice versa. Accounting for these controversial findings, non-enhanced MRI is unlikely to be an appropriate method for the detection and staging of LF.
In accordance with previous findings, a significant association of the degree of fibrosis and the signal enhancement due to Gd-EOB-DTPA in the late phase after 20 min was detected in the present study population. A corresponding drop in SI was observed with an increase in fibrosis. However, the different Ishak stages could not be fully recapitulated.
Comparison of the patients with NLF and those with initial fibrotic remodeling (Ishak 1, MLF) revealed a significant (p ≤ 0.001) drop in RE. In accordance with the morphologic data that described an increase in fibrotic tissue that was more dominant at higher stages42, we observed that the decrease in RE was lower from mild (Ishak 1) to advanced (Ishak 2 + 3) LF compared with advanced to severe LF (Ishak 4 + 5).
The distinction between normal parenchyma and fibrotic remodeling is particularly useful for initial patient monitoring or screening because this difference could result in the initiation of therapy in the early stages of fibrosis, which would lead to early interventions and slowing of the progression. Under conditions of adequate therapy, the fibrotic remodeling process is reversible23.
Therapy monitoring using MR imaging offers the advantage of a non-invasive method for treating the progression of LF/LC. As a diagnostic modality, MR imaging eliminates the risks of liver biopsy (i.e., infec- tion, bleeding, and sampling errors) and can provide information regarding hepatic fibrosis and cirrhosis.
The limiting factor of this study is the fact that both the histological data from the liver biopsies and those of the samples of the liver resections were used. A significant difference between the two patient groups was observed in terms of RE. This difference might have occurred because the patients who underwent needle biopsies were more likely to be at an advanced stage of LF/LC (mean ISHAK 3.3) because the needle biopsies were performed as active patient monitoring in cases of known LC com- pared with the patients who underwent liver resection (mean ISHAK 2.5). Additionally, this difference in material quality might have led to variations in the histological diagnoses, particularly variations related to the differentiations of the fibrotic expansions between the patients with Ishak scores of 2 and 3 and the distinction between patients with ALF (Ishak 4) and patients with incomplete cirrhosis (Ishak 5).
However, only liver biopsies were used, and the punch-cylinders were always longer than 15 mm, and at least 10 cut portal fields were utilized; thus, tissue volumes sufficient for analysis were obtained.
Regarding the aim and original purpose of this study, the following assumption was confirmed: the uptake of Gd-EOB-DTPA depends on the severity of fibrosis and the degree of cirrhosis. We showed that the patients with hepatic impairments exhibited reduced signal amplifications in the HBP. Consequently, the uptake of Gd-EOB-DTPA was used to obtain information regarding liver function.
In conclusion, we strongly believe that in terms of risk-benefit analyses, MRI is a good and sensitive method for determining the degree of LF/LC.
Ishak ≥ 1 Ishak ≥ 2 Ishak ≥ 4 Ishak = 6
RE cut-off 0.90 0.79 0.60 0.47
Sensitivity (%) 82 87 95 100
Specificity (%) 100 87 95 90
AUC (95% CI) 0.94 (0.90, 1.00) 0.93 (0.87, 0.98) 0.98 (0.94, 1.00) 0.96 (0.92, 0.99)
Table 5. Optimal cut-off values and the corresponding sensitivity and specificity values for the differentiation of the different fibrosis stage thresholds. RE, relative enhancement.
Materials and Methods
Patients. Approval from the local institutional review board of the University Hospital Regensburg was obtained, and this retrospective study was performed in accordance with the relevant guidelines and regulations. Written informed consent for the use of the tissue samples and MR images for scientific research was obtained from study participant.
One hundred ninety-three consecutive patients were recruited from 02/2012 to 10/2014. Patients who had undergone Gd-EOB-DTPA-enhanced MR imaging of the liver and provided histopathological liver samples within three months of the examination were included in our study.
The adult patients had undergone Gd-EOB-DTPA-enhanced MR imaging and histopathological examinations of the liver due to the presence of suspected focal hepatic lesions or for the monitoring of active hepatocellular carcinomas in cases of known LC. None of the recruited patients had any contrain- dications for MRI examination (e.g., claustrophobia, incompatible metallic implants, and pacemakers), contraindications for the administration of Gd-EOB-DTPA (e.g., renal failure as defined by a glomerular filtration rate below 30 ml/min) or histories of previous reactions to liver-specific MRI contrast agents.
Seventy-four patients were excluded from this study due to insufficient liver samples (n = 56; tissue lengths shorter than 15 mm and/or less than ten visible portal tracts) or sampling errors (n = 18), and an additional 21 patients were excluded due to the inability to complete the full MR imaging protocol and the presence of severe imaging artifacts due to surgical clips or poor breath-holding techniques.
Ultimately, 98 patients (65 men and 33 women; mean age, 57.5 ± 14.3 years) were included in our study.
MR imaging. All imaging was performed using a clinical whole-body 3-T system (Magnetom Skyra, Siemens Healthcare) and combination body-spine array coil elements (18-channel body matrix coil and 32-channel spine matrix coil) for signal reception. Each of the T1-weighted volume-interpolated breath-hold examination (VIBE) sequences with fat suppression (repetition time (TR), 3.09 ms;
echo time (TE), 1.16 ms; flip angle, 9°; parallel imaging factor, 2; slices, 64; reconstructed voxel size, 1.3 × 1.3 × 3.0 mm; measured voxel size, 1.7 × 1.3 × 4.5 mm; acquisition time, 14 s) covered the entire liver, and the sequences were applied before (non-contrast) and 20 min after contrast injection (HBP).
Each sequence was acquired during one breath-hold, and no additional system adjustments were per- formed for the post-contrast sequence.
All patients received a Gd-EOB-DTPA (Primovist, Eovist; Bayer Schering Pharma AG, Berlin, Germany) dose that was adapted for their respective body weights (0.025 mmol/kg body weight). The hepatocytic contrast agent Gd-EOB-DTPA was administered via bolus injection with a flow rate of 1 ml/s and flushed with 20 ml NaCl.
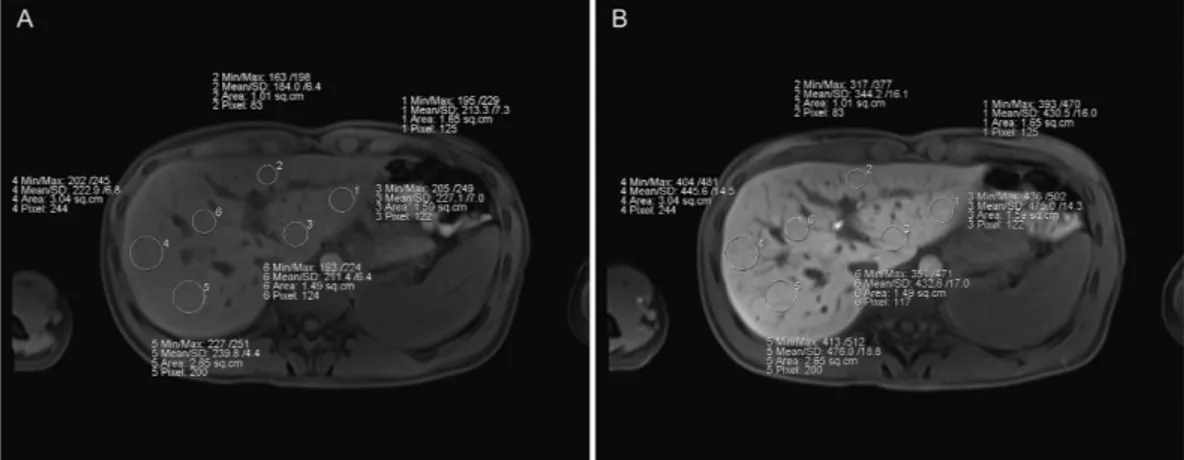
Image analysis. To determine the mean SI, three regions of interest (ROIs) were manually placed in each liver lobe (with identical sizes and locations for every sequence) and excluded visible vessels, liver lesions and imaging artifacts at the workstation of the MR scanner (Fig. 4). The ROIs were manually adjusted between sequences in cases of patient movement. The sizes of the ROIs ranged from 1.0 to 3.5 cm2, and the largest possible regions were chosen. The mean SI of these ROIs was taken as the rep- resentative SI for the entire liver.
The RE between the pre- and post-Gd-EOB-DTPA enhancements was calculated as follows:
Figure 4. ROI placement This figure displays the region of interest (ROI) placements in the non-contrasted images and during the hepatobiliary phase for a patient with no liver fibrosis.
( ) ( ) = − Relative enhanment RE of signal intensity SI SI SI ( )
SI 1
post pre
pre
SIpre is the mean SI of the liver parenchyma before (non-contrast), and SIpost is the mean SI of the liver parenchyma 20 minutes after Gd-EOB-DTPA administration (HBP). The RE was used to determine the Gd-EOB-DTPA uptake into the liver parenchyma and was then correlated with the histopathological findings.
Histopathological examination. In the present study, both liver biopsies (n = 38) and partial liver resections (n = 60) were included. The liver biopsies were collected as a part of active patient monitoring in cases of known LC (n = 21) or unknown liver tumors (n = 17). Patients underwent liver resection due to liver transplantation (n = 4) or as treatment method in cases of metastasis (n = 27) and liver cancer (HCC, n = 23; CCC, n = 6).
All samples were fixed in formalin and embedded in paraffin. Four-micrometer sections were cut ver- tically and mounted on glass slides. Thereafter, the sections were deparaffinized with xylene and ethanol and stained with hematoxylin-eosin (HE) and Elastica van Gieson (EVG) according to standard proto- cols. EVG staining was used to evaluate LF. Collagen stained red, and the hepatocytes stained yellow.
For the liver biopsies, an automatic needle device was used to obtain the liver samples. The length of each biopsy specimen was measured, and the numbers of portal spaces were assessed. The liver samples were included in the evaluations only when the tissue length exceeded 15 mm and more than ten portal tracts were visible. Only non-tumorous liver biopsies were included in this study. Two pathologists (M.E.
and K.U.) who specialize in liver histopathology reviewed the biopsies or resection specimens to evaluate the degrees of specific fibrosis/cirrhosis. Both readers were blinded to the imaging results and the patient data. The scoring was performed independently. In cases of disagreements in terms of a common final judgment, additional microscopic analyses were performed together. The fibroses were graded using the Ishak scoring system43. The patients were subdivided into the following 5 categories: NLF (Ishak 0; n = 17), MLF (Ishak 1; n = 20), ALF (Ishak 2 + 3; n = 24), SLF (Ishak 4 + 5; n = 17), and LC (Ishak 6; n = 20).
Statistical analysis. All statistical analyses were performed with IBM SPSS Statistics (version 23, Chicago, IL, USA) and R 3.2.1. The data are presented as the mean ± the standard deviation (SD). We used the non-parametric Mann-Whitney U-test for independent variables and the Wilcoxon signed-rank test for dependent variables for comparisons between the groups. ROC analyses were performed to dif- ferentiate between the patient groups, and the optimal cut-offs were estimated according to the Youden indices. The estimates of the AUCs that corresponded to the 95% confidence intervals and the true classification rates are reported. All tests were two-sided, and values of p < 0.05 indicated a significant difference.
References
1. Bluemke, D. A. et al. Efficacy and safety of MR imaging with liver-specific contrast agent: U.S. multicenter phase III study.
Radiology 237, 89–98, doi: 10.1148/radiol.2371031842 (2005).
2. Kobayashi, S. et al. Relationship between signal intensity on hepatobiliary phase of gadolinium ethoxybenzyl diethylenetriamine- pentaacetic acid (Gd-EOB-DTPA)-enhanced MR imaging and prognosis of borderline lesions of hepatocellular carcinoma.
European journal of radiology 81, 3002–3009, doi: 10.1016/j.ejrad.2012.03.029 (2012).
3. Weinmann, H. J. et al. A new lipophilic gadolinium chelate as a tissue-specific contrast medium for MRI. Magnetic resonance in medicine: official journal of the Society of Magnetic Resonance in Medicine/Society of Magnetic Resonance in Medicine 22, 233–237 (1991).
4. Van Beers, B. E., Pastor, C. M. & Hussain, H. K. Primovist, Eovist: what to expect? Journal of hepatology 57, 421–429, doi:
10.1016/j.jhep.2012.01.031 (2012).
5. Van Montfoort, J. E. et al. Hepatic uptake of the magnetic resonance imaging contrast agent gadoxetate by the organic anion transporting polypeptide Oatp1. The Journal of pharmacology and experimental therapeutics 290, 153–157 (1999).
6. Weinmann, H. J., Bauer, H., Frenzel, T., Muhler, A. & Ebert, W. Mechanism of hepatic uptake of gadoxetate disodium. Academic radiology 3, Suppl 2, S232–234 (1996).
7. Pascolo, L. et al. Molecular mechanisms for the hepatic uptake of magnetic resonance imaging contrast agents. Biochem Biophys Res Commun 257, 746–752, doi: 10.1006/bbrc.1999.0454 (1999).
8. Nassif, A. et al. Visualization of hepatic uptake transporter function in healthy subjects by using gadoxetic acid-enhanced MR imaging. Radiology 264, 741–750, doi: 10.1148/radiol.12112061 (2012).
9. Clement, O., Muhler, A., Vexler, V., Berthezene, Y. & Brasch, R. C. Gadolinium-ethoxybenzyl-DTPA, a new liver-specific magnetic resonance contrast agent. Kinetic and enhancement patterns in normal and cholestatic rats. Invest Radiol 27, 612–619 (1992).
10. Tsuda, N. & Matsui, O. Cirrhotic rat liver: reference to transporter activity and morphologic changes in bile canaliculi—gadoxetic acid-enhanced MR imaging. Radiology 256, 767–773, doi: 10.1148/radiol.10092065 (2010).
11. Tsuboyama, T. et al. Hepatocellular carcinoma: hepatocyte-selective enhancement at gadoxetic acid-enhanced MR imaging—
correlation with expression of sinusoidal and canalicular transporters and bile accumulation. Radiology 255, 824–833, doi:
10.1148/radiol.10091557 (2010).
12. Schuhmann-Giampieri, G., Schmitt-Willich, H., Frenzel, T. & Schitt-Willich, H. Biliary excretion and pharmacokinetics of a gadolinium chelate used as a liver-specific contrast agent for magnetic resonance imaging in the rat. Journal of pharmaceutical sciences 82, 799–803 (1993).
13. Haimerl, M. et al. Added value of Gd-EOB-DTPA-enhanced Hepatobiliary phase MR imaging in evaluation of focal solid hepatic lesions. BMC medical imaging 13, 41, doi: 10.1186/1471-2342-13-41 (2013).
14. Bieze, M. et al. Diagnostic accuracy of MRI in differentiating hepatocellular adenoma from focal nodular hyperplasia: prospective study of the additional value of gadoxetate disodium. AJR. American journal of roentgenology 199, 26–34, doi: 10.2214/ajr.11.7750 (2012).
15. Sun, H. Y. et al. Gadoxetic acid-enhanced magnetic resonance imaging for differentiating small hepatocellular carcinomas (< or = 2 cm in diameter) from arterial enhancing pseudolesions: special emphasis on hepatobiliary phase imaging. Invest Radiol 45, 96–103, doi: 10.1097/RLI.0b013e3181c5faf7 (2010).
16. Tamada, T. et al. Gd-EOB-DTPA-enhanced MR imaging: evaluation of hepatic enhancement effects in normal and cirrhotic livers. European journal of radiology 80, e311–316, doi: 10.1016/j.ejrad.2011.01.020 (2011).
17. Fischer, M. A. et al. Feasibility of semiquantitative liver perfusion assessment by ferucarbotran bolus injection in double-contrast hepatic MRI. Journal of magnetic resonance imaging: JMRI 36, 168–176, doi: 10.1002/jmri.23611 (2012).
18. Hagiwara, M. et al. Advanced liver fibrosis: diagnosis with 3D whole-liver perfusion MR imaging—initial experience. Radiology 246, 926–934, doi: 10.1148/radiol.2463070077 (2008).
19. Tajima, T. et al. Relationship between liver function and liver signal intensity in hepatobiliary phase of gadolinium ethoxybenzyl diethylenetriamine pentaacetic acid-enhanced magnetic resonance imaging. Journal of computer assisted tomography 34, 362–366, doi: 10.1097/RCT.0b013e3181cd3304 (2010).
20. Nishie, A. et al. MR prediction of liver fibrosis using a liver-specific contrast agent: Superparamagnetic iron oxide versus Gd- EOB-DTPA. Journal of magnetic resonance imaging: JMRI 36, 664–671, doi: 10.1002/jmri.23691 (2012).
21. Verloh, N. et al. Assessing liver function by liver enhancement during the hepatobiliary phase with Gd-EOB-DTPA-enhanced MRI at 3 Tesla. European radiology, doi: 10.1007/s00330-014-3108-y (2014).
22. Verloh, N. et al. Impact of liver cirrhosis on liver enhancement at Gd-EOB-DTPA enhanced MRI at 3Tesla. European journal of radiology 82, 1710–1715, doi: 10.1016/j.ejrad.2013.05.033 (2013).
23. Marcellin, P. et al. Regression of cirrhosis during treatment with tenofovir disoproxil fumarate for chronic hepatitis B: a 5-year open-label follow-up study. Lancet 381, 468–475, doi: 10.1016/s0140-6736(12)61425-1 (2013).
24. Regev, A. et al. Sampling error and intraobserver variation in liver biopsy in patients with chronic HCV infection. The American journal of gastroenterology 97, 2614–2618, doi: 10.1111/j.1572-0241.2002.06038.x (2002).
25. Germani, G., Hytiroglou, P., Fotiadu, A., Burroughs, A. K. & Dhillon, A. P. Assessment of Fibrosis and Cirrhosis in Liver Biopsies:
An Update. Semin Liver Dis 31, 082–090, doi: 10.1055/s-0031-1272836 (2011).
26. Maharaj, B. et al. Sampling variability and its influence on the diagnostic yield of percutaneous needle biopsy of the liver. Lancet 1, 523–525 (1986).
27. Bravo, A. A., Sheth, S. G. & Chopra, S. Liver biopsy. The New England journal of medicine 344, 495–500, doi: 10.1056/
nejm200102153440706 (2001).
28. Cassinotto, C. et al. Liver Fibrosis: Noninvasive Assessment with Acoustic Radiation Force Impulse Elastography—Comparison with FibroScan M and XL Probes and FibroTest in Patients with Chronic Liver Disease. Radiology, doi: 10.1148/radiol.13122208 (2013).
29. Friedrich-Rust, M. et al. Performance of Acoustic Radiation Force Impulse imaging for the staging of liver fibrosis: a pooled meta-analysis. Journal of viral hepatitis 19, e212–219, doi: 10.1111/j.1365-2893.2011.01537.x (2012).
30. Bota, S. et al. Intra- and interoperator reproducibility of acoustic radiation force impulse (ARFI) elastography—preliminary results. Ultrasound in medicine & biology 38, 1103–1108, doi: 10.1016/j.ultrasmedbio.2012.02.032 (2012).
31. Leonhardt, M. et al. Hepatic uptake of the magnetic resonance imaging contrast agent Gd-EOB-DTPA: role of human organic anion transporters. Drug metabolism and disposition: the biological fate of chemicals 38, 1024–1028, doi: 10.1124/dmd.110.032862 (2010).
32. Motosugi, U. et al. Liver parenchymal enhancement of hepatocyte-phase images in Gd-EOB-DTPA-enhanced MR imaging:
which biological markers of the liver function affect the enhancement? Journal of magnetic resonance imaging: JMRI 30, 1042–1046, doi: 10.1002/jmri.21956 (2009).
33. Ryeom, H. K. et al. Quantitative evaluation of liver function with MRI Using Gd-EOB-DTPA. Korean journal of radiology: official journal of the Korean Radiological Society 5, 231–239 (2004).
34. Haimerl, M. et al. Assessment of Clinical Signs of Liver Cirrhosis Using T1 Mapping on Gd-EOB-DTPA-Enhanced 3T MRI. PloS one 8, e85658, doi: 10.1371/journal.pone.0085658 (2013).
35. Feier, D. et al. Liver fibrosis: histopathologic and biochemical influences on diagnostic efficacy of hepatobiliary contrast-enhanced MR imaging in staging. Radiology 269, 460–468, doi: 10.1148/radiol.13122482 (2013).
36. Chen, B. B. et al. Dynamic contrast-enhanced magnetic resonance imaging with Gd-EOB-DTPA for the evaluation of liver fibrosis in chronic hepatitis patients. European radiology 22, 171–180, doi: 10.1007/s00330-011-2249-5 (2012).
37. Ito, K. et al. Hepatocellular carcinoma: association with increased iron deposition in the cirrhotic liver at MR imaging. Radiology 212, 235–240, doi: 10.1148/radiology.212.1.r99jl41235 (1999).
38. Bataller, R. & Brenner, D. A. Liver fibrosis. The Journal of clinical investigation 115, 209–218, doi: 10.1172/jci24282 (2005).
39. Lee, J. K. & Glazer, H. S. Controversy in the MR imaging appearance of fibrosis. Radiology 177, 21–22, doi: 10.1148/
radiology.177.1.2399319 (1990).
40. Wynn, T. A. Cellular and molecular mechanisms of fibrosis. The Journal of pathology 214, 199–210, doi: 10.1002/path.2277 (2008).
41. Chamuleau, R. A. et al. Is the magnetic resonance imaging proton spin-lattice relaxation time a reliable noninvasive parameter of developing liver fibrosis? Hepatology 8, 217–221 (1988).
42. Bedossa, P. & Poynard, T. An algorithm for the grading of activity in chronic hepatitis C. The METAVIR Cooperative Study Group. Hepatology 24, 289–293, doi: 10.1002/hep.510240201 (1996).
43. Ishak, K. et al. Histological grading and staging of chronic hepatitis. Journal of hepatology 22, 696–699 (1995).
Author Contributions
N.V. performed the literature search, collected and interpreted the data and drafted the manuscript.
K.U. and M.E. participated in the study design, collected the data and edited the manuscript. M.H. and C.F. helped with the data acquisition, literature search and interpretation of the data. F.Z. performed the statistical analysis and interpreted the data. S.F. and A.T. critically revised the manuscript for important intellectual content and made substantial contributions to the data analysis. C.S. and P.W. participated in the study design and coordination and helped draft the manuscript. All authors have read and approved the final manuscript.
Additional Information
Competing financial interests: The authors declare no competing financial interests.
How to cite this article: Verloh, N. et al. Liver fibrosis and Gd-EOB-DTPA-enhanced MRI: A histopathologic correlation. Sci. Rep. 5, 15408; doi: 10.1038/srep15408 (2015).
This work is licensed under a Creative Commons Attribution-NonCommercial-NoDerivs 4.0 International License. The images or other third party material in this article are included in the article’s Creative Commons license, unless indicated otherwise in the credit line; if the material is not included under the Creative Commons license, users will need to obtain permission from the license holder to reproduce the material. To view a copy of this license, visit http://creativecommons.org/
licenses/by-nc-nd/4.0/