www.nature.com/scientificreports
Detecting liver fibrosis with
Gd-EOB-DTPA-enhanced MRI: A confirmatory study
Niklas Verloh
1, Kirsten Utpatel
2, Michael Haimerl
1, Florian Zeman
3, Lukas Beyer
1,
Claudia Fellner
1, Frank Brennfleck
4, Marc H Dahlke
4, Christian Stroszczynski
1, Matthias Evert
2&
Philipp Wiggermann
1Strong correlations between the grade of fibrosis and cirrhosis, classified using the Ishak scoring system, and the uptake characteristics of Gd-EOB-DTPA with the relative enhancement (RE) of the liver parenchyma have been reported. To confirm the results of a retrospective analysis, patients undergoing liver surgery were prospectively examined with Gd-EOB-DTPA-enhanced liver 3 Tesla MRI to determine the degree of liver fibrosis. Correlations between the grade of fibrosis and cirrhosis, classified using the Ishak scoring system, and RE were investigated and compared with those derived from an initial retrospective study. After validating the cut-off values in the retrospective study (Ishak ≥ 1, RE-cut-off 0.90; Ishak ≥ 2, RE-cut-off 0.79; Ishak ≥ 4, RE-cut-off 0.60; and Ishak = 6, RE-cut-off 0.47), we showed that Gd-EOB-DTPA has a high sensitivity (≥86%) and a high positive predictive value (≥86%). These results support the use of Gd-EOB-DTPA-enhanced liver MRI as a non-invasive method for determining the degree of liver fibrosis and cirrhosis.
Chronic liver disease and cirrhosis are leading causes of mortality in the Western hemisphere. The epidemic increase in obesity, nonalcoholic fatty liver disease and alcohol-induced liver cirrhosis contribute to this growing problem, as morbidity and mortality are directly correlated with the progression of hepatic fibrosis
1–5.
Information regarding the grade of liver fibrosis and cirrhosis is essential for determining the prognosis and clinical management of patients with a chronic liver disease or patients who undergo liver surgery
6,7.
Liver fibrosis and cirrhosis are currently considered to be dynamic processes that can be corrected with ade- quate treatment
8. In clinical practice, obtaining a liver biopsy is the gold standard for monitoring the state of liver fibrosis and observing treatment response.
However, liver biopsies are an invasive procedure known to have poor patient compliance. Biopsies are also prone to both misinterpretation in cases of missing fibrotic septa or nodular configurations and to inter-observer variability
9,10. The quality of the grading is directly correlated with the sampling size. Furthermore, liver fibrosis may cause heterogeneity of the liver tissue; therefore, sampling results or faulty sampling in liver biopsy may not be representative of the whole organ
10–12. An image-based technique would be helpful, as it would allow not only a small section of the liver but also the entire organ to be examined.
Upper abdominal ultrasonography is a common tool for analysing liver stiffness with elastography
13. However, ultrasound examinations are examiner-dependent and limited by a restricted field of view, and they are therefore not usually able to assess the entire liver.
Non-invasive assessment of liver fibrosis is an important area of study. Multiple techniques have been pro- posed, such as elastography. Specifically, area under the curve (AUC) analyses of MR elastography showed a diagnostic accuracy of 90.9–99.4%. The corresponding values for US-based vibration-controlled transient elas- tography have been reported to be 83.7–91.4%
14–16. One disadvantage of these examinations is that liver stiffness is only an indirect sign of liver fibrosis; concomitant diseases, such as heart failure, also affect liver stiffness. Thus, elastography techniques are prone to mismeasurements. In addition to those limitations, some of the above- mentioned examinations require additional equipment, limiting the applicability and the routine use of these techniques in clinical practice.
1Department of Radiology, University Hospital Regensburg, Regensburg, Germany. 2Department of Pathology, University Regensburg, Regensburg, Germany. 3Centre for Clinical Trials, University Hospital Regensburg, Regensburg, Germany. 4Department of Surgery, University Hospital Regensburg, Regensburg, Germany.
Correspondence and requests for materials should be addressed to N.V. (email: niklas.verloh@ukr.de) Received: 8 August 2017
Accepted: 26 March 2018 Published: xx xx xxxx
OPEN
www.nature.com/scientificreports/
MRI examinations with hepatocyte-specific MR contrast agents are used in routine clinical practice for hepatic lesion detection and differentiation. In addition to the general assessment of tissue perfusion in the vas- cular phases, these contrast agents allow an assessment of the liver parenchyma during an additional late phase (hepatobiliary phase, HBP) due to their specific accumulation in hepatocytes. As the hepatic accumulation is dependent on the integrity of the hepatocytes, quantification of the uptake with mean values of relative enhance- ment (RE) can be used to analyse the liver parenchyma
17–23.
Studies have shown that RE, representing the hepatic uptake of Gd-EOB-DTPA, is strongly affected by the degree of liver cirrhosis, represented by clinical scoring systems such as the Child Pugh Score
17,24. The enhance- ment patterns of the liver parenchyma in Gd-EOB-DTPA-enhanced MRI even correlate with the graft survival probability in liver transplant recipients
25.
Recently published studies have shown a wide range in diagnostic accuracy regarding the ability of analysing the underling histopathological data of the liver parenchyma in retrospective studies with different parenchymal enhancement measurements
26–29. These studies agree that the uptake of Gd-EOB-DTPA and, thus, the relative enhancement of HBP compared with baseline may be delayed in the case of liver fibrosis
27,28. In contrast, these results can be used to determine the degree of liver fibrosis and cirrhosis. Feier et al. reported an association between RE, representing the hepatic uptake of Gd-EOB-DTPA, and the METAVIR scoring system for differen- tiating normal liver parenchyma and higher stages of liver fibrosis
26.
Recently, we published a retrospective study correlating liver fibrosis with histopathological findings, ana- lysed using the Ishak scoring system. In this study, we were able to show that a strong correlation exists between the uptake of Gd-EOB-DTPA and fibrosis severity. With a diagnostic accuracy of 93–98%, we showed that liver fibrosis can be demonstrated by the RE
29.
The aim of this study was to validate the retrospective finding by a confirmatory study in patients undergoing liver resection and transplantation.
Results
Comparison of the different stages of liver fibrosis. A comparison of the patients with no liver fibrosis (NLF) and those with liver fibrosis (LF) stratified according to the Ishak classification revealed that RE decreased together with the extent of liver fibrosis.
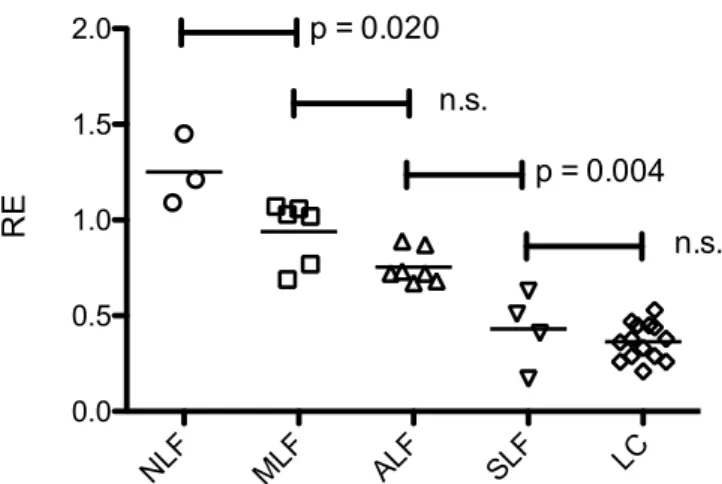
In adjusted pairwise comparisons (Fig. 1, Table 1), significant differences were observed between patients without fibrosis (NLF, Ishak
=0; RE, 1.25
±0.18) and mild liver fibrosis (MLF, Ishak
=1; RE, 0.94
±0.17) (p
=0.020), as well as between patients with ALF and severe liver fibrosis (SLF, Ishak 4
+5; RE, 0.43
±0.20) (p
=0.004). However, no significant differences were observed between patients with MLF and advanced liver Figure 1. Scatter plot of the different stages of liver fibrosis. The relative enhancement (RE) according to the Ishak scores with the corresponding p values. NLF, no liver fibrosis; MLF, mild liver fibrosis; ALF, advanced liver fibrosis; SLF, severe liver fibrosis; LC, liver cirrhosis.
NLF MLF ALF SLF LC
NLF 0.020 ≤0.001 ≤0.001 ≤0.001
MLF 0.020 0.150 ≤0.001 ≤0.001
ALF ≤0.001 0.150 0.004 ≤0.001 SLF ≤0.001 ≤0.001 0.004 1.000 LC ≤0.001 ≤0.001 ≤0.001 1.000
Table 1. Differentiation between the stages of liver fibrosis. Comparison of the different stages of liver fibrosis with the corresponding p values. NLF, no liver fibrosis; MLF, mild liver fibrosis; ALF, advanced liver fibrosis;
SLF, severe liver fibrosis; LC, liver cirrhosis.
www.nature.com/scientificreports/
fibrosis (ALF, Ishak 2 + 3; RE, 0.75
± 0.08) (p = 0.150) and between patients with SLF and liver cirrhosis (LC,Ishak = 6 RE, 0.36 ± 0.10) (p = 1.000).
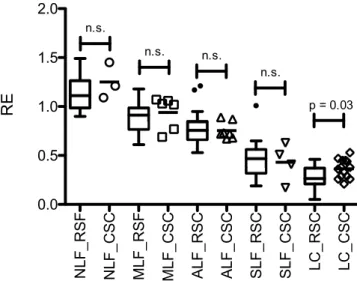
Comparison of the confirmatory study and the initial retrospective findings. In a comparison with the initial results, we found no significant difference between patients with NLF, MLF, ALF and SLF (Fig. 2).
Only patients with LC showed a higher RE in the current analysis than in the previously published findings.
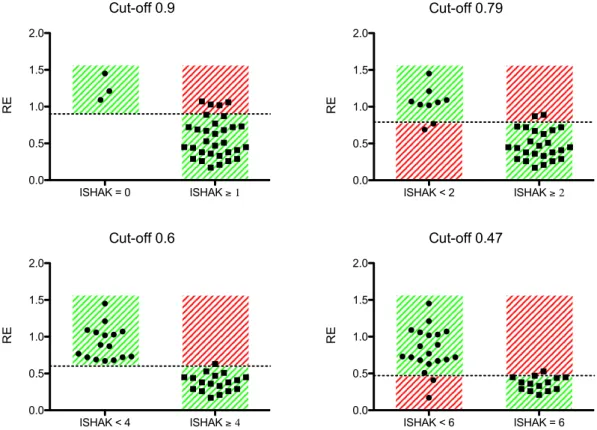
Validating the cut-off values. We initially described four cut-off values for analysing liver fibrosis: MLF or greater (Ishak ≥ 1, RE-cut-off 0.90), ALF or greater (Ishak ≥ 2, RE-cut-off 0.79), SLF or greater (Ishak ≥ 4, RE-cut-off 0.60), and LC (Ishak = 6, RE-cut-off 0.47).
The cut-off values were applied to the prospective data. Table 2 shows the resulting sensitivities and spe- cificities and the corresponding positive and negative predictive values. The sensitivity for detection of initial stage of liver fibrosis compared to no liver fibrosis (Ishak ≥ 1) was 0.87; the corresponding specificity was 1.00.
Differentiation of full liver cirrhosis (Ishak = 6) compared to other stages of liver fibrosis was 0.86, with a speci- ficity of 0.90. Figure 3 is a graphical representation of the data.
Discussion
The non-invasive assessment of liver cirrhosis is of high clinical relevance. In this prospective trial, the use of Gd-EOB-DTBA-enhanced MRI to assess the degree of liver fibrosis, expressed as the histological Ishak score, was examined to validate the findings of our initial retrospective study.
Patients showed a continuous decrease in RE with increasing Ishak score and significant differences between NLF and ALF in a paired comparison.
Excluding patients with liver cirrhosis, we were unable to find a significant difference between the prospective and retrospective patient groups. Patients with liver cirrhosis showed a significantly higher RE than the initial retrospective group. This finding may be due to the similarity of the histopathological findings in patients with SLF and LC. Chen et al. recently showed the divergence in inter-observer agreement (ICC 0.89) between two histopathological interpretations, with a difference of a least one fibrosis stage in 30% of the cases
30.
Figure 2. Comparison of the retrospective and prospective findings. Boxplots of the initial retrospective (RSF) study compared with the results of the prospective, confirmatory study cohort (CSC). The relative enhancement (RE) for every patient in the CSC is shown together with the corresponding statistical significance of differences between the two study groups for the different stages of liver fibrosis. NLF, no liver fibrosis; MLF, mild liver fibrosis; ALF, advanced liver fibrosis; SLF, severe liver fibrosis; LC, liver cirrhosis.
Sensitivity Specificity Positive
predictive value Negative predictive value
Ishak ≥ 1 0.87 1.00 1.00 0.42
Ishak ≥ 2 0.92 0.78 0.92 0.78
Ishak ≥ 4 0.94 1.00 1.00 0.94
Ishak = 6 0.86 0.90 0.86 0.90
Table 2. Validating the cut-off values. The sensitivity and specificity and the corresponding positive and
negative predictive values are shown for the different cut-off values. MLF or greater (Ishak
≥1, RE-cut-off 0.90),
ALF or greater (Ishak
≥2, RE-cut-off 0.79), SLF or greater (Ishak
≥4, RE-cut-off 0.60), and LC (Ishak
=6, RE-
cut-off 0.47).
www.nature.com/scientificreports/
Validating the cut-off values of the retrospective study showed that Gd-EOB-DTPA has a high sensitivity (
≥86%) with a high positive predictive value (
≥86%) for any stage of liver fibrosis.
For the initial liver fibrosis, contrast-enhanced-MRI with a cut-off of RE
=0.9 showed a high positive pre- dictive value of 100%; however, the negative predictive value was poor at only 42% (sensitivity 87%, specificity 100%), which may be accounted for by the small number of patients with no liver fibrosis included in the study.
The data demonstrate that contrast-enhanced MRI, with a cut-off value of RE
=0.6, is very suitable for staging a high degree of liver fibrosis (Ishak
≥4), with a positive predictive value of 100% and a negative predictive value of
≥
94% (sensitivity 94%, specificity 100%).
The limiting factors of our study are the single centre design, a small number of patients and especially the limited number of patients in each non-cirrhotic class. Nevertheless, we were able to show that MRI potentially is a sensitive, non-invasive, method for determining the degree of liver fibrosis. Furthermore, as an image-based modal- ity evaluating the entire liver, MRI offers the advantage of reducing the risk of misinterpretation or sampling errors.
Further multicentre studies are needed to confirm the results of this single-centre study. The addition of new MRI methods, like texture analysis, might further enhance the presented results.
Methods
We followed the study design of Verloh et al.
29.
Patients. Approval from the local institutional review board of the University Hospital Regensburg was obtained for this prospective study. This study was registered retrospectively with the German Clinical Trails Register (DRKS00012564, Date of Registration: July 18, 2017) and performed in accordance with the relevant guidelines and regulations. Written informed consent was obtained from the study participants.
Overall, 50 adult patients were included in this study between August 2016 and April 2017. Ten patients were excluded from this study due to changes in therapy, e.g., no liver resection or atypical liver resection with an insuf- ficient liver sample. Additionally, 6 patients were excluded due to the inability to complete the full MRI protocol and the presence of severe imaging artefacts due to surgical clips or poor breath-holding techniques. Finally, 34 patients (23 men and 11 women; mean age, 60
±11 years) were included in our analysis (Fig. 4).
All patients underwent Gd-EOB-DTPA-enhanced MRI of the liver before liver resection and transplantation.
The patients underwent liver surgery for liver transplantation or for resection in cases of metastasis or liver cancer.
None of the recruited patients had any contraindications for MRI examination (e.g., claustrophobia, incompatible metallic implants, and pacemakers), contraindications for the administration of Gd-EOB-DTPA (e.g., renal failure as defined by a glomerular filtration rate
<30 ml/min) or a previous reaction to liver-specific MRI contrast agents.
Figure 3. Cut-off values. The cut-off values of the retrospective study were applied to the prospective study
cohort. The graphs show the findings for the prospective study cohort. The dashed line indicates the cut-off
value of the relative enhancement (RE). The green area shows the correctly assigned patients, and the red area
shows the negatively assigned patients.
www.nature.com/scientificreports/
MRI. All imaging was performed using a clinical whole-body 3-T system (Magnetom Skyra, Siemens Healthcare) and combination body-spine array coil elements (18-channel body matrix coil and 32-channel spine matrix coil) for signal reception. Each of the T1-weighted volume-interpolated breath-hold examination (VIBE) sequences with fat suppression (repetition time (TR), 3.09 ms; echo time (TE), 1.16 ms; flip angle, 9°; parallel imaging factor, 2; slices, 64; reconstructed voxel size, 1.3 × 1.3 × 3.0 mm; measured voxel size, 1.7 × 1.3 × 4.5 mm;
acquisition time, 14 s) covered the entire liver, and the sequences were applied before (non-contrast) and 20 min after contrast injection (HBP). Each sequence was acquired during one breath hold, and no additional system adjustments were performed for the post-contrast sequence.
All patients received a body weight-adapted dose (0.025 mmol/kg body weight) of Gd-EOB-DTPA (Primovist, Eovist; Bayer Schering Pharma AG, Berlin, Germany). The hepatocyte contrast agent Gd-EOB-DTPA was admin- istered via a bolus injection at a flow rate of 1 ml/s and flushed with 20 ml of NaCl solution.
Image analysis. Three regions of interest (ROIs) were manually selected in each liver lobe (with identical sizes and locations in the non-contrast and post-contrast T1 HBP) by an experienced physician (5 years of expe- rience in hepatobiliary imaging). ROIs were manually adjusted to adapt to different respiratory levels or patient movement. Visible vessels, imaging artefacts and liver lesions were excluded. The sizes of the ROIs ranged from 1.0 to 2.5 cm
2.
The mean SI was calculated and used as the representative SI for the entire liver. The RE between non-contrasted (SI
pre) and post-Gd-EOB-DTPA (SI
post) was calculated as follows:
= −
of signal intensity SI SI SI
Relative enhancement (RE) ( )
SI(1)
post pre
pre
The RE was used to determine the uptake of Gd-EOB-DTPA into the liver parenchyma and was correlated with the histopathological findings. The image was analysed blindly without knowledge of the histopathological examination.
Histopathological examination. In the present study, only liver samples from liver resection (n
=30) or transplantation (n
=4) were included to avoid the limitation of an insufficient tissue sample, making the Ishak classification more reliable. Four-micrometre-thick sections were cut vertically and mounted on glass slides.
Thereafter, the sections were deparaffinised with xylene and ethanol and stained with haematoxylin-eosin (HE) and Elastica van Gieson (EVG) according to standard protocols. EVG staining was used to evaluate LF. Collagen stained red, and the hepatocytes stained yellow.
Two pathologists (M.E. and K.U.) who specialize in liver histopathology reviewed the resection specimens to evaluate the degree of specific fibrosis and cirrhosis. Both examiners were blinded to the imaging results and the Figure 4. Flowchart of the inclusion and exclusion of study patients. The patients were included or excluded and allocated to different categories according to the Ishak score. NLF, no liver fibrosis; MLF, mild liver fibrosis;
ALF, advanced liver fibrosis; SLF, severe liver fibrosis; LC, liver cirrhosis.
www.nature.com/scientificreports/
patient data. The scoring was performed independently. In cases of disagreement, additional microscopic analy- ses were performed in consensus. The fibroses were classified using the Ishak scoring system
31. The patients were subdivided into the following 5 categories: NLF (Ishak 0; n = 3), MLF (Ishak 1; n = 6), ALF (Ishak 2 + 3; n = 7), SLF (Ishak 4 + 5; n = 4), and LC (Ishak 6; n
= 14).Statistical analysis. All statistical analyses were performed with IBM SPSS Statistics (version 24, Chicago, IL, USA) and R 3.2.1
32. The data are presented as the mean ± standard deviation (SD). We used the non-parametric Mann-Whitney U-test for independent variables for comparisons between the groups. To com- pare the relative enhancement between the Ishak stages, an analysis of variance (ANOVA) followed by Bonferroni adjusted pairwise comparisons was performed. REs at identical Ishak stages were compared in the retrospective and prospective studies with the non-parametric Mann-Whitney U-test.
Finally, the sensitivity, specificity, and positive and negative predictive values for classifying the Ishak score were calculated using the previously described four cut-off values for liver fibrosis analysis: MLF or greater (Ishak ≥ 1, RE-cut-off 0.90), ALF or greater (Ishak ≥ 2, RE-cut-off 0.79), SLF or greater (Ishak ≥ 4, RE-cut-off 0.60), and LC (Ishak = 6, RE-cut-off 0.47)
29. These cut-off values were estimated according to the Youden indices in the initial retrospective data set based on ROC analyses of the patient groups.
All tests were two-sided, and p values < 0.05 indicated a statistically significant difference.
Data availability. The data that support the findings of this study are available from the corresponding author upon reasonable request.
References
1. Agency for Healthcare Research and Quality. Healthcare Cost and Utilization Project online database, www.hcup-us.ahrq.gov/
home.jsp. (June 2017).
2. Carucci, L. R. Imaging obese patients: problems and solutions. Abdom Imaging 38, 630–646, https://doi.org/10.1007/s00261-012- 9959-2 (2013).
3. Charlton, M. Nonalcoholic fatty liver disease: a review of current understanding and future impact. Clin Gastroenterol Hepatol 2, 1048–1058 (2004).
4. Gurnani, M., Birken, C. & Hamilton, J. Childhood Obesity: Causes, Consequences, and Management. Pediatr Clin North Am 62, 821–840, https://doi.org/10.1016/j.pcl.2015.04.001 (2015).
5. Statistisches-Bundesamt. Diagnosedaten der Krankenhäuser ab 2000, http://www.gbe-bund.de (June 2017).
6. Ribero, D. et al. Measured versus estimated total liver volume to preoperatively assess the adequacy of the future liver remnant:
which method should we use? Annals of surgery 258, 801–806; discussion 806–807, https://doi.org/10.1097/sla.0000000000000213 (2013).
7. Yigitler, C. et al. The small remnant liver after major liver resection: how common and how relevant? Liver transplantation: official publication of the American Association for the Study of Liver Diseases and the International Liver Transplantation. Society 9, S18–25, https://doi.org/10.1053/jlts.2003.50194 (2003).
8. Marcellin, P. et al. Regression of cirrhosis during treatment with tenofovir disoproxil fumarate for chronic hepatitis B: a 5-year open- label follow-up study. Lancet 381, 468–475, https://doi.org/10.1016/S0140-6736(12)61425-1 (2013).
9. Germani, G., Hytiroglou, P., Fotiadu, A., Burroughs, A. K. & Dhillon, A. P. Assessment of fibrosis and cirrhosis in liver biopsies: an update. Semin Liver Dis 31, 82–90, https://doi.org/10.1055/s-0031-1272836 (2011).
10. Regev, A. et al. Sampling error and intraobserver variation in liver biopsy in patients with chronic HCV infection. The American journal of gastroenterology 97, 2614–2618, https://doi.org/10.1111/j.1572-0241.2002.06038.x (2002).
11. Bravo, A. A., Sheth, S. G. & Chopra, S. Liver biopsy. The New England journal of medicine 344, 495–500, https://doi.org/10.1056/
nejm200102153440706 (2001).
12. Maharaj, B. et al. Sampling variability and its influence on the diagnostic yield of percutaneous needle biopsy of the liver. Lancet 1, 523–525 (1986).
13. Cassinotto, C. et al. Liver fibrosis: noninvasive assessment with acoustic radiation force impulse elastography–comparison with FibroScan M and XL probes and FibroTest in patients with chronic liver disease. Radiology 269, 283–292, https://doi.org/10.1148/
radiol.13122208 (2013).
14. Bohte, A. E. et al. Non-invasive evaluation of liver fibrosis: a comparison of ultrasound-based transient elastography and MR elastography in patients with viral hepatitis B and C. Eur Radiol 24, 638–648, https://doi.org/10.1007/s00330-013-3046-0 (2014).
15. Bota, S. et al. Factors associated with the impossibility to obtain reliable liver stiffness measurements by means of Acoustic Radiation Force Impulse (ARFI) elastography–analysis of a cohort of 1,031 subjects. Eur J Radiol 83, 268–272, https://doi.org/10.1016/j.
ejrad.2013.11.019 (2014).
16. Huwart, L. et al. Magnetic resonance elastography for the noninvasive staging of liver fibrosis. Gastroenterology 135, 32–40, https://
doi.org/10.1053/j.gastro.2008.03.076 (2008).
17. Tamada, T. et al. Gd-EOB-DTPA-enhanced MR imaging: evaluation of hepatic enhancement effects in normal and cirrhotic livers.
European journal of radiology 80, e311–316, https://doi.org/10.1016/j.ejrad.2011.01.020 (2011).
18. Tajima, T. et al. Relationship between liver function and liver signal intensity in hepatobiliary phase of gadolinium ethoxybenzyl diethylenetriamine pentaacetic acid-enhanced magnetic resonance imaging. Journal of computer assisted tomography 34, 362–366, https://doi.org/10.1097/RCT.0b013e3181cd3304 (2010).
19. Verloh, N. et al. Assessing liver function by liver enhancement during the hepatobiliary phase with Gd-EOB-DTPA-enhanced MRI at 3 Tesla. Eur Radiol 24, 1013–1019, https://doi.org/10.1007/s00330-014-3108-y (2014).
20. Motosugi, U. et al. Liver parenchymal enhancement of hepatocyte-phase images in Gd-EOB-DTPA-enhanced MR imaging: which biological markers of the liver function affect the enhancement? J Magn Reson Imaging 30, 1042–1046, https://doi.org/10.1002/
jmri.21956 (2009).
21. Ryeom, H. K. et al. Quantitative evaluation of liver function with MRI Using Gd-EOB-DTPA. Korean journal of radiology: official journal of the Korean Radiological. Society 5, 231–239 (2004).
22. Haimerl, M. et al. Assessment of Clinical Signs of Liver Cirrhosis Using T1 Mapping on Gd-EOB-DTPA-Enhanced 3T MRI. PloS one 8, e85658, https://doi.org/10.1371/journal.pone.0085658 (2013).
23. Verloh, N. et al. Impact of liver cirrhosis on liver enhancement at Gd-EOB-DTPA enhanced MRI at 3 Tesla. Eur J Radiol 82, 1710–1715, https://doi.org/10.1016/j.ejrad.2013.05.033 (2013).
24. Verloh, N. et al. Impact of liver cirrhosis on liver enhancement at Gd-EOB-DTPA enhanced MRI at 3Tesla. European journal of radiology 82, 1710–1715, https://doi.org/10.1016/j.ejrad.2013.05.033 (2013).
www.nature.com/scientificreports/
25. Bastati, N. et al. Assessment of Orthotopic Liver Transplant Graft Survival on Gadoxetic Acid-Enhanced Magnetic Resonance Imaging Using Qualitative and Quantitative Parameters. Investigative radiology 51, 728–734, https://doi.org/10.1097/
rli.0000000000000286 (2016).
26. Feier, D. et al. Liver fibrosis: histopathologic and biochemical influences on diagnostic efficacy of hepatobiliary contrast-enhanced MR imaging in staging. Radiology 269, 460–468, https://doi.org/10.1148/radiol.13122482 (2013).
27. Nishie, A. et al. MR prediction of liver fibrosis using a liver-specific contrast agent: Superparamagnetic iron oxide versus Gd-EOB- DTPA. J Magn Reson Imaging 36, 664–671, https://doi.org/10.1002/jmri.23691 (2012).
28. Chen, B. B. et al. Dynamic contrast-enhanced magnetic resonance imaging with Gd-EOB-DTPA for the evaluation of liver fibrosis in chronic hepatitis patients. European radiology 22, 171–180, https://doi.org/10.1007/s00330-011-2249-5 (2012).
29. Verloh, N. et al. Liver fibrosis and Gd-EOB-DTPA-enhanced MRI: A histopathologic correlation. Scientific reports 5, 15408, https://
doi.org/10.1038/srep15408 (2015).
30. Chen, J. et al. Diagnostic Performance of MR Elastography and Vibration-controlled Transient Elastography in the Detection of Hepatic Fibrosis in Patients with Severe to Morbid Obesity. Radiology 283, 418–428, https://doi.org/10.1148/radiol.2016160685 (2017).
31. Ishak, K. et al. Histological grading and staging of chronic hepatitis. J Hepatol 22, 696–699 (1995).
32. Development Core Team. A language and environment for statistical computing, http://www.R-project.org. (2008).