AUS DEM LEHRSTUHL FÜR INNERE MEDIZIN I
PROF. DR. MARTINA MÜLLER-SCHILLING
FAKULTÄT FÜR MEDIZIN UNIVERSITÄT REGENSBURG
FAT1 EXPRESSION AND FUNCTION IN CHRONIC LIVER DISEASE
AND
HEPATOCELLULAR CARCINOMA
Inaugural – Dissertation zur Erlangung des Doktorgrades der Biomedizinischen Wissenschaften
der
Fakultät für Medizin der Universität Regensburg
vorgelegt von
Daniela Valletta
2012
Dekan: Prof. Dr. Dr. Torsten E. Reichert Betreuer: Prof. Dr. Claus Hellerbrand Tag der mündlichen Prüfung: 30.04.2013
Das schönste Glück des denkenden Menschen ist, das Erforschliche erforscht zu haben und das
Unerforschliche zu verehren.
Für meine Eltern
I
Table of Contents
1 Summary ... 1
1.1 Zusammenfassung ... 3
2 Introduction ... 5
2.1 Liver ... 5
2.1.1 Anatomy ... 5
2.1.2 Histology and function ... 5
2.2 Liver disease ... 6
2.2.1 Liver fibrosis ... 6
2.2.2 Liver cirrhosis ... 7
2.3 Causes for chronic liver disease ... 8
2.3.1 Alcohol ... 8
2.3.2 Drug induced liver injury ... 8
2.3.3 Autoimmune-related and genetic disorders ... 9
2.3.4 Viral hepatitis ... 9
2.3.4.1 Hepatitis A ... 9
2.3.4.2 Hepatitis B ... 10
2.3.4.3 Hepatitis C ... 10
2.3.4.4 Hepatitis D ... 10
2.3.4.5 Hepatitis E ... 11
2.3.5 Non-alcoholic fatty liver disease (NAFLD) ... 11
2.3.5.1 Definition and prevalence of NAFLD ... 11
2.3.5.2 Etiology and pathogenesis ... 12
2.3.5.3 Prognosis and therapy ... 12
2.4 Liver cancer ... 12
2.4.1 Hepatocellular carcinoma ... 12
2.4.1.1 Prevalence and incidence ... 12
2.4.1.2 Etiology ... 13
2.4.1.3 Therapy and prognosis ... 13
2.4.1.4 Tumor microenvironment ... 14
2.5 Cadherins ... 15
2.6 FAT family ... 16
2.6.1 FAT1 ... 17
Table of Contents II
2.6.1.1 Function, interaction and modification ... 17
2.6.1.2 FAT1 in cancer ... 18
2.7 Hypoxia and hypoxia inducible factor (HIF)-1 ... 19
2.7.1 The transcription factor HIF-1 ... 19
2.7.2 Regulation of HIF1α ... 20
2.8 Aim of the thesis... 21
3 Materials and Methods ... 22
3.1 Chemicals and Reagents ... 22
3.2 Laboratory expendables ... 22
3.3 Laboratory instruments ... 23
3.4 Buffers ... 24
3.5 Plasmids ... 24
3.6 Working with bacteria ... 25
3.6.1 Bacterial strains ... 25
3.6.2 Liquid media and agar plates ... 25
3.6.3 Bacterial culture ... 25
3.6.4 Preparation of competent cells... 25
3.6.5 Transformation ... 26
3.6.6 Isolation of plasmid DNA (mini and midi preparation) ... 26
3.7 Molecular cloning ... 26
3.7.1 Restriction digestion ... 26
3.7.2 Dephosphorylation of plasmid DNA with alkaline phosphatase ... 27
3.7.3 Purification of plasmid DNA by gel extraction ... 27
3.7.4 Ligation ... 27
3.7.5 FAT1 shRNA plasmid ... 27
3.8 Human tissues and tissue microarray ... 28
3.9 Cell culture ... 29
3.9.1 Cell culture medium ... 29
3.9.2 Cultivation of cell lines ... 29
3.9.3 Human hepatocellular carcinoma cell lines ... 30
3.9.4 Cell line of activated human hepatic stellate cells ... 30
3.9.5 Isolation of primary human hepatocytes ... 30
3.9.6 Isolation of human hepatic stellate cells ... 30
3.9.7 Determination of cell number and viability ... 31
Table of Contents III
3.9.8 Collection of conditioned medium ... 31
3.9.9 Transient siRNA transfection ... 31
3.9.10 Transient and stable plasmid transfection ... 32
3.9.11 NFκB reporter gene assay ... 33
3.10 Isolation and analysis of RNA ... 33
3.10.1 RNA isolation and determination of RNA concentration ... 33
3.10.2 Reverse transcription of RNA to cDNA ... 34
3.10.3 Quantitative real time polymerase chain reaction ... 34
3.11 Protein analysis ... 36
3.11.1 Preparation of protein extracts ... 36
3.11.2 Determination of protein concentration ... 36
3.11.3 SDS polyacrylamid gel electrophoresis (SDS-PAGE) ... 37
3.11.4 Western Blotting ... 38
3.11.5 Quantification of caspase-3/7 activity ... 39
3.11.6 S-Adenosylmethionine (SAM) extraction and analysis ... 39
3.12 Flow cytometry ... 40
3.12.1 Annexin V / Propidium iodide double staining ... 40
3.13 Functional assays ... 41
3.13.1 XTT ... 41
3.13.2 Attachment and proliferation assay (xCELLigence System, Roche) 42 3.13.3 Migration (96-well) ... 42
3.13.4 Migration (xCELLigence System, Roche) ... 43
3.14 Animal experiments ... 43
3.14.1 Bile duct ligation ... 43
3.14.2 Thioacetamid induced liver fibrosis ... 43
3.14.3 Experimental NASH model ... 43
3.14.4 Tumor cell inoculation and measurement of tumor growth in NMRI (nu/nu) mice ... 44
3.15 Histology and Immunohistochemistry ... 44
3.15.1 Hematoxylin/Eosin staining ... 44
3.15.2 Immunohistochemical analysis of FAT1 and Ki67 ... 45
3.15.3 TUNEL staining (TdT-mediated dUTP-biotin nick end labeling) ... 46
3.16 Statistical analysis ... 46
4 Results ... 47
Table of Contents IV
4.1 Expression and function of FAT1 in liver fibrosis ... 47
4.1 Expression and function of FAT1 in chronic liver disease ... 47
4.1.1 FAT1 expression in non-alcoholic fatty liver disease (NAFLD) ... 47
4.1.2 FAT1 expression in chronic liver disease ... 49
4.1.3 Expression of FAT1 in hepatic stellate cells (HSCs) ... 51
4.1.4 Functional role of FAT1 in activated HSCs ... 51
4.2 Expression and function of FAT1 in HCC ... 56
4.2.1 Expression of FAT1 in HCC cell lines and primary hepatocytes ... 56
4.2.2 Functional role of FAT1 in HCC cells ... 60
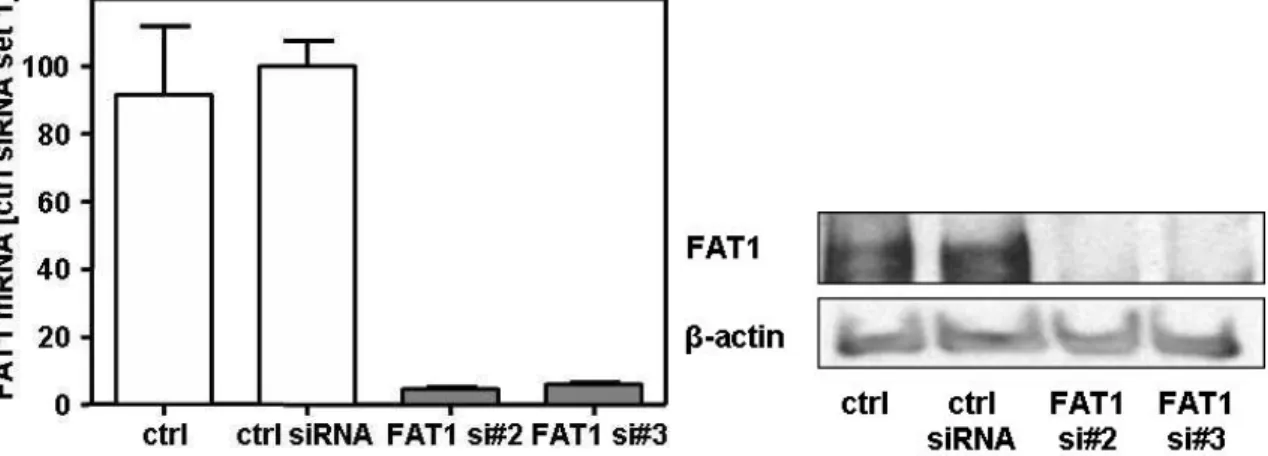
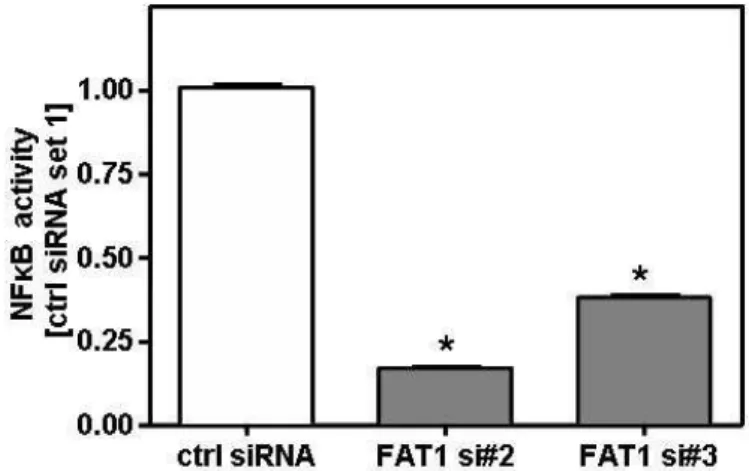
4.2.2.1 Suppression of FAT1 by siRNA transfection ... 60
4.2.2.2 Stable transfected cell clones ... 61
4.2.2.3 Functional changes upon stable transfection ... 62
4.2.3 Function of FAT1 in HCC cells in vivo in the nude mouse model ... 65
4.2.4 Regulation of FAT1 expression ... 67
4.2.4.1 Effect of activated HSCs on FAT1 expression in HCC cells .... 67
4.2.4.2 Regulation of FAT1 expression in HCC cells under anaerobic conditions 69 5 Discussion ... 75
5.1 FAT1 and chronic liver disease ... 75
5.2 FAT1 and hepatocellular carcinoma... 76
5.3 Conclusion ... 80
6 References ... 81
7 Abbreviations ... 90
8 Appendix ... 93
8.1 Curriculum vitae ... 93
8.2 Advanced training and courses ... 94
8.3 Publications ... 94
8.4 Presentations ... 95
8.4.1 Oral poster presentation ... 95
8.4.2 Poster presentations ... 95
8.5 Awards/Grants ... 96
8.6 Danksagung ... 97
8.7 Selbständigkeitserklärung ... 99
1
1 Summary
FAT1 is a member of the atypical cadherin FAT subfamily. The first identified member of this family was Drosophila Fat which has been regarded as a tumor suppressor because of its implication in tissue growth. In vertebrates FAT subfamily consists of 4 members, FAT1, -2, -3 and FAT-J (or FAT4). Only FAT1 has so far been studied more intensively. FAT1 is expressed in a wide range of tissues and a homozygous knockout for FAT1 in mice was perinatal lethal. In vitro studies indicate that it is involved in cell polarity and migration. Cancer research revealed deregulated FAT1 expression. In some tumors as breast cancer FAT1 is over-expressed while FAT1 expression is reduced or deleted in others as astrocytic tumors or cholangiocarcinoma.
In the present work, we first analyzed the role of FAT1 in chronic liver disease. We found FAT1 upregulation in a murine model of non-alcoholic steatohepatitis (NASH) and could confirm this result in human tissue from NASH patients.
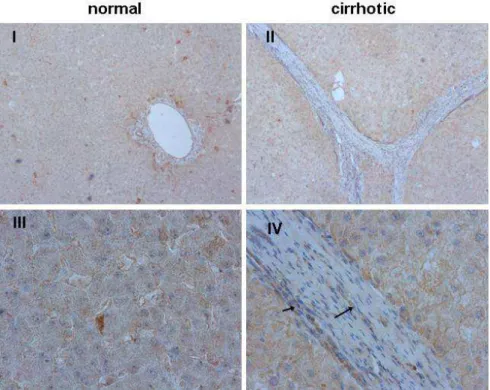
Moreover, we detected induced FAT1 expression in further murine models of chronic liver injury. Thus, bile duct ligation (BDL) as well as hepatotoxic thioacetamide (TAA) administration induced hepatic upregulation of FAT1 expression. Furthermore, FAT1 expression was significantly heightened in cirrhotic human liver tissue. Activated hepatic stellate cells (HSC) were identified as the main cellular source of FAT1 in chronic liver disease. Suppression of FAT1 by siRNA inhibited NFκB activation and thereto proinflammatory gene expression, and reduced apoptosis resistance in activated HSC.
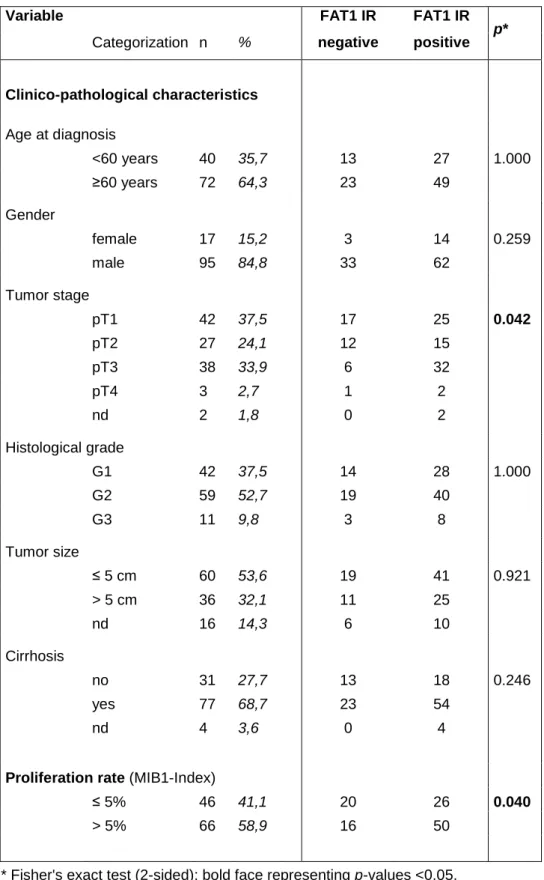
Next, we investigated FAT1 expression and function in hepatocellular carcinoma (HCC). FAT1 expression was significantly upregulated in HCC cell lines as well as in HCC tumor tissue compared to primary human hepatocytes (PHH) and non- tumorous liver tissue. In human HCC tissues strong FAT1 expression correlated with tumor stage and proliferation rate. Stable suppression of FAT1 by shRNA transfection reduced proliferation as well as migratory potential of HCC cells.
Moreover, cells with suppressed FAT1 expression demonstrated higher susceptibility towards apoptosis, induced by serum starvation. To evaluate the role of FAT1 in HCC in vivo we injected stable FAT1 suppressed cells into nude mice.
We observed delayed tumor onset and more apoptotic cells in tumors derived from FAT1 suppressed cell clones.
Summary II Finally, we searched for mechanisms responsible for FAT1 upregulation in HCC.
We found that hepatocyte growth factor (HGF), a factor secreted by activated HSCs, induced FAT1 expression in vitro. FAT1 expression was further increased in HCC cells under hypoxia, and this induction was strongly repressed by inhibition of hypoxia inducible factor 1 alpha (HIF1α). Hypoxia caused significantly reduced levels of the methyl group donor S-adenosylmethionine (SAM), and SAM supplementation inhibited the hypoxia induced FAT1 expression in HCC cells.
Conversely, demethylating agents induced FAT1 expression in HCC cells, and expression analysis in 24 human HCC tissues showed a significant correlation between FAT1 and MAT2A, which is known to critically affect SAM levels in HCC.
In conclusion, increased FAT1 expression in chronic liver disease and HCC functionally promotes the course of disease and thereto may be a new therapeutic target for the prevention and treatment of hepatic fibrosis in chronic liver disease and hepatocellular carcinoma.
Summary III
1.1 Zusammenfassung
FAT1 ist ein Mitglied der atypischen Cadherin-Subfamilie FAT. Das erste identifizierte Mitglied dieser Familie war Drosophila Fat. Dieses wurde aufgrund seiner Funktion im Gewebewachstum als Tumorsuppressor angesehen. In Vertebraten besteht die FAT Subfamilie aus 4 Mitgliedern: FAT1, -2, -3 und FAT-J (FAT4), von denen nur FAT1 genauer erforscht wurde. FAT1 wird in vielen Geweben exprimiert. Ein homozygoter Knockout von FAT1 in Mäusen ist perinatal letal. In vitro Studien zeigten, dass FAT1 an der Zellpolarität und Migration beteiligt ist. In der Krebsforschung wurde eine deregulierte Expression von FAT1 gefunden. In einigen Tumoren, wie z.B. im Brustkrebs, ist FAT1 überexprimiert, wohingegen in anderen Tumoren, wie z.B. in astrozytären Tumoren oder im Cholangiokarzinom, eine verminderte FAT1 Expression vorliegt.
In dieser Arbeit analysierten wir zuerst die Rolle von FAT1 bei chronischen Lebererkrankungen. Eine Hochregulation von FAT1 konnte in einem murinen Modell der Nicht-Alkoholischen-Steatohepatitis (NASH) festgestellt werden. Diese Ergebnisse wurden in humanen Geweben von NASH Patienten bestätigt.
Desweiteren fanden wir eine induzierte FAT1 Expression in murinen chronischen Leberschädigungsmodellen. Die Gallengangsligation (bile duct ligation, BDL) sowie die Gabe von hepatotoxischem Thioacetamid (TAA) führten zu einer erhöhten FAT1 Expression. Außerdem konnte eine signifikante Hochregulation der FAT1 Expression in humanen zirrhotischen Lebergeweben gefunden werden. Als Hauptquelle für FAT1 in chronischen Lebererkrankungen wurden aktivierte hepatische Sternzellen (HSC) identifiziert. Die Suppression von FAT1 in aktivierten HSC mittels siRNA inhibierte die NFκB Aktivierung und verminderte dadurch sowohl die Expression von proinflammatorischen Genen als auch die Apoptoseresistenz.
Weiterhin beschäftigt sich diese Arbeit mit der Expression und Funktion von FAT1 im hepatozellulären Karzinom (HCC). Die FAT1 Expression in HCC Zelllinien sowie in HCC Tumorgeweben war im Vergleich zu primären humanen Hepatozyten (PHH) und nicht-tumorigenen Lebergeweben signifikant hochreguliert. In humanen HCC Geweben korrelierte eine starke FAT1 Expression
Summary IV mit dem Tumorstaging und der Proliferationsrate. Die stabile Suppression von FAT1 mittels shRNA Transfektion verminderte die Proliferation sowie die Migration von HCC Zellen. Außerdem zeigten HCC Zellen mit supprimierter FAT1 Expression eine erhöhte Suszeptibilität gegenüber der durch Serumentzug induzierten Apoptose. Um die Rolle von FAT1 im HCC in vivo zu untersuchen injizierten wir stabil FAT1-supprimierte HCC Zellen in Nacktmäuse. Wir konnten feststellen, dass Tumoren aus FAT1-supprimierten Zellklonen später auftreten und mehr apoptotische Zellen enthalten als Tumoren aus Kontrollzellen.
Schließlich sollten Mechanismen gefunden werden, die für die FAT1 Hochregulation im HCC verantwortlich sind. Es konnte gezeigt werden, dass der Hepatozyten Wachstumsfaktor (hepatocyte growth factor, HGF), der von aktivierten HSCs sekretiert wird, die FAT1 Expression in vitro induziert. Die FAT1 Expression in HCC Zellen konnte weiterhin durch Hypoxie verstärkt werden. Diese Induktion wurde durch Inhibition des Hypoxie induzierten Faktors 1 alpha (HIF1α) stark vermindert. Hypoxie führte zu signifikant verminderten Level des Methylgruppen-Donors S-Adenosylmethionin (SAM) und die Supplementation von SAM inhibierte die durch Hypoxie induzierte FAT1 Expression in HCC Zellen.
Demethylierende Agenzien induzierten dagegen die FAT1 Expression in HCC Zellen. Durch Expressionsanalysen in 24 humanen HCC Geweben konnte eine signifikante Korrelation zwischen FAT1 und MAT2A gefunden werden. Von MAT2A ist bekannt, dass es die SAM Level entscheidend beeinflusst.
Zusammenfassend lässt sich feststellen, dass die erhöhte FAT1 Expression in chronischen Lebererkrankungen und im HCC das Fortschreiten der Erkrankung fördert. Daher könnte FAT1 ein neues therapeutisches Ziel für die Prävention und die Behandlung der hepatischen Fibrose sowie des HCC darstellen.
5
2 Introduction
2.1 Liver
2.1.1 Anatomy
The liver is the largest parenchymal organ and the largest gland in the human body and located in right upper quadrant in the abdominal cavity just below the diaphragm, shielded by the costal arch. Macroscopically, the liver can be subdivided into four different lobes (Lobus hepatis dexter, Lobus hepatis sinister, Lobus quadratus, and Lobus caudatus) and is surrounded by connective tissue, the so called Glisson’s capsule, which is linked to the intrahepatic connective tissue.
The liver is supplied with two blood vessels: the Arteria hepatica propria brings arterial oxygenated blood, and the Vena portae hepatis transports venous, but nutrient-rich blood, drained from the gastrointestinal tract. Blood outflow is accomplished via the liver sinusoids by the Vena hepatica to the Vena cava inferior.
2.1.2 Histology and function
Microscopically, the liver can be further divided into hepatic lobules consisting mostly of hepatocytes and containing a vein in the center (Vena centralis). In the contact area of several lobules the periportal field includes Arteria and Vena interlobularis, as well as bile ducts (Ductuli interlobulares) also known as Glisson’s triangle.
Hepatocytes represent the main cell type of the liver and are divided by liver sinusoids, built by fenestrated, discontinuous endothelium without basal membrane. Kupffer cells are specialized macrophages sitting in the walls of the sinusoids. A 10 to 15 µm wide perisinusoidal space, the space of Disse, is found between hepatocytes and sinusoids. It contains blood plasma and hepatic stellate cells (HSC, also called Ito cells). HSCs store lipids and vitamin A (Figure 2.1).
Introduction 6
Figure 2.1 Graphical overview of the different liver cell types and their localization [modified from (Friedman and Arthur 2002)].
Being the central organ for metabolism and detoxification gives the liver specific tasks. It performs carbohydrate metabolism and thereby regulates blood glucose level in dependency on insulin and glucagon. Moreover, the liver takes part in lipid metabolism by the breakdown of lipids to free fatty acids and glycerol (lipolysis) and fatty acid as well as triglyceride synthesis (lipogenesis). Cholesterol is oxidized by the liver and can be discarded as bile acids. Further, the liver builds plasma proteins like albumin and coagulation factors and is involved in amino acid metabolism. During the degradation of amino acids ammonia is generated and will be used by the synthesis of urea. Additional functions of the liver are biotransformation of xenobiotica and for example heme and storage of iron.
2.2 Liver disease
Liver disease can be classified into acute and chronic liver disease. Acute liver injury can be induced by acute infections or intoxications. This rarely results in complete liver failure thanks to the regenerative response of the liver.
Development of chronic liver disease upon ongoing hepatic injury is characterized by chronic hepatic inflammation which can contribute to liver fibrosis and ultimately cirrhosis.
2.2.1 Liver fibrosis
Liver fibrosis represents a wound healing process of the liver that leads to an excessive deposition of extracellular matrix (ECM) (Bataller and Brenner 2005;
Friedman 2003). Major groups forming the properties of ECM are collagens, elastin, structural glycoproteins, and proteoglycans (Martinez-Hernandez and
Introduction 7 Amenta 1995). Accumulation of ECM is either evolved from overproduction, deficient degradation or both. Current evidence indicates that HSC are central mediators of fibrogenesis (Friedman 2004; Friedman 2008).
Quiescent HSC are located in the space of Disse (see chapter 2.1) and constitute the main storage location for vitamin A. Upon hepatic injury, HSC transform to an activated myofibroblast-like phenotype (Pinzani 1995), which express α-smooth muscle actin (α-sma) and show enhanced proliferation, contractility, fibrogenesis, and proinflammatory signaling.
Fibrogenesis is characterized by deregulation of ECM remodeling with increased ECM deposition. Activated HSC secrete large amounts of collagen, predominantly the fibril-forming collagen I. Its expression is enhanced by activated gene transcription and on posttranscriptional level by increased mRNA stabilization (Stefanovic et al. 1997). Furthermore, the equilibrium between deposition and degradation of ECM is disordered. In healthy liver, matrix metalloproteinases (MMPs) are able to digest fibrotic scar tissue. MMPs are blocked by tissue inhibitors of matrix metalloproteinases (TIMPs), and upon activation HSCs show changes in the expression pattern of these enzymes. It has been shown that TIMP-1 expression is enhanced in response to liver injury, which prevents degradation of ECM (Benyon et al. 1996).
Moreover, activated HSCs are characterized by high resistance to apoptosis. They survive prolonged serum deprivation as well as established pro-apoptotic stimuli like e.g. Fas ligand (Novo et al. 2006).
One key transcription factor in the activation of hepatic stellate cells is NFκB. This signaling pathway is mediating apoptosis resistance (Oakley et al. 2005; Watson et al. 2008). But also, NFκB induces proinflammatory gene expression such as MCP1 and RANTES (Elsharkawy and Mann 2007; Hellerbrand et al. 1998;
Schwabe et al. 2003).
2.2.2 Liver cirrhosis
The most advanced stage of fibrosis is cirrhosis. It is characterized by loss of liver function upon change of liver architecture. Nodules of regenerating hepatocytes and fibrotic septa are formed and replace normal parenchyma, which leads to hepatocellular dysfunction and obstruction of hepatic blood flow. The consequences are development of portal hypertension and hepatic insufficiency (Iredale 2003). Further complications are ascites, gastroesophageal varices,
Introduction 8 bleeding resulting from decreased production of coagulation factors, hepatic encephalopathy and many more (Schuppan and Afdhal 2008). Moreover, presence of liver cirrhosis is the main risk factor for the development of HCC (Farazi and DePinho 2006).
2.3 Causes for chronic liver disease
2.3.1 Alcohol
Chronic alcohol abuse is a major cause of chronic liver disease in Western countries. Alcohol consumption of over 20 g/day for women and 40 g/day for men, respectively, can cause alcoholic liver disease (Gramenzi et al. 2006). Fatty liver develops in more than 90% heavy drinkers, about 30% develop more severe forms, such as fibrosis and cirrhosis, and approximately 1-2% of alcoholic cirrhotics develop HCC each year (Gao and Bataller 2011; Seitz and Stickel 2007).
Important mechanisms contributing to the pathogenesis of alcoholic liver disease are alcohol induced hepatotoxicity due to formation of acetaldehyde/acetate and oxidative stress in consequence of formation of reactive oxygen species (ROS).
Further, production of cytokines results in immune response and infiltration of immune cells. In this stage, disease has progressed to steatohepatitis. Upon both, ROS and cytokine release, HSCs become activated and development of fibrosis initiates (De Minicis and Brenner 2008).
2.3.2 Drug induced liver injury
Since one function of liver is metabolizing xenobiotics (see chapter 2.1.2), it is obvious that drug-induced liver disease is a frequent complication of pharmaceuticals. Acute liver failure (ALF) is the worst consequence leading to death or requiring liver transplantation. More than half of all cases of ALF in the U.S. are caused by drugs, and the majority (39%) is provoked by acetaminophen (paracetamol). However, more than 10% of ALF are called idiosyncratic, which means that hepatotoxicity occurs only infrequently in between 1 in every 1,000 patients to 1 in every 100,000 patients (Ostapowicz et al. 2002).
Pathology of drug-induced liver disease covers a broad spectrum, from acute hepatic necrosis, chronic hepatitis, cholestasis to neoplasms and depends on different mechanisms of hepatotoxicity, e.g. cell death resulting from direct binding
Introduction 9 of the drug to cell proteins, disorganization of the cytoskeleton, and blockage of the mitochondrial function (Navarro and Senior 2006).
2.3.3 Autoimmune-related and genetic disorders
Liver disease can also be effected by autoimmune disorders. Autoimmune hepatitis (AIH) is a generally progressive, chronic hepatitis with fluctuating course (Krawitt 2006). Further, primary biliary cirrhosis (PBC) and primary sclerosing cholangitis (PSC) are cholestatic liver disease based on autoimmune related mechanisms (Boonstra et al. 2012). Moreover, genetic defects may affect liver.
Patients with Gilbert’s disease show reduced activity of UDP- glucuronosyltransferase (UGT1A), and therefore, they have increased bilirubin serum levels and jaundice. Accumulation of copper in liver and brain is characteristic for Wilson’s disease, an autosomal recessive genetic disorder caused by mutations in the ATP7B gene (Ala et al. 2007). Similarly, in hemochromatosis the liver is harmed by iron overload. There are different forms of hereditary hemochromatosis with mutations in four diverse genes involved in iron metabolism (HFE, HJV, HAMP, TfR2) (Pietrangelo 2004). Further genetic disorders involving the liver are α1-antitrypsin deficiency, glycogen storage disease, and cystic fibrosis.
2.3.4 Viral hepatitis
Viral hepatitis is the consequence of infection with hepatitis virus A-E. Most relevant forms are presented below.
2.3.4.1 Hepatitis A
Hepatitis A is caused by the hepatitis A virus (HAV), a non-enveloped RNA virus and member of the Picornaviridae family. The predominant way of spreading is enteric transmission (faecal-oral) via person-to-person, or by consumption of contaminated water or food (e.g. bivalve molluscs). Areas of high endemicity are Asia, Africa, and Central and South America (Koff 1998).
Incubation period is 15-50 days and symptoms of acute infection may be fatigue, nausea, vomiting, and fever. Later on, there may be patients with cholestatic symptoms like jaundice and dark colored urine. Symptoms usually last less than two months and infection never takes chronic course. However, less than 1% of all
Introduction 10 hepatitis A patients show a severe course of the disease with acute liver failure.
Prevention of HAV infection is possible because HAV vaccines are available.
2.3.4.2 Hepatitis B
Hepatitis B virus (HBV) is an enveloped DNA virus and belongs to the Hepadnaviridae virus family. The genome is replicated by utilization of a reverse transcriptase. Hepatitis B infection is one of the most common infectious diseases in the world, and virus transmissions occur percutaneously, sexually, and perinatally. High endemic regions are China, South East Asia, and sub-Saharan Africa. Because of its envelope HBV is quite stable and it shows high resistance to disinfectants, but a safe vaccination with active immunization exists (Lavanchy 2004).
Around one-third of infections proceed asymptomatically, the other patients have symptoms after an incubation time of 45 to 120 days. Symptoms are similar to HAV infection and typical for acute virus hepatitis. 0.5-1% of all HBV infections take severe course with fulminant hepatic failure. More than 90% of infections are self-limiting and patients have acquired lifelong immunity against HBV. In up to 10% of patients virus infection persists and they suffer a chronic infection, which is a risk factor for developing cirrhosis and HCC (Dandri and Locarnini 2012).
2.3.4.3 Hepatitis C
The hepatitis C virus (HCV) is a member of the Flaviviridae family, comprising enveloped RNA virus. Transmission is possible by direct blood contact and perinatal from mother to child, in fewer cases also by sexual contact. High rates of chronic infection are found in Egypt, Pakistan and China. No protecting vaccine exists to date. Therefore, prevention of exposition is critical.
75% of all infected persons have no or no specific symptoms, and thereto virus infection is often not diagnosed. Only 25% of HCV infections cause mild hepatitis symptoms. Persistence of HCV infections occurs in the majority of HCV-infected individuals, leads to chronic liver damage and may cause fibrosis, cirrhosis and HCC (Bartosch et al. 2009).
2.3.4.4 Hepatitis D
Hepatitis D occurs only in individuals positive for the HBV surface antigen, seen as hepatitis delta virus (HDV) is a satellite virus, which is defective and requires a
Introduction 11 coinfection with HBV for its replication. Hence, immunization against HBV also protects from a HDV infection. Acute HBV and HDV coinfection is more severe than HBV infection alone, and chronic HDV infection takes a more progressive course than HBV monoinfection (Wedemeyer and Manns 2010)
2.3.4.5 Hepatitis E
Hepatitis E is provoked by infection with hepatitis E virus (HEV), which forms the Hepeviridae family. HEV is a non-enveloped RNA virus and is shown to be transmitted via the oral-faecal route or by contaminated water. Clinically, HEV infection is comparable to hepatitis A, but develops to acute, severe liver disease in some cases, especially in pregnant women. Chronic HEV infection is described in organ transplanted patients (Wedemeyer et al. 2012).
2.3.5 Non-alcoholic fatty liver disease (NAFLD)
2.3.5.1 Definition and prevalence of NAFLD
It has been known for a long time that fatty livers of obese people can develop inflammation and fibrosis, but the term “non-alcoholic steatohepatitis (NASH)” has been introduced by Ludwig et al. (Ludwig et al. 1980). It describes hepatic steatosis and liver inflammation in patients without (significant) alcohol consumption. Meanwhile, the term “non-alcoholic fatty liver disease (NAFLD)” also includes fatty liver without hepatitis.
NAFLD can take a progressive course starting from hepatic steatosis, which is characterized by deposition of triglycerides as lipid droplets in hepatocytes, following the development of NASH with ballooning of hepatocytes and cell death.
Prevalence of NAFLD is estimated to be 20-30% in Western countries (Bedogni et al. 2005; Browning et al. 2004). The percentage of NAFLD patients is higher in obese people (57.5-74%) (Angulo 2002). In children prevalence of NAFLD is also increased in presence of obesity (Schwimmer et al. 2006). Moreover, advancing age is a risk factor for developing NAFLD (Frith et al. 2009).
Strong associations between NAFLD and obesity, insulin resistance, hypertension, as well as dyslipidaemia have been found and are the origin for considering NAFLD as the liver manifestation of the metabolic syndrome (de Alwis and Day 2008).
Introduction 12 2.3.5.2 Etiology and pathogenesis
Day and James described a two-hit-model for the pathogenesis of NAFLD (Day and James 1998). The ‘first hit’ arises from an imbalance between lipid acquisition and removal and leads to hepatic fibrosis. Subsequently, a ‘second hit’ induces inflammation. This includes oxidative stress due to increased lipid oxidation and deregulated cytokine production and results in steatohepatitis. But since NASH doesn’t show progression to fibrosis and cirrhosis in every patient, a ‘third hit’
appear to be necessary.
2.3.5.3 Prognosis and therapy
Prognosis of simple steatosis is good, but 20-30% of patients with NASH develop hepatic fibrosis and 10-30% evolve cirrhosis within 10 years (Argo et al. 2009;
Argo and Caldwell 2009). This NASH induced cirrhosis is further a risk factor for HCC.
Exercise, weight loss (diet-induced or by bariatric surgery) and treatment of the metabolic syndrome are recommended therapies since no established pharmacological treatment of NAFLD exists.
2.4 Liver cancer
The liver can be affected by metastatic cancer especially by spreading tumors of the gastrointestinal tract, breast, lung, pancreas and by malignant melanoma.
Primary liver cancer is arising from liver cells and can be classified into different groups. Hepatocellular carcinoma (see chapter 2.4.1) and cholangiocarcinoma, a malignant tumor developing from the biliary tract represent 10%-25% of primary hepatic malignancies (Tyson and El-Serag 2011). Quite rare is the embryonal hepatoblastoma. Besides, there exist the mesenchymal angiosarcoma of the liver, a neoplasm of endothelial blood vessel cells forming 2 % of all primary liver tumors (Maluf et al. 2005).
2.4.1 Hepatocellular carcinoma
2.4.1.1 Prevalence and incidence
Hepatocellular carcinoma (HCC) is the sixth most common cancer worldwide with around 700,000 newly diagnosed cases per year and the most frequent form of primary liver cancer with about 85%-90% (El-Serag and Rudolph 2007; Forner et
Introduction 13 al. 2012). Because of its high lethality it is the third most common cause of death from cancer worldwide. The disease is more frequent in men than in women, and highest occurrence rates are reported for Eastern and Southeastern Asia (Ferlay et al. 2010). But the incidence of HCC is increasing in developed countries.
Reasons may be rising rates of HCV infections (see chapter 2.3.4) and non- alcoholic steatohepatitis (NASH, see chapter 2.3.5) as a consequence of diabetes and obesity (Venook et al. 2010).
2.4.1.2 Etiology
Hepatocarcinogenesis is a multi-step process based on cycles of inflammation, necrosis, oxidative stress and regeneration leading to genomic instability and epigenetic changes (Farazi and DePinho 2006). HCC mostly arises from an established background of chronic liver disease and cirrhosis (80%-90%), and the 5-year cumulative risk for developing HCC in patients with cirrhosis ranges from between 5% and 30% (El-Serag 2011). Cirrhosis is mostly caused by chronic HBV or HCV infection, chronic alcohol abuse or NASH. Less common causes include hereditary hemochromatosis, Wilson’s disease, and α-1 antitrypsin deficiency (see chapter 2.3).
Another risk factor for HCC in tropical regions is intoxication with aflatoxin produced by the fungus Aspergillus fumigatus via contamination of food grains (El- Serag and Rudolph 2007).
2.4.1.3 Therapy and prognosis
Despite new strategies for the therapy, HCC remains a disease with poor prognosis attributed to frequently late diagnosis and aggressive tumor growth. A meta-analysis revealed a one year survival rate of 17.5% for untreated HCC patients (Cabibbo et al. 2010).
Resection of the tumor is the first choice of treatment for patients without cirrhosis because of their limited liver function. However, risk for recurrence of HCC is quite high with about 70% of the patients with tumor remission within 5 years (Forner et al. 2012). Another surgical option is liver transplantation, which seems to be optimal curing tumor and cirrhosis simultaneously. However, drawbacks are organ shortage and lifelong immunosuppression. And also in this case the risk of tumor recurrence is approximately 20%. (Zimmerman et al. 2008).
Introduction 14 Different forms of ablation are possibilities to treat HCC, even while awaiting transplantation or to make the tumor resectable. Ablation destroys tumor tissue by modifying the temperature of neoplastic cells (e.g. radiofrequency ablation, RFA) or by using chemical substances (e.g. percutaneous ethanol injection, PEI) (Gervais and Arellano 2011).
Transarterial chemoembolization (TACE) is another therapy for unresectable HCC.
Ischemic tumor necrosis is induced by occlusion of hepatic arteries with embolizing agents (gelantine, microspheres) together with chemotherapeutic drugs (Llovet and Bruix 2008). Another form of this principle is radioembolization (also called selective internal radiation therapy, SIRT). Here, microspheres coated with yttrium 90 (90Y), a β-emitting isotope, are injected intraarterially. Thereby, embolization as well as radiation of malignant tissue can be achieved (Sangro et al. 2012).
Knowledge of molecular events taking place during tumor progression made it possible to develop therapies against new targets. For patients with advanced stage HCC systemic therapy with the multikinase inhibitor sorafenib is considered.
It blocks Raf signalling and receptors for VEGF, PDGF, as well as c-Kit and thereby shows antiangiogenic and antiproliferative effects. It has been shown to prolong median overall survival and median time to radiologic progression, as compared with placebo (Llovet et al. 2008).
2.4.1.4 Tumor microenvironment
The tumor surrounding microenvironment largely consists of hepatic stellate cells, fibroblasts, immune cells, and endothelial cells. Cells within the tumor microenvironment influence tumor growth by multiple mechanisms. HCC is a highly vascularized tumor, and endothelial cells are essential for blood vessel formation. Activation, proliferation and migration of endothelial cells promote angiogenesis (Semela and Dufour 2004). Tumor infiltrating immune cells like lymphocytes and Kupffer cells secrete cytokines, growth factors and chemokines which increase cancer cell motility. Hepatic stellate cells can be detected around tumor sinusoids, fibrous septa and the capsule (Dubuisson et al. 2001; Faouzi et al. 1999; Le Bail B. et al. 1999). Activation of HSCs is not only the key event of hepatic fibrosis and progression to cirrhosis as a high risk factor for developing HCC (see chapter 2.2). Beyond that HSCs promote tumorigenesis by their ability to remodel the extracellular matrix. Moreover, they release different factors by
Introduction 15 which HCC cells become directly affected and through the activation of signalling pathways triggered by HSCs migratory and proliferative capability of HCC cells are enhanced (Amann et al. 2009a).
2.5 Cadherins
Cell adhesion molecules (CAM) are required to direct cells to stay at one specific site, to form cell-cell and cell-matrix junctions, or to disrupt these associations and promote directional migration. CAM can be classified into four major protein families: the integrin family, the selectin family, the immunoglobulin superfamily, and the cadherin family.
Cadherins are characterized by conserved repeating motifs in their extracellular domains. The quantity of these cadherin repeats is variable. Moreover, the motif, which is structurally related to immunoglobulin (Ig) domains, mediates the calcium dependence by Ca2+ binding domains. Most cadherins are single-pass transmembrane glycoproteins (Angst et al. 2001).
The cadherin superfamily can be divided into two groups, classical and nonclassical cadherins. Classical cadherin family was identified first and is important for the formation of adherens junctions between cells. Cadherins usually link cells by homophilic mechanism. Here, the extracellular tails of molecules of the same kind bind to each other. The cytoplasmic tail of classical cadherins mainly interacts with the actin cytoskeleton via β-catenin. Best studied protein members of the classical cadherin family are E-cadherin and N-cadherin. They play a role in mesenchymal-epithelial-transition (MET) during development and also in epithelial-mesenchymal-transition (EMT) during cancer metastasis (Peinado et al. 2004).
A subfamily of the nonclassical cadherins is called desmosomal cadherin family, because of its role in the arrangement of desmosomes, like desmocollin or desmoglein. These cadherins interact with intermediate filaments via plakoglobin (Gumbiner 2005).
Furthermore, the nonclassical cadherin group contains some cadherins which cannot be assigned to a specific family, called atypical cadherins, like Fat, Dachsous, and Flamingo.
Introduction 16
2.6 FAT family
The cadherin subfamily FAT is characterized by large extracellular domains containing 34 cadherin motifs, a variable number of epidermal growth factor (EGF)-like repeats, one or two laminin A/G domains, and a single transmembrane domain (Tanoue and Takeichi 2005).
Drosophila fat was the first identified gene of this protein family (Mahoney et al.
1991). Mutations at this gene locus caused hyperplastic overgrowth of all larval imaginal discs, which led to the suggestion that Fat regulates tissue growth and operates as a tumor suppressor protein (Bryant et al. 1988). Several studies revealed Fat as a member of the Hippo signaling pathway controlling cell proliferation and survival (Bennett and Harvey 2006). Recent studies discovered a role of Fat in the regulation of planar cell polarity (PCP). PCP signaling regulates the establishment of polarity within the plane of an epithelium and involves Fat and Dachsous (Sopko and McNeill 2009).
Another Fat subfamily cadherin, Fat-like, was identified in Drosophila. It is involved in morphogenesis and maintenance of tubular structures of ectodermal origin and has no influence on growth or PCP (Castillejo-Lopez et al. 2004).
In vertebrates Fat subfamily consists of 4 members, FAT1, -2, -3 and FAT-J (or FAT-4). Analysis for similarities has shown that FAT-J could be the ortholog of Drosophila Fat. FAT1 and FAT3 revealed highest resemblance and can form a subgroup together with FAT2 and Drosophila Fat-like (Tanoue and Takeichi 2005).
Information about function of vertebrate FAT proteins is limited, only FAT1 has so far been studied more intensively.
Figure 2.2 Schematic representation of the cadherin superfamily [modified from (Tanoue and Takeichi 2005)].
Introduction 17
2.6.1 FAT1
Dunne et al. identified human FAT1 as the first Fat-like protein in vertebrates.
FAT1 was shown to be expressed in a wide range of tissues (e.g. kidney, lung, eye, and pancreas) with higher expression in fetal opposed to adult tissue. In situ hybridization revealed localization of the gene encoding FAT1 on chromosome 4q34-q35 (Dunne et al. 1995). Thereafter, FAT1 has been described in rat, mouse, and zebrafish (Cox et al. 2000; Down et al. 2005; Ponassi et al. 1999). Further studies investigated FAT1 expression in the kidney, where it is located at cell-cell contacts and where it forms an element of glomerular slit diaphragms (Inoue et al.
2001). Moreover, FAT1 is found to be expressed in the Langerhans islets of the pancreas (Rinta-Valkama et al. 2007).
2.6.1.1 Function, interaction and modification
As a first step to get an insight in the function of FAT1 its gene expression has been silenced, but the homozygous knockout of FAT1 locus in mice was perinatal lethal with defects in kidney and brain (Ciani et al. 2003). Further findings concerned cellbiological function of FAT1. FAT1 is localized to cell-cell contacts as well as lamellipodia and filopodial tips, where it organizes actin filaments and promotes migration. Interaction of FAT1 with Enabled/vasodilator-stimulated phosphoproteins (Ena/VASP) is shown to be essential for regulation of actin dynamics and cell polarization (Moeller et al. 2004; Tanoue and Takeichi 2004).
Ena/VASP proteins are actin-binding proteins involved in promotion and inhibition of actin-dependent processes and are thereby implicated in polarization and migration, too (Krause et al. 2003). The interaction of FAT1 with Ena/VASP proteins is mediated by Ena/VASP homology I (EVHI) domains, for which functional binding sites have been found in FAT1 (Tanoue and Takeichi 2004).
These binding sites have also been described to bind Homer proteins (Schreiner et al. 2006). Homer proteins are scaffolding proteins found in many tissues, but are best characterized in neurons. They are implicated in many signalling pathways by binding different key proteins like metabotropic glutamate receptors, inositol trisphosphate dependent Ca2+ channels, small GTPases and others (Shiraishi-Yamaguchi and Furuichi 2007).
In vascular smooth muscle cells (VSMC) FAT1 expression is upregulated in response to arterial injury, and knockdown of FAT1 limited migration but improved
Introduction 18 proliferation (Hou et al. 2006). Further, FAT1 has been shown to interact with Atrophins. Atrophin proteins are conserved transcriptional repressors and their family includes two different members in vertebrates: Atrophin 1 (synonym DRPLA) and Atrophin2 (synonym RERE) (Wang and Tsai 2008). Like FAT1, Atrophin1 and 2 are upregulated upon injury in VSMC, but their downregulation has no effect on proliferation. In contrast, suppression of Atrophin 2 led to enhanced VSMC migration, for which FAT1 expression was essential (Hou and Sibinga 2009).
Another interaction partner of FAT1 is β-catenin. Binding is accomplished by the acidic and prolin-rich FC domains in the FAT1 intracellular part (FAT1IC). Besides, expression of FAT1 affects cellular distribution and transcriptional activity of β- catenin. Moreover, FAT1 can be spliced and the cytoplasmic domain is able to translocate into the nucleus due to a putative nuclear localization sequence (NLS) (Hou et al. 2006; Magg et al. 2005; Nishikawa et al. 2011).
FAT1 can be modified posttranscriptionally by alternative splicing in the cytoplasmic domain. Thereby, two additional variants can be generated:
FAT1(+12) (additional 12 aa in frame), FAT1(+32) (additional 32 aa in frame), and FAT1 (+8TR) (termination after 8aa). FAT1(+32) and FAT1 (+8TR) are specifically expressed within the central nervous system (CNS). In the rat kidney epithelial cell line NRK-52E, splicing is regulated upon cell density. Quiescent cells express predominantly the FAT1(+12) isoform, whereas in proliferating or migrating cells, respectively, a preponderance of wildtype FAT1 can be determinated, and this isoform is even sufficient for migration (Braun et al. 2007).
Proteolytical cleavage is another mechanism of FAT1 modification. In HaCaT cells, an immortalized human keratinocyte cell line, FAT1 is processed into two products (p430 and p85), before achieving cell surface expression as a heterodimer. The cleavage is dependent on the proprotein convertase furin, and leads to almost complete loss of the full length p500. In melanoma cells an additional product, p65, has been identified, which has lost the ability to associate with the extracellular domain and can be found in the cytoplasm (Sadeqzadeh et al. 2011).
2.6.1.2 FAT1 in cancer
In cancer research contradictory results have been found regarding FAT1 expression. Frequent loss of heterozygosity (LOH) of FAT1 has been described in
Introduction 19 oral squamous cell carcinomas (OSCC) and astrocytic tumors (Chosdol et al.
2009; Nakaya et al. 2007). LOH describes the deficiency of one allel of a gene in which the other allel was already inactivated and is mostly concerning tumorsuppressors. In cholangiocarcinoma immunohistochemical staining of FAT1 demonstrated reduced expression at the normal membranous location (Settakorn et al. 2005). However, a study about breast cancer revealed FAT1 overexpression and its diffuse expression in both, carcinoma in situ and invasive carcinoma (Kwaepila et al. 2006). Further, FAT1 is expressed in leukemia cell lines, whereas in normal peripheral blood cells and in the bone marrow no expression of FAT1 was detectible. High FAT1 expression in precursor B-cell (preB) acute lymphoblastic leukemia (ALL) was prognostic for shorter relapse-free and overall survival (de Bock et al. 2012).
2.7 Hypoxia and hypoxia inducible factor (HIF)-1
Oxygen is essential for most aerobic organisms. In vertebrates, O2 is necessary as final electron acceptor during cellular respiration. In the process of oxidative phosphorylation ATP is generated and O2 is reduced to water. Oxygen deficiency is called hypoxia and plays an important role in many pathological conditions.
Hypoxia leads to activation of different adaption processes in the cell.
2.7.1 The transcription factor HIF-1
HIF-1 has been discovered as a main mediator of hypoxic adaption. Under hypoxic conditions, HIF-1 transcriptionally regulates expression of many target genes, and thereby promotes activation of required mechanisms on cellular, local, and systemic level (Wenger 2002). Identification of HIF-1 has been made together with a specific regulatory element (enhancer) of the human erythropoietin gene (epo) (Semenza and Wang 1992). EPO mediates production of erythrocytes and herewith, improves oxygen supply. Later on, it has been clarified that HIF-1 is a heterodimer composed of a 120 kDa HIF-1α and a 91 kDa HIF-1β subunit (Wang and Semenza 1995). HIF-1β, also known as aryl hydrocarbon receptor nuclear translocator (ARNT), is constitutively expressed and located in the nucleus, whereas HIF-1α is immediately degraded under normoxia. Upon hypoxic conditions HIF-1α is stabilized. Thus it accumulates and translocates to the nucleus, where it forms the dimer with HIF-1β.
Meanwhile, two HIF-1α homologes have been identified: HIF2α and HIF3α.
Introduction 20 HIF2α (EPAS) shows high sequence similarity with HIF1α, but its expression is more constricted. Since HIF1α is quite ubiquitinously expressed, HIF2α can only be found in certain tissues (Park et al. 2003). This aspect and the fact that HIF1α knockout embryos are non-viable (Iyer et al. 1998; Kotch et al. 1999; Ryan et al.
1998) let infer that HIF1α is essential and cannot be replaced by its homologue.
HIF3α (IPAS) lacks a transactivation domain, binds to HIFα subunits and has an antagonistic effect, which may represent a feedback regulation because HIF3α expression is upregulated by HIF1α in hypoxic conditions (Gu et al. 1998; Makino et al. 2001; Makino et al. 2007).
HIF1α and HIF1β are members of the bHLH (basic helix-loop-helix)/PAS protein family. The bHLH domain mediates dimerization of both subunits, whereas the PAS domain, named after the first three proteins (PER, ARNT, SIM) in which this structure has been found, is important for binding to a consensus HIF DNA binding site (HBS) (5’-ACGTG-3’) in the so called hypoxia responsive element (HRE) (Jiang et al. 1996; Wang et al. 1995). Furthermore, transactivation domains (TAD) exist in both subunits to facilitate interaction with cofactors (CBP, p300) (Jiang et al. 1997). The oxygen dependency is established by two ODD (oxygen dependent degradation domain) in HIF1α protein (Ivan et al. 2001; Jaakkola et al. 2001).
2.7.2 Regulation of HIF1
αDegradation of HIF1α under normoxic conditions starts with hydroxylation of two proline residues in the ODD. This reaction is mediated by prolyl hydroxylases (PHD) and is oxygen-, iron-, 2-oxoglutarate-, and ascorbate-dependent (Kivirikko and Myllyharju 1998).
Thereafter, pVHL (von Hippel-Lindau tumor suppressor) recognizes hydroxyproline, and hence, binds to HIF1α. pVHL is a component of the E3 ubiquitin ligase complex. It ubiquitylates and thereby designates the protein for proteasomal degradation (Tanimoto et al. 2000). Furthermore, the factor inhibiting HIF-1 (FIH-1) hydroxylates asparagyl residues in the TAA domain of HIF1α. Thus, cofactors like CBP or p300 are no longer capable to bind to HIF1α (Schofield and Ratcliffe 2005).
Hypoxic conditions prevent both hydroxylations, mediated by PHD as well as by FIH-1. Therefore, no degradation of HIF-1α takes place; it can translocate into the nucleus and in form of the dimer with HIF-1β promotes gene expression.
Introduction 21
2.8 Aim of the thesis
Based on the fact that to date no data regarding FAT1 in the liver exists, neither healthy nor pathologically changed, the aim of this thesis was to analyze expression and function in chronic liver disease and in hepatocellular carcinoma.
Another focus of the analysis was regulation of FAT1 expression in HCC and the influence of hypoxia which was shown to be important in HCC.
22
3 Materials and Methods
3.1 Chemicals and Reagents
Agarose SeaKem ® LE Biozym, Hess/Oldendorf, Germany
Agar Difco Laboratories, Augsburg
Ampicillin Sigma-Aldrich, Deisenhofen, Germany
β-Mercaptoethanol Sigma-Aldrich, Deisenhofen, Germany
Ciprofloxacin Fresenius Kabi, Bad Homburg, Germany
Collagenase type IV Sigma-Aldrich, Hamburg, Germany
Fluconazol B. Braun, Melsungen, Germany
DMEM medium PAA Laboratories, Cölbe, Germany
DMSO Sigma-Aldrich, Deisenhofen, Germany
FCS (fetal calf serum) PAN-Biotech, Aidenbach, Germany
Milk powder Carl Roth, Karlsruhe, Germany
Geneticin Invitrogen, Karlsruhe, Germany
Penicillin Invitrogen, Karlsruhe, Germany
Streptomycin Invitrogen, Karlsruhe, Germany
Trypsin/EDTA PAA Laboratories, Cölbe, Germany
Cycloheximid Sigma-Aldrich, Deisenhofen, Germany
5-Azacytidine (Aza) Sigma-Aldrich, Deisenhofen, Germany Adenosine periodate oxidized (Adox) Sigma-Aldrich, Deisenhofen, Germany 2,2-dipyridyl (DP) Sigma-Aldrich, Deisenhofen, Germany Thioacetamide (TAA) Sigma-Aldrich, Deisenhofen, Germany Staurosporine (STS) Alexis Biochemicals, Lausen, Switzerland
3.2 Laboratory expendables
CryoTube vials Nunc, Roskilde, Denmark
Pipet tips
(10, 20, 100 und 1000 µl)
Eppendorf, Hamburg, Germany
Falcon tubes (50 ml) Corning, New York, USA
Glassware (various) Schott, Mainz, Germany
Multiwell plates Corning, New York, USA
Materials and Methods 23 Pipettes (stripettes ®)
(5, 10, 25, 50 ml)
Corning, New York, USA
Reaction vessels (1.5 and 2 ml) Eppendorf, Hamburg, Germany Strip tubes (0.2 ml) Peqlab, Erlangen , Germany Cell culture flasks T25, T75, T175 Corning, New York, USA
3.3 Laboratory instruments
Heating block:
Thermomixer comfort Eppendorf, Hamburg, Germany
PCR-cycler:
GeneAmp® PCR System 9700 Applied Biosystems, Foster City, USA LightCycler® Real-Time PCR System Roche Diagnostics, Mannheim,
Germany Pipettes:
Eppendorf Research
(1000 µl, 200 µl, 100 µl, 20 µl, 10 µl,
2 µl) Eppendorf, Hamburg, Germany
Pipette controllers:
Accu-jet® Brand, Wertheim, Germany
Shaking devices:
KS 260 Basic Orbital Shaker IKA® Werke, Staufen, Germany Power Supplies:
Consort E145
Power Supply-EPS 301
Peqlab, Erlangen, Germany
Amersham Biosciences, Munich, Germany
Spectrophotometer:
EMax® Microplate Reader SPECTRAFluor Plus
MWG Biotech, Ebersberg, Germany Tecan, Männedorf, Switzerland Scale:
MC1 Laboratory LC 620 D Sartorius, Göttingen, Germany
Materials and Methods 24 Water bath:
Haake W13/C10 Thermo Fisher Scientific, Karlsruhe,
Germany XCELLigence system:
Real-Time Cell Analyser (RTCA) Roche Diagnostics, Mannheim, Germany
Centrifuges:
Biofuge fresco Megafuge 1.0 R
Heraeus, Hanau, Germany Heraeus, Hanau, Germany Microscope:
Olympus CKX41 with
ALTRA20 soft imaging system
Olympus Hamburg, Germany
3.4 Buffers
PBS buffer 140 mM NaCl
10 mM KCl
6.4 mM Na2HPO4
2 mM KH2PO4 pH 7.4
TE buffer 10 mM Tris/HCl
1 mM EDTA pH 8.0
3.5 Plasmids
pBS/U6 ploxPneo by courtesy of Prof Dr. C. Deng, NIH, Bethesda, USA
pcDNA3.1 Invitrogen, Karlsruhe, Germany
pCMX Addgene, Cambridge, USA
pIC-Cre by courtesy of Prof Dr. T. Hehlgans,
University Regensburg, Germany
pRL-TK Promega, Mannheim, Germany
NFκB luc Promega, Mannheim, Germany
Materials and Methods 25
dnHIF1α by courtesy of Dr. C. Warnecke,
Erlangen, Germany
3.6 Working with bacteria
3.6.1 Bacterial strains
Top10 Invitrogen, Karlsruhe, Germany
294-Cre: Cre-recombinase expressing Escherichia coli
Gene Bridges, Heidelberg, Germany
3.6.2 Liquid media and agar plates
LB medium 10 g/l peptone
5 g/l yeast extract
10 g/l NaCl
Suspended in H2O and autoclaved For plates + 15 g/L Agar
For selection + 100 µg/ml Ampicillin
3.6.3 Bacterial culture
E. coli strains were cultivated on solid LB-agar as well as in liquid medium.
Ampicillin was added to LB medium for selection of insert-containing clones after transformation. Bacteria were spread out on agar plates using a Drigalski spatula and incubated overnight at 37°C. Liquid cultures were inoculated by a single bacterial colony with a sterile pipette tip and grown overnight at 37°C on a shaking device (250 rpm).
3.6.4 Preparation of competent cells
Calcium chloride treatment of E.coli facilitates uptake of free plasmid DNA.
Bacterial culture was incubated in LB medium at 37°C to an optical density (OD650) of 0.2-0.5.
After incubation for 5 min on ice cells were centrifuged (1500 g, 10 min, 4°C), resuspended in chilled calcium chloride solution (50 mM), centrifuged and
Materials and Methods 26 resuspended again in chilled calcium chloride (50 mM). The suspension containing 15% glycerol was aliquoted and shock frozen in liquid nitrogen for long-term storage.
3.6.5 Transformation
Chemically competent E.coli (50 µl) were thawed on ice and 100 ng plasmid DNA were added. After 30 min incubation on ice cells were heat shocked at 42°C for 45 s and immediately cooled on ice. Thereafter, 250 µl pre-warmed SOC medium was added and the cell suspension was incubated for 1 h at 37°C with shaking.
Then 50-150 µl of the transformation mix were plated and incubated over night at 37°C on LB-agar containing the antibiotic necessary for selection of transformed cells.
3.6.6 Isolation of plasmid DNA (mini and midi preparation)
For mini preparation of plasmid DNA a single E.coli colony was picked and cultured with 3 ml LB-selection medium at 37°C over night (250 rpm).
To obtain greater amounts of plasmid DNA 50 µl of this preculture was added to 50 ml LB-selection medium and incubated again at 37°C over night (250 rpm).
Then plasmids were isolated using HiSpeedTM Plasmid Midi Kit (Qiagen, Hilden, Germany) following the supplier’s instruction. Plasmid DNA was eluated with 500 µl sterile H2Odest. and stored at -20°C.
3.7 Molecular cloning
3.7.1 Restriction digestion
The cleavage of DNA by restriction enzymes (Roche, Mannheim, Germany) was performed in a volume of 20 µl with about 0.5 µg plasmid DNA, 5-10 units of corresponding enzyme and 2 µl of the manufacturer’s recommended reaction buffer. After incubation for 1 to 2 hours at the optimal reaction temperature, reaction was stopped by incubating for 15 min at 65°C and products are separated by agarose gel electrophoresis.
Materials and Methods 27
3.7.2 Dephosphorylation of plasmid DNA with alkaline phosphatase
To prevent re-ligation of cohesive ends digested vectors were treated with shrimp alkaline phosphatase (SAP) to remove 5’-phosphate at 37°C for 10 min followed by heat-inactivation of the SAP for 15 min at 65°C.3.7.3 Purification of plasmid DNA by gel extraction
The DNA vector was purified by running on an ethidium bromide containing agarose gel, excising the band containing the fragment under UV illumination and subsequent gel extraction using QIAquick Gel extraction Kit (Qiagen, Hilden, Germany) following the manufacturer’s instructions.
3.7.4 Ligation
In the presence of ATP and Mg2+ ions T4 DNA ligase is able to covalently join blunt or cohesive ends between a 5’-phosphate and a 3’-OH group.
Following reaction mix was incubated for 16 h at 16°C:
2 µl reaction buffer 0.1-0.3 µg target vector 0.3-1.5 µg insert DNA
400 units T4 DNA ligase ad 20 µl H2Odest.
3.7.5 FAT1 shRNA plasmid
Preparation of the plasmid containing FAT1 shRNA was performed according to the protocol “RNAi-based conditional gene knockdown in mice using a U6 promoter driven vector” (Shukla et al. 2007). The selected siRNA sequences (Table 3.1) were inserted twice as a palindrome. The U6 promoter is inactivated by insertion of a loxP flanked Neomycin cassette which can be deleted by Cre recombinase.
Materials and Methods 28
Table 3.1 Oligonucleotides for cloning of the FAT1 shRNA plasmid
oligonucleotide sequence
FAT1_2 sense
5’-GGCAGGACGTGTATGATACTCTAAAGCTTTAGAGTATCATACACGTCC TGCCCTTTTTG-3’
FAT1_2 antisense
5’-TTAAGTTTTTCCCGTCCTGCACATACTATGAGATTTCGAAATCTCATAG TATGTGCAGGAC-3’
FAT1_3 sense
5’-GGCACGTTACTTACCATATTGTAAAGCTTTACAATATGGTAAGTAACGT GCCCTTTTTG-3’
FAT1_3 antisense
5’-TAAGTTTTTCCCGTGCAATGAATGGTATAACATTTCGAAATGTTATACC ATTCATTGCACGG-3’
First, the vector was digested with ApaI restriction enzyme and overhanging ends were filled with Klenow enzyme. Subsequently, linearized vector was additionally digested with EcoRI. The insert containing siRNA sequences was prepared by annealing of both oligonucleotides. Thereby an overhang in form of an EcoRI recognition site was formed and the insert could have been ligated with the digested vector. After transformation and mini preparation of plasmid DNA restriction digestion was performed to verify integration of annealed oligonucleotides.
Vectors containing the shRNA construct were then transformed into Cre- recombinase expressing Escherichia coli (294-Cre) to delete the Neomycin cassette and thereby activate the promoter.
3.8 Human tissues and tissue microarray
Paired HCC and non-neoplastic liver tissues were obtained from HCC patients undergoing surgical resection. Tissue samples were immediately snap-frozen and stored at -80°C until subsequent analysis. A tissue microarray (TMA) of paraffin- embedded HCC samples was constructed as described (Amann et al. 2009b).
Clinicopathological patient characteristics are summarized in Table 4.1.
Experimental procedures were performed according to guidelines of the charitable state controlled foundation HTCR (Human Tissue and Cell Research) with the informed patient’s consent.
Materials and Methods 29
3.9 Cell culture
3.9.1 Cell culture medium
DMEM (high glucose/10%FCS) 4.5 g/l Glucose
300 µg/ml L-Glutamine
supplemented with:
10% (v/v) FCS
400 U/ml Penicillin
50 µg/ml Streptomycin
HSC medium DMEM (high glucose/10% FCS)
supplemented with:
10 µg/ml Fluconazol
4 µg/ml Ciprofloxacin
Freezing medium 5 Vol DMEM (high glucose/10%
FCS)
3 Vol FCS
2 Vol DMSO
3.9.2 Cultivation of cell lines
Cell culture work was always performed within a laminar flow biosafety cabinet (Hera Safe, Heraeus, Osterode, Germany). Cells were cultivated in a Binder series CB incubator (Binder, Tuttlingen, Germany) in 10% CO2 atmosphere at 37°C. For passaging adherent cells were washed with PBS and detached with trypsin (0.05%)/EDTA (0.02%) (PAA Laboratories, Cölbe, Germany) at 37°C. Trypsination was stopped adding DMEM containing 10% FCS. Subsequently, cells were centrifuged at 500 g for 5 min and the obtained cell pellet was resuspended in fresh culture medium and distributed to new cell culture flasks achieving a cell density thinning factor of 5 to 10. Medium was changed every second day. Cell growth and morphology were controlled and documented with a microscope (Olympus CKX41 with ALTRA20 Soft Imaging System, Olympus, Hamburg, Germany). Cell culture waste was autoclaved before disposal with a Sanoclav autoclave (Wolf, Geislingen, Germany).
Materials and Methods 30
3.9.3 Human hepatocellular carcinoma cell lines
HepG2 ATCC HB-8065
PLC ATCC CRL-8024
Hep3B ATCC HB-8064
Cell lines were obtained from the American Type Culture Collection (ATCC).
3.9.4 Cell line of activated human hepatic stellate cells
Activated human hepatic stellate cells have been immortalized by infection with a retrovirus expressing hTERT (human telomerase reverse transcriptase) (Schnabl et al. 2002).
3.9.5 Isolation of primary human hepatocytes
Primary human hepatocytes (PHH) were isolated in cooperation with the Center of Liver Cell Research (Department of Paediatrics and Juvenile Medicine, University of Regensburg, Germany) from human liver resections using a modified two-step EGTA/collagenase perfusion procedure (Hellerbrand et al. 2007; Hellerbrand et al.
2008; Pahernik et al. 1996; Ryan et al. 1993; Weiss et al. 2002). Experimental procedures were performed according to guidelines of the charitable state controlled foundation HTCR (Human Tissue and Cell Research) with the informed patient’s consent.
3.9.6 Isolation of human hepatic stellate cells
Human hepatic stellate cells (HSC) were isolated in cooperation with the Center of Liver Cell Research (Department of Paediatrics and Juvenile Medicine, University of Regensburg, Germany). After perfusion and separation of hepatocytes by an initial centrifugation step at 50 g (5 min, 4°C) the supernatant containing the non- parenchymal cells were centrifuged at 700 g for 7 min (4°C). The obtained cell pellet was resuspended in HSC medium and cells were seeded into T75 flasks.
Within the first week, the medium was replaced daily, from the second week on medium change took place every 2-3 days. Under these conditions only HSC proliferate. Liver sinusoidal endothelial cells (LSEC) die within the first 24h. By cultivation on uncoated plastic HSC activate within the first 2 weeks and transdifferentiate to myofibroblast-like cells. Liver disease mediated HSC activation can be simulated in vitro that way. After 2 weeks the cell culture was
![Figure 2.1 Graphical overview of the different liver cell types and their localization [modified from (Friedman and Arthur 2002)]](https://thumb-eu.123doks.com/thumbv2/1library_info/5648587.1693783/15.892.250.667.109.323/figure-graphical-overview-different-localization-modified-friedman-arthur.webp)