of acute and chronic kidney disease
DISSERTATION ZUR ERLANGUNG DES DOKTORGRADES DER NATURWISSENSCHAFTEN (DR. RER. NAT.)
DER FAKULTÄT FÜR BIOLOGIE UND VORKLINISCHE MEDIZIN DER UNIVERSITÄT REGENSBURG
vorgelegt von
Helena U. Zacharias
aus Regensburg
im Jahr 2016
Die Arbeit wurde angeleitet von:
Prof. Dr. Wolfram Gronwald Unterschrift:
Helena Zacharias
Fig. 4.2, page 39, Fig. 4.3, page 40, Fig. 4.4, page 41, and Fig. 4.6, page 47, have al- ready been published in [Zacharias 2012] and were provided by me.
A section on page 45 has already been published in a slightly altered version in [Zacharias et al. 2013b)]. Claudia Samol wrote the first draft of the manuscript and the published article had been revised by Prof. Dr. Wolfram Gronwald and Prof. Dr. Peter Oefner.
A section on page 49-50 has already been published in a slightly altered version in [Zacharias et al. 2013b)].
Sections on pages 52-53 and 56-58 have already been published in slightly altered versions in [Zacharias et al. 2013b)]. Dipl. Math. Jochen Hochrein wrote the first draft of the manuscript and the published article had been revised by Prof. Dr. Wolfram Gronwald and Prof. Dr. Peter Oefner.
Section 4.3.2, page 61, has already been published in slightly altered versions in [Zacharias et al. 2013b)]. I wrote the first draft of the manuscript and the published article had been revised by Prof. Dr. Wolfram Gronwald and Prof. Dr. Peter Oefner.
Section 5.1.2.1, pages 67-68, has already been published in [Zacharias et al. 2013a)] and [Zacharias et al. 2015] in a slightly altered version. I wrote the first drafts of the manuscripts and the published articles had been revised by Prof. Dr. Wolfram Gronwald and Prof. Dr.
Peter Oefner. Patient handling as well as biofluid collection and assessment of clinical data had been conducted at the University of Erlangen-Nuremberg.
Section 5.1.2.5, page 70-71, has already been published in [Hochrein et al. 2015] in a slightly altered version, and is also part of Dipl. Math. Jochen Hochrein’s Ph.D. thesis [Hochrein 2016]. The reported analyses have been performed by Prof. Dr. Wolfram Gronwald and Clau- dia Samol and the manuscript has been written by Prof. Dr. Wolfram Gronwald.
Sections on pages 71-72 have already been published in a slightly modified version in [Zacharias et al. 2015]. The classification/prognostication concept of nested cross-validation employed here was implemented by Dipl. Math. Jochen Hochrein and is also part of his Ph.D. thesis [Hochrein 2016]. I employed this nested cross-validation and analyzed the corresponding results.
Section 5.1.2.8, page 73, has already been published in [Zacharias et al. 2015] in a slightly modified version. I slightly modified the applied linear SVM cross-validation with optimization of the cost parameter C from a previous R-code of Dipl. Math. Jochen Hochrein.
Section 5.1.2.9, page 73, and section 5.1.3.7, pages 85-86, have already been published in [Zacharias et al. 2015] in slightly altered versions, and the presented concept as well as the corresponding algorithm was developed by Dipl. Math. Jochen Hochrein. It is also part of his Ph.D. thesis [Hochrein 2016]. I performed data analyses and wrote the first draft of [Zacharias et al. 2015] and the published article had been revised by Prof. Dr. Wolfram Gronwald and Prof. Dr. Peter Oefner.
Parts of section 5.1.2.10, pages 74, have already been published in [Zacharias et al. 2015] in a slightly altered version. I performed both method implementation as well as data analyses. I wrote the first draft of the manuscript and the published article had been revised by Prof. Dr.
Wolfram Gronwald and Prof. Dr. Peter Oefner.
normalization method was developed by Dipl. Math. Jochen Hochrein and is also part of his Ph.D. thesis [Hochrein 2016]. I performed data analyses and wrote the first draft of [Zacharias et al. 2015], and the published article had been revised by Prof. Dr. Wolfram Gronwald and Prof. Dr. Peter Oefner.
Section 5.1.3.2, page 76, has already been published in [Zacharias et al. 2013a)] in a slightly altered version. I performed data analyses and wrote the first draft of the manuscript, and the published article had been revised by Prof. Dr. Wolfram Gronwald and Prof. Dr. Peter Oefner.
Parts of section 5.1.3.3, pages 77-80, have already been published in [Zacharias et al. 2015] in a slightly altered version. MS measurements and corresponding data analyses were performed by M.Sc. Franziska Vogl. I performed all measurements and data analyses corresponding to NMR spectroscopy.
Parts of section 5.1.3.4, pages 80-81, section 5.1.3.5, pages 81-82, and section 5.1.3.6, pages 83-84 have already been published in [Zacharias et al. 2015] in slightly altered versions. I performed data analyses and wrote the first draft of the manuscript and the published article had been revised by Prof. Dr. Wolfram Gronwald and Prof. Dr. Peter Oefner. I generated Fig.
5.2, page 84, and Fig. 7.3, page 146, and they were reprinted with permission from [Zacharias et al. 2015]. Copyright 2015 American Chemical Society.
Section 5.1.4, pages 87-89, has already been published in [Zacharias et al. 2015], and [Hochrein et al. 2015] in a slightly altered version. I wrote the first draft of [Zacharias et al. 2015] and the published article had been revised by Prof. Dr. Wolfram Gronwald and Prof. Dr. Peter Oefner.
Appendix II section 7.2.2, page 135, has already been published in [Zacharias et al. 2015]. I wrote the first draft of [Zacharias et al. 2015] and the published article had been revised by Prof. Dr. Wolfram Gronwald and Prof. Dr. Peter Oefner.
Hiermit bedanke ich mich herzlichst bei allen, die mir während dieser Doktrorarbeit mit Rat und Tat zur Seite standen:
Vielen herzlichen Dank an Prof. Dr. Wolfram Gronwald, der mir die Möglichkeit gab, solch in- teressante Projekte während meiner Doktorarbeit zu bearbeiten sowie für seinen fortwährende, freundliche Anleitung.
Prof. Dr. Peter J. Oefner danke ich für die Möglichkeit, meine Doktorarbeit an seinem Institut zu schreiben und für seine konstruktive Anleitung.
Prof. Dr. Kai-Uwe Eckardt, Prof. Dr. Carsten Willam, Dr. Gunnar Schley, und Dr. Stephanie Titze vom Universitätsklinikum Erlangen-Nürnberg danke ich für die fruchtbaren Kollabora- tionen.
Außerdem möchte ich mich bei Prof. Dr. Kai-Uwe Eckardt sowie Prof. Dr. Werner Kremer für ihr Mentoring während meiner Doktorarbeit herzlichst bedanken.
Mein besonderer Dank geht an Dipl. Math. Jochen Hochrein für seine Unterstützung und Un- terweisung im Bezug auf Algorithmenentwicklung sowie für die erfolgreiche Zusammenarbeit.
M.Sc. Franziska Vogl danke ich für ihre Massenspektrometriemessungen, ohne die ich vielleicht immer noch über ein einzelnes NMR-Signal grübeln würde. Herzlichsten Dank geht an Clau- dia Samol für ihre Hilfe im Labor und das Pipettieren wirklich unzähliger Proben. Außerdem möchte ich mich bei Dr. Matthias Klein für seine Anleitung und Hilfe bei der theoretischen und praktischen Arbeit, sowie bei Prof. Dr. Rainer Spang, Dr. Claudio Lottaz und Dr. Guisi Moffa für ihre Beratung in statistischen Fragen bedanken.
Großen Dank möchte ich meinen Bürokollegen Dipl. Math. Jochen Hochrein, M.Sc. Philipp Schwarzfischer, Dr. Matthias Klein, Dr. Claudio Lottaz, Dr. Matthias Maneck, M.Sc. Chris- tian Kohler, Dr. Mohammad Sadeh, Dr. Paula Perez-Rubio, und Dr. Michael Altenbuchinger für die nette Arbeitsatmosphäre aussprechen.
Vor allem jedoch möchte ich mich, neben den bereits oben erwähnten, bei allen weiteren Mit- gliedern des Instituts für funktionelle Genomik für die tolle Zusammenarbeit und Gemeinschaft bedanken: Dr. Martin Almstetter, Dr. Inka Appel, Dr. Nadine Aßmann, M.Sc. Raffaela Berger, Sabine Botzler, Dr. Katja Dettmer-Wilde, Lisa Ellmann, Eva Engl, Dr. Julia En- gelmann, Dr. Mauritz Evers, Corinna Feuchtinger, M.Sc. Franziska Görtler, Dr. Daniela Herold, Dr. Bianca Höfelschweiger, Dr. Christian Hundsrucker, B.Sc. Elena Kremen, B.Sc.
Sebastian Mehrl, Dr. Katharina Meyer, Dipl. Bioinf. Anton Moll, Sandra Nothmann, Nadine Nürnberger, Elke Perthen, Dipl. Math. Martin Pirkl, B.Sc. Sandra Rauh, M.Sc. Thorsten Rehberg, Dr. Joerg Reinders, Dr. Yvonne Reinders, Dipl. Humanbiol. Sophie Schirmer, Dr.
Inga Schlecht, M.Sc. Trixi von Schlippenbach, M.Sc. Johann Simbürger, Dipl. Bioinf. Frank Stämmler, Dr. Nicholas Strieder, Dipl. Bioinf. Franziska Taruttis, Dipl. Biol. Anja Thomas,
Ein besonderer Dank geht an meine Freunde an der Universität Regensburg für den Zusam- menhalt über so viele Jahre.
Ebenso möchte ich meinem Freund Michael für seine Unterstützung und sein Verständnis danken, sowie für die zahlreichen schönen Stunden in Regensburg, München, Hermannsöd, Florenz, Mailand, Brüssel, Antwerpen, Dresden, Venedig und London.
Zuletzt möchte ich meinen Eltern für ihre immerwährende Unterstützung und Liebe danken, ohne die ich wohl nicht so weit gekommen wäre.
1 Abstract 13
2 Zusammenfassung 15
3 Introduction 17
3.1 Motivation: The global burden of kidney disease . . . 17
3.2 Objective: Metabolomics in the context of nephrology . . . 19
4 Background 23 4.1 Introduction to nephrology . . . 23
4.1.1 Renal structure and physiology . . . 23
4.1.2 Clinical diagnostic tools for assessment of renal performance . . . 26
4.1.3 Basic concepts of acute kidney injury after cardiac surgery . . . 28
4.1.4 Basic concepts of chronic kidney disease . . . 32
4.1.5 Clinical study design in nephrology . . . 33
4.2 Fundamentals of nuclear magnetic resonance spectroscopy . . . 36
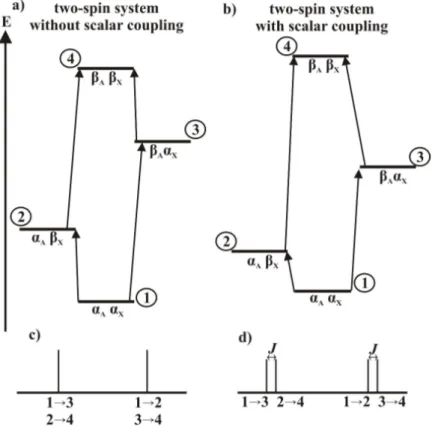
4.2.1 The theory of nuclear magnetic resonance spectroscopy . . . 36
4.2.2 General data acquisition . . . 43
4.3 Data analysis . . . 50
4.3.1 Statistical data analysis . . . 50
4.3.2 Metabolite identification . . . 61
4.3.3 Metabolite quantification . . . 62
5 Biomedical Applications 63 5.1 Acute Kidney Injury study . . . 63
5.1.1 Introduction . . . 63
5.1.2 Materials and Methods . . . 67
5.1.3 Results . . . 74
5.1.4 Discussion . . . 87
5.2 German Chronic Kidney Disease study . . . 90
5.2.1 Introduction . . . 90
5.2.2 Materials and Methods . . . 91
5.2.3 Results . . . 100
5.2.4 Discussion . . . 109
5.3 Trial to Reduce Cardiovascular Events with Aranesp® Therapy study . . . 115
5.3.1 Introduction . . . 115
5.3.2 Materials and Methods . . . 116
5.3.3 Results . . . 117
5.3.4 Discussion . . . 121
6 Conclusion and Perspectives 125 7 Appendix 129 7.1 Appendix I: General R-Code . . . 129
7.1.1 Get familiar with data . . . 129
7.1.2 Choose normalization method . . . 129
7.1.3 Normalization . . . 130
7.1.4 Data analysis . . . 130
7.1.5 NMR bucket alignment and bucket fusion . . . 132
7.2 Appendix II: Acute Kidney Injury study . . . 133
7.2.1 Clinical characteristics and outcome of patients included in AKI study . 133 7.2.2 CPB protocol . . . 135
7.2.3 Spike-In experiments for the quantification of free calcium and magne- sium levels . . . 136
7.2.4 Time-course development . . . 137
7.2.5 Results of permutation tests . . . 138
7.2.6 Discriminative 24 h plasma NMR features . . . 139
7.3 Appendix III: German Chronic Kidney Disease Study . . . 148
7.3.1 Patient characteristics . . . 148
7.3.2 t-tests between various leading renal diseases . . . 151
7.3.3 Prediction of present and future kidney performance . . . 222
7.4 Appendix IV: Trial to Reduce Cardiovascular Events with Aranesp® Therapy study . . . 238
8 About the author 253 8.1 Curriculum Vitae . . . 253
8.2 Publications . . . 253
8.3 Poster Presentations . . . 254
8.4 Conference Talks . . . 254
9 Bibliography 255
1D one-dimensional
2D two-dimensional
ACE angiotensin-converting-enzyme
ACR albumin-creatinine ratio
ADPKD autosomal dominant polycystic kidney disease
AER albumin excretion rate
AKI acute kidney injury
AKIN Acute Kidney Injury Network
AP alkaline phosphatase
ARF acute renal failure
a. u. arbitrary units
AUC area under the curve
B/H Benjamini/Hochberg
BMI body mass index
BSA body surface area
CABG coronary artery bypass grafting
CGA Cause, GFR, and Albuminuria
ChEBI Chemical Entities of Biological Interest
CKD chronic kidney disease
CKD-EPI Chronic Kidney Disease Epidemiology Collaboration CKD-EPI crea CKD-EPI formula based on SCr
CKD-EPI crea cys CKD-EPI formula based on SCr and SCysC CKD-EPI cys CKD-EPI formula based on SCysC
CKD-JAC Chronic Kidney Disease Japan Cohort COPD chronic obstructive pulmonary disease
COSY Correlated Spectroscopy
CPB cardiopulmonary bypass
CPMG Carr-Purcell-Meiboom-Gill
CRIC Chronic Renal Insufficiency Cohort
CRP C-reactive protein
CysC cystatin C
EDTA ethylenediaminetetraacetic acid eGFR estimated glomerular filtration rate
eGFRckdepi crea eGFR based on CKD-EPI crea formula
eGFRckdepi crea cys eGFR based on CKD-EPI crea cys formula
EPO erythropoietin
ESA erythropoiesis-stimulating agent ESI electrospray ionization
ESKD End Stage Kidney Disease ESRD end-stage renal disease FDR false discovery rate FFP fresh frozen plasma FID free induction decay
FU2 second follow-up
GCKD German Chronic Kidney Disease GFR glomerular filtration rate
GGT γ-glutamyltranspeptidase
Hb hemoglobin
HbA1c glycated hemoglobin
HF hemofiltration
HMBC heteronuclear multiple bond correlation HMDB Human Metabolome Database
HPLC high-performing liquid chromatography HSQC heteronuclear single quantum coherence IABP intra-aortic balloon pump
ICU intensive care unit IL-18 interleukin-18
INEPT insensitive nuclei enhanced by polarization transfer KDIGO Kidney Disease: Improving Global Outcomes KIM-1 kidney injury molecule-1
LARS least-angle regression
LASSO least absolute shrinkage and selection operator LC-MS liquid chromatography-mass spectrometry LTB4 leukotriene B4
MAP mean arterial pressure
MDRD Modification of Diet in Renal Disease
MDRD4 four-variable Modification of Diet in Renal Disease
MS mass spectrometry
mse mean-squared error
NAG N-acetyl-β-D-glucosaminidase
NGAL neutrophil-gelatinase-associated lipocalin NMR nuclear magnetic resonance
NOE Nuclear Overhauser Effect
NOESY Nuclear Overhauser Enhancement Spectroscopy NSAID nonsteroidal anti-inflammatory drugs
OPLS-DA orthogonal projection to latent structures discriminant analysis
PCA principal component analysis
PLS-DA Partial Least Squares Discriminant Analysis
RCC red cell concentrate
rf radio frequency
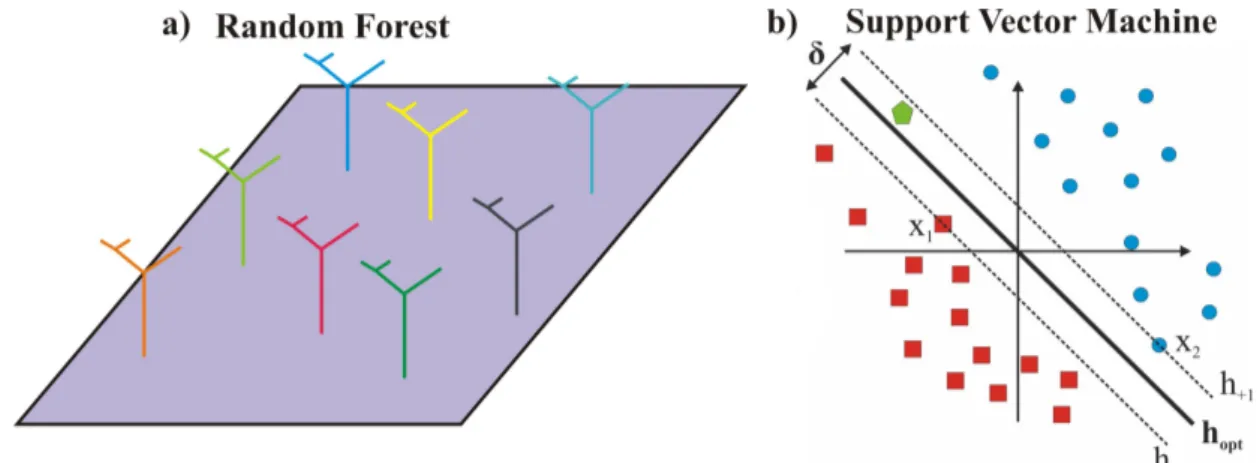
RF Random Forests
RIFLE Risk Injury Failure Loss End-Stage Renal Disease ROC receiver operating characteristic
RRT renal replacement therapies
RSS residual sum of squares
SCr serum creatinine
SCysC serum cystatin C
SVM Support Vector Machine
TMS tetramethylsilan
TOCSY Total Correlation Spectroscopy TOFMS time-of-flight mass spectrometry
TSP 3-trimethylsilyl-2,2,3,3-tetradeuteropropionate
TREAT Trial to Reduce Cardiovascular Events with Aranesp® Therapy
UO urine output
UPLC/QTOFMS ultra-performance reversed-phase liquid chromatography coupled to a quadrupole time-of-flight mass spectrometer
VSN Variance Stabilization normalization
The global burden of human renal diseases continually increased in the last decades. To lower associated mortality and morbidity rates, early diagnosis as well as improved understanding of underlying biological mechanisms are essential. Here, metabolic investigations of biofluids by means of nuclear magnetic resonance (NMR) spectroscopy in the context of nephrology are presented to facilitate earlier detection and to enable new insights into renal disease manifes- tation.
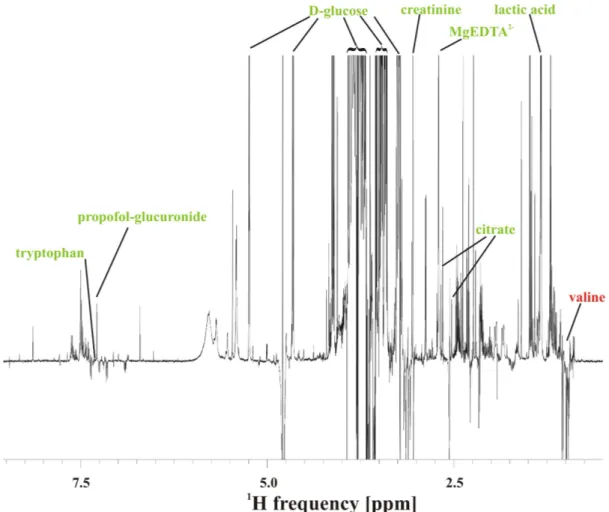
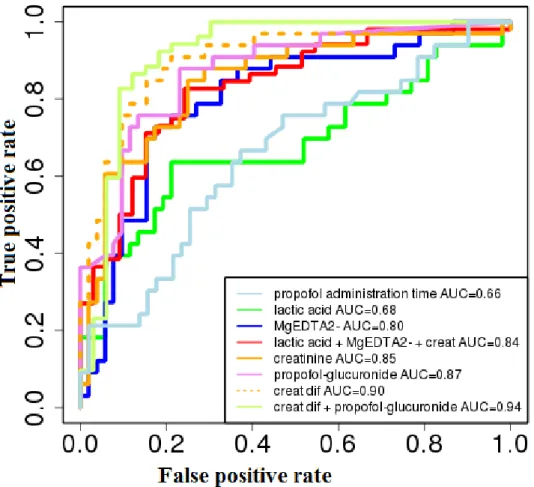
The detection of novel low-molecular-weight factors for improved early diagnosis and patient treatment in the context of acute kidney injury (AKI) was successfully conducted in a prospec- tive study of 85 adult patients undergoing cardiac surgery with cardiopulmonary bypass (CPB) use. One-dimensional (1D) 1H NMR spectral data sets of filtered ethylenediaminetetraacetic acid (EDTA) plasma specimens collected 24 h after surgery were subjected to Random Forests based classification witht-test based feature filtering to prognosticate AKI. An average overall prognostication accuracy of 80± 0.9% with a corresponding area under the receiver-operating characteristic curve of 0.87 ± 0.01 could be obtained with, on average, 24 ± 2.8 spectral fea- tures. The set of discriminative ions and molecules included Mg2+, lactate and the glucuronide conjugate of propofol, an anesthetic agent which had been administered to all patients during surgery. In AKI patients, increased levels of propofol-glucuronide seem to be a surrogate marker for reduced glomerular filtration, whereas an elevation of Mg2+ levels might be explained by its use for the treatment of cardiac arrythmias, and ischemic injury as well as systemic hy- poperfusion present in this group might be linked to elevated lactate levels. Furthermore, this thesis presents a novel endogenous biomarker panel consisting of absolutely quantified EDTA plasma concentrations of Mg2+, creatinine, and lactate, which would offer a reliable and swift diagnostic tool for the early detection of AKI after cardiac surgery with CPB use only requiring easily implementable point-of-care technologies. This biomarker panel was further employed to derive a novel Acute Kidney Injury Network (AKIN) index score, which illustrated that the metabolic profile of patients diagnosed with mildest renal injury was very similar to that of patients not developing AKI.
This study was further utilized to elucidate the importance of appropriate data normalization prior to statistical analysis, which proofed to be crucial for correct data interpretation.
The second part of this thesis presents first statistical data analysis results of 1D 1H NMR spectra of EDTA plasma or urine specimens, respectively, from two large-scale clinical trials on chronic kidney disease (CKD). The German Chronic Kidney Disease (GCKD) study in- cludes the currently world-wide largest cohort of patients suffering from CKD, which will be prospectively followed in the next ten years, and the Trial to Reduce Cardiovascular Events with Aranesp® Therapy (TREAT) study comprises a large, homogeneous cohort of patients suffering from CKD, type-2 diabetes mellitus, and concomitant anemia. Distinct differences
in metabolic fingerprints between various leading renal diseases, such as diabetic nephropathy and glomerulonephritis, in the GCKD study, or associated with adverse patient outcome in the TREAT study could be detected byt-tests in concordance with standard clinical pathologies of CKD. Additionally, the prediction of future kidney performance, which is crucial for improved patient care, with regression models based on either NMR derived EDTA plasma metabolic fingerprints or clinical parameters both assessed two years before was conducted within the GCKD study. Here, multiple regression models based on NMR fingerprints did not outper- form simple regression models based on respective baseline clinical parameters. This probably reflects the fact that the renal function of most investigated CKD patients was fairly stable within these two years.
Innerhalb der letzten Jahrzehnte nahm die globale Belastung aufgrund von Nierenerkrankun- gen im Menschen kontinuierlich zu. Um damit verbundene Sterblichkeits- und Morbiditätsraten zu verringern, sind frühe Diagnose sowie verbesserte Einsichten in zugrundeliegende biologis- che Mechanismen entscheidend. Diese Doktorarbeit präsentiert metabolische Untersuchungen von Körperflüssigkeiten mittels der Kernspinresonanzspektroskopie innerhalb der Nephrologie, um frühere Detektion sowie neue Erkenntnisse bezüglich klinischer Manifestation der Nieren- erkrankung zu ermöglichen.
Der Nachweis neuer Komponenten mit niedrigem Molekulargewicht zur verbesserten Früherken- nung und Patientenbehandlung im Kontext akuten Nierenversagens (AKI) wurde erfolgreich in einer prospektiven Studie mit 85 erwachsenen Patienten, die sich einer Herzoperationen mit Ver- wendung der Herz-Lungen-Maschine unterzogen hatten, durchgeführt. Eindimensionale (1D)
1H Kernspinresonanzspektren gefilterter Ethylendiamintetraacetat (EDTA) Plasmaproben, die 24 Stunden nach der Operation abgenommen worden waren, wurden mittels Random Forests inklusive t-Test basierender Featureauswahl klassifiziert, um AKI zu prognostizieren. Bezogen auf die Gesamtkohorte, konnten mit Hilfe von, im Durchschnitt, 24 ± 2.8 spektraler Features, im Mittel 80 ± 0.9 % der Patienten richtig klassifiziert werden, was einer Fläche unter der Beobachterkennlinie von 0.87 ± 0.01 entspricht. Mg2+, Laktat, und das Glucuronid-Konjugat des Propofols, das allen Patienten während der Operation als Anästhetikum verabreicht worden war, befanden sich unter den diskriminierenden Ionen und Molekülen. In AKI Patienten scheint ein erhöhter Propofol-Glukuronid-Spiegel ein surrogater Marker für reduzierte glomeruläre Fil- tration zu sein, wobei ein erhöhter Mg2+ Spiegel durch die Administration von Magnesium zur Behandlung von Herzrythmusstörungen erklärt werden könnte, und Ischämie sowie sys- temische Hypoperfusion in dieser Patientengruppe mit erhöhten Laktatspiegeln in Verbindung gebracht werden könnten. Außerdem präsentiert diese Doktorarbeit ein neues Set an endoge- nen Biomarkern bestehend aus absoluten EDTA Plasmakonzentrationen von Mg2+, Kreatinin und Laktat, welches ein zuverlässiges und schnelles Diagnosewerkzeug zur AKI Früherkennung nach Herzoperationen mit Herz-Lungen-Maschine darstellen könnte. Des weiteren wurde dieses Biomarker-Set zur Ableitung eines neuen Acute Kidney Injury Network (AKIN) Scores benutzt, der die Tatsache illustrierte, dass Patienten mit geringster Nierenschädigung ein metabolisches Profil aufweisen, das sich nur gering vom metabolischen Profil von Patienten ohne AKI unter- scheidet.
Zusätzlich wurde diese Studie dazu genutzt um die Bedeutung angemessener Datennormal- isierung im Vorfeld von statistischen Analysen zu illustrieren, was sich als ausschlaggebend zur korrekten Dateninterpretation erwies.
Der zweite Teil dieser Doktorarbeit präsentiert erste statistische Datenauswertungen von 1D
1H Kernspinresonanzspektren von EDTA Plasma- beziehungsweise Urinproben zweier großan-
gelegter klinischer Studien über chronisches Nierenversagen (CKD). Die German Chronic Kid- ney Disease (GCKD) Studie umfasst die derzeit weltweit größte Kohorte an Patienten mit CKD, die prospektiv über die nächsten zehn Jahre verfolgt wird, und die Trial to Reduce Cardiovascular Events with Aranesp® Therapy (TREAT) Studie schließt eine große, homo- gene Kohorte an Patienten mit CKD, Typ-2 Diabetes Mellitus, und begleitender Anämie ein.
Ausgeprägte Unterschiede in metabolischen "Fingerprints" konnten mittels t-Tests zwischen verschiedenen führenden Nierenerkrankungen, z.B. diabetische Nephropathie und Glomeru- lonephritis, in der GCKD Studie, oder in Verbindung mit widrigem Krankheitsausgang in der TREAT Studie nachgewiesen werden. Diese unterschiedlichen metabolischen "Fingerprints"
stimmen mit klinischen Standard-Pathogenesen chronischen Nierenversagens überein. Außer- dem wurde im Rahmen der GCKD Studie die Vorhersage zukünftigen Nierenversagens, was ausschlaggebend für eine verbesserte Patientenversorgung ist, mit Regressionsmodellen en- tweder basierend auf metabolischen "Fingerprints" der Kernspinresonanzspektren der EDTA Plasmaproben oder basierend auf klinischen Parametern durchgeführt, wobei sowohl EDTA Plasmaproben als auch klinische Parameter zwei Jahre zuvor erhoben worden waren. Hier- bei erzielten multiple Regressionsmodelle basierend auf Kernspinresonanz-"Fingerprints" keine besseren Ergebnisse im Vergleich zu einfachen Regressionsmodellen basierend auf entsprechen- den klinischen Baseline-Parametern. Möglicherweise reflektiert dies die Tatsache, dass die Nierenfunktion der meisten untersuchten CKD Patienten innerhalb dieser zwei Jahre eher stabil war.
3.1 Motivation: The global burden of kidney disease
The kidney is one of the vital organs in the human body due to its regulatory functions [Dörner 2013]. Maintenance of the homeostatic condition of the body is one of its main tasks [Treuting and Kowalewska 2012,Arastéh et al. 2009].
Consequently, the study and cure of kidney diseases, the primary aspect of nephrology, are of great importance for decreasing mortality and morbidity rates across the globe [O’Toole and Sedor 2014, Eckardt et al. 2013]. In the process, a large range of different illnesses is covered, mostly revealing an either acute (≤3 months) or chronic (>3 months) deterioration of the kid- ney’s performance [Eckardt et al. 2013,Kuhlmann et al. 2003].
Acute kidney injury (AKI), which is characterized by an abrupt (within one week) reduc- tion in renal function [Eckardt et al. 2013, Mehta et al. 2007], is a subgroup of acute kidney diseases [Eckardt et al. 2013]. It comprises the whole spectrum of acute renal failure (ARF), caused by various factors including nephrotoxic drugs and complicated surgeries [Mehta et al.
2007]. The incidence of AKI constantly increased in the last decade due to, for example, aug- mented risk factors as well as improved diagnosis and documentation of the disease [Siew and Davenport 2015,Lameire et al. 2013].
AKI is a significant complication after cardiac surgery, leading to an increased risk of mor- tality and morbidity [Chawla et al. 2014, Eckardt et al. 2013, Mariscalco et al. 2011, Rosner and Okusa 2006]. Its occurrence in patients undergoing cardiac surgery approaches 30% with about 1 - 6% requiring dialysis [Mariscalco et al. 2011, Rosner and Okusa 2006]. For AKI patients requiring dialysis, the mortality rate amounts to 54% [Mariscalco et al. 2011]. More- over, already a small decrease of renal function indicated by a reduction of the postoperative glomerular filtration rate (GFR) of equal or more than 30% is associated with a 5.9% mortality rate [Mariscalco et al. 2011]. A GFR decline of less than 30% is still associated with a mortality rate of 0.4% [Mariscalco et al. 2011]. Furthermore, a link between AKI and increased risk of long-term mortality has been reported [Hobson et al. 2009, Engoren et al. 2014]. Hence, AKI after cardiac surgery leads to increases in cost of care and length of stay in the intensive care unit (ICU) [Mariscalco et al. 2011]. The demand for early diagnosis of AKI is consequently eminent for improved patient care [Wyckoff and Augoustides 2012,Shaw 2012,Mariscalco et al.
2011].
The most common classification and staging scheme, the KDIGO (Kidney Disease: Improv- ing Global Outcomes) criteria, make use of increases in serum creatinine (SCr) levels and decreases in GFR and urine output (UO) for diagnosis of AKI [KDIGO workgroup 2012]. Nev-
ertheless, SCr is not the ideal biomarker for AKI due to its relatively late alteration following surgery [Shaw 2012] and its modulation by nonrenal factors [Macedo and Mehta 2013,Wyckoff and Augoustides 2012,Star 1998]. Consequently, the search for alternative biomarkers is an im- portant field in nephrology [Mariscalco et al. 2011,Parikh et al. 2011,Endre et al. 2011,Haase et al. 2010a),Haase et al. 2010b),Haase et al. 2009].
To date, none of the novel biomarkers reported for the diagnosis of AKI after cardiac surgery, e.g.
neutrophil-gelatinase-associated lipocalin (NGAL) and serum cystatin C (CysC), has proven to be sufficiently predictive in heterogeneous patient cohorts with comorbidities [Endre et al.
2011, Lameire et al. 2011]. Moreover, in a clinically relevant setting, these biomarkers do not seem to clearly add any new information to the traditional approach [Lameire et al. 2011], still leaving the desire for improved diagnosis unsatisfied.
AKI is tightly connected to chronic kidney disease (CKD), with CKD being the most im- portant risk factor for common AKI [Chawla et al. 2014,Lameire et al. 2013]. Moreover, even mild cases of AKI are associated with new-onset as well as progression to advanced stages of CKD [Chawla et al. 2014,Jha et al. 2013,Eckardt et al. 2013,Lameire et al. 2013].
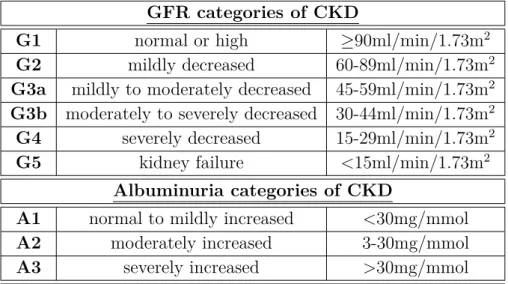
CKD imposes an even larger burden on the world’s health system [Jha et al. 2013], with global occurrence exceeding 10% [O’Toole and Sedor 2014, Eckardt et al. 2013] and 50% in high-risk subpopulations [Eckardt et al. 2013]. Its incidence is strongly linked to increasing age, with more than 20% of the population older than 60 years and more than 35% older than 70 years at the time of diagnosis of CKD [Eckardt et al. 2013]. In general, CKD is associated with a reduced GFR and increased albuminuria, irrespective of the cause of diminished renal function [Eckardt et al. 2013]. Along its progression, CKD leads to a large number of adverse clinical symptoms, finally ending in complete renal failure, called end-stage renal disease (ESRD) [Kuhlmann et al. 2003]. It is linked to elevated all-cause and cardiovascular mortality, AKI, cognitive decline, anemia (hemoglobin (Hb) deficiency), mineral and bone disorders, and fractures [Jha et al.
2013,KDIGO workgroup 2013,Eckardt et al. 2012,Kuhlmann et al. 2003]. Actually, CKD was ranked 18th in the list of causes of total number of worldwide deaths in 2010 [Jha et al. 2013].
It is also a comorbidity of numerous chronical illnesses, e.g. cardiovascular disease, hyperten- sion, obesity, and diabetes [Chawla et al. 2014, O’Toole and Sedor 2014, Eckardt et al. 2013], further worsening patient’s prognosis [Eckardt et al. 2013]. In fact, type-2 diabetes mellitus is the leading cause of ESRD in developed countries [Jha et al. 2013, Kuhlmann et al. 2003].
Moreover, the presence of anemia in patients with type-2 diabetes mellitus and CKD further increases the rates of cardiovascular and renal events [Pfeffer et al. 2009a)].
With regard to the demanding adverse outcomes of CKD, the need for early detection is of prime interest [Eckardt et al. 2013,Jha et al. 2013]. In general, the underlying mechanisms as well as the pathophysiological and clinical consequences of CKD are still poorly understood [Eckardt et al. 2012]. Moreover, due to the overall heterogenity of CKD ethiology and pathomechanism, an urging demand for clinical studies in specific subpopulations is given [O’Toole and Sedor 2014,Eckardt et al. 2013].
The German Chronic Kidney Disease (GCKD) study was designed as a national prospective ob- servational cohort study, involving study centers throughout Germany [Eckardt et al. 2012]. It comprises about 5000 CKD patients with a moderately reduced GFR and/or overt proteinuria
at enrollment, receiving comparable medical care [Eckardt et al. 2012]. The major goals are the characterization of burden and course of CKD patients, the identification and validation of novel risk factors and biomarkers for CKD manifestation, progression and complications as well as the achievement of an advanced understanding of the underlying pathophysiology [Eckardt et al. 2012]. Study participants are seen annually for up to ten years [Eckardt et al. 2012] and biomaterial, including urine, serum, and plasma specimens, is collected for every other year.
The large size of the GCKD study cohort, which is well-characterized, and the long observation period facilitate the investigation of various hypotheses in a statistically meaningful manner.
In contrast to the GCKD study, the Trial to Reduce Cardiovascular Events with Aranesp® Therapy (TREAT) study was a randomized, multicenter, double-blind placebo-controlled, clin- ical trial [Pfeffer et al. 2009a), Pfeffer et al. 2009b)]. It comprised about 4000 patients with CKD, type-2 diabetes mellitus and anemia, which develops in most CKD patients as the dis- eased kidneys produce increasingly less erythropoietin (EPO) [Rao and Pereira 2003], and was designed to test whether the administration of darbepoetin alfa, an erythropoiesis-stimulating agent (ESA), would reduce the rates of death, cardiovascular events and ESRD [Pfeffer et al.
2009a), Pfeffer et al. 2009b)]. The large size and homogeneity of this cohort offer excellent opportunities to detect novel biomarkers associated with adverse outcomes as well as to gain novel insights into course of renal disease progression and complications in this specific patient group.
3.2 Objective: Metabolomics in the context of nephrology
Systems biology studies the behavior and development of a specific biological system under the influence of a particular perturbation [Ideker et al. 2001]. High-throughput and high- dimensional data sets are evaluated employing computational bioinformatic methods [Ideker et al. 2001]. Associated disciplines, the so-called ‘omics’-sciences, comprise, among others, genomics, transcriptomics, proteomics, and metabolomics [Joyce and Palsson 2006].
The principal aim of metabolomics is the study of all small organic compounds, denoted as metabolites, present in a biological specimen [Tzoulaki et al. 2014,Kosmides et al. 2013,Nichol- son and Lindon 2008,Nicholson 2006]. Their flow through bioenergetic and biosynthetic path- ways is investigated in a quantitative manner [Tzoulaki et al. 2014]. Hence, the metabolome comprises the whole range of metabolites present or produced by a biological system, e.g. an organism at a defined time-point under a given set of conditions [Tzoulaki et al. 2014,Kosmides et al. 2013].
The application of metabolomics in the context of nephrology seems to be highly suitable.
The kidneys’ major functions comprise the excretion and also tubular secretion of metabolic waste products from the blood into the urine as well as reabsorption of essential nutritive substances [Treuting and Kowalewska 2012, Arastéh et al. 2009]. Consequently, metabolic in- vestigations of urine, serum, and plasma specimens are predestined to facilitate new insights into pathomechanism and detection of novel biomarkers of renal diseases [Zhang et al. 2014, Weiss et al. 2011]. Moreover, changes in the metabolome due to an alteration of the renal function should be more significant and more detectable than elaborate changes in the renal proteome
or transcriptome [Wishart 2008].
Major analytical methods used in the field of metabolomics are nuclear magnetic resonance (NMR) spectroscopy and mass spectrometry (MS) [Tzoulaki et al. 2014]. Thereby, both meth- ods facilitate the simultaneous detection as well as absolute quantification of a large range of metabolites in a specimen [Nicholson and Lindon 2008]. Hence, in comparison to the traditional, targeted approach, usually conducted in clinical studies, an untargeted approach is facilitated by measuring a so-called ‘metabolic fingerprint’ of the investigated specimen [Tzoulaki et al. 2014].
However, the complexity of the metabolism itself and the investigated ‘metabolic fingerprint’
of the sample require sophisticated bioinformatic strategies for data interpretation [Nicholson and Lindon 2008].
NMR spectroscopy, in comparison to MS spectrometry, is non-destructive, highly repeatable and requires minimum sample preparation [Tzoulaki et al. 2014, Nicholson and Lindon 2008], hence being especially well suited for the analysis of large biomaterial collections comprising several hundred to thousands of specimens. On the downside, it offers lower sensitivity as well as lower spectral resolution in comparison to MS [Tzoulaki et al. 2014,Weiss et al. 2011,Nichol- son and Lindon 2008].
Biomedical studies in the field of metabolomics usually investigate biofluids, e.g. urine and blood, which are easily obtained [Tzoulaki et al. 2014]. Their clinical objectives are diverse, including detection of novel diagnostic biomarkers and determination of distinct metabolic pro- files for specific clinical conditions (‘metabolic fingerprinting’) [Kosmides et al. 2013, Dettmer and Hammock 2004]. Consequently, they can facilitate improved or individualized patient treatment, the goal of personalized medicine [Weiss et al. 2011]. Several metabolic studies already proved the capability of NMR spectroscopy for detection of novel disease biomarkers in such diverse areas as, e.g. autosomal dominant polycystic kidney disease (ADPKD) [Gronwald et al. 2011], diary cow metabolism [Klein et al. 2012, Bertram et al. 2011, Klein et al. 2010], as well as various metabolic and renal diseases [Elliott et al. 2015,Dawiskiba et al. 2014, Deja et al. 2013,Neild et al. 1997,Holmes et al. 1997].
With regard to the diverse research questions, still pending in the field of nephrology, as de- picted in section 3.1, I have formulated three specific aims concerning metabolic investigations of renal diseases by means of NMR spectroscopy for this thesis. This analytical method was selected due to its especially high suitability for the comprehensive analysis of large specimen collections as it is required here.
My first aim is the detection of metabolic biomarkers in the context of various renal diseases as alternatives to traditional clinical approaches. My second aim comprises the prediction of future kidney performance based on baseline metabolic fingerprints derived by NMR spec- troscopy. General method developments and additions for NMR based metabolomics with regard to appropriate data normalization, absolute low-molecular-weight compound quantifi- cation, and NMR measurements of unfiltered plasma specimens are the third aim of my Ph.D.
thesis.
The first aim of this Ph.D. thesis is the detection of metabolic biomarkers for both acute and chronic kidney diseases as alternatives to traditional clinical approaches.
In the setting of AKI diagnosis after cardiac surgery, the search and evaluation of earlier or alternative biomarkers is pursued by NMR spectroscopic fingerprinting of urine and plasma specimens collected from a heterogeneous group of AKI and non-AKI patients. Here, the de- tection of AKI after cardiac surgery by means of urinary biomarkers collected before, at 4 and 24 h after surgery as well as by means of plasma biomarkers collected 24 h after surgery is pursued. Furthermore, the performance of different plasma biomarker sets is evaluated and compared to each other as well as to traditional diagnostic tools. These novel metabolic mark- ers could offer the chance of an earlier AKI detection after cardiac surgery than by monitoring changes in SCr levels or UO.
Furthermore, several thousand different plasma specimens collected at the baseline time-point of the GCKD study are measured by means of NMR spectroscopy and specific metabolic fin- gerprints for the discrimination of different leading renal diseases are searched and evaluated.
These investigations can provide new insights into the metabolic characteristics of specific renal diseases such as vascular or glomerulonephritis.
For the generation of new insights into CKD progression and corresponding Hb responsiveness, novel biomarkers for several different clinical outcomes are scanned and appraised. About 1100 different urine specimens collected from TREAT study participants are measured by NMR spectroscopy and the following hypotheses are tested: (1) no difference exists between patients dying from any cause, and patients not dying, under the restriction that all patients within both subcohorts do not progress to ESRD, (2) no difference exists between patients progressing and not progressing to ESRD under the restriction that all patients within both subcohorts do not die and (3) no difference exists between patients with various stages of Hb responsiveness at two different time-points, respectively, whereas four different subcohorts treated with darbe- poetin alfa with various stages of Hb responsiveness and one subcohort treated with a placebo compound are investigated.
The second aim, the prediction of future kidney performance based on baseline metabolic fingerprints derived by NMR spectroscopy was conducted in order to give further insights into kidney disease development and progression.
The correlation of NMR metabolic fingerprints derived from the baseline plasma specimen co- hort of the GCKD study with the estimated GFR and specific renal performance markers, such as SCr and serum CysC, as well as their associated predictive performance are investigated.
Here, multiple regression analyses between baseline NMR metabolic fingerprints and these clin- ical parameters, determined at the baseline as well as at the second follow-up time-point two years after inclusion into the study, were performed. Moreover, simple linear regression with baseline clinical parameters, i.e. SCr, serum CysC, as well as eGFR, with respect to second follow-up clinical parameters, i.e. SCr, serum CysC, as well as eGFR, respectively, were con- ducted. The prediction of present and future kidney performance based on these measures will be of great importance for timely interventions and improved patient care in this patient cohort.
My third aim covers method developments and improvements for NMR based metabo- lomics.
Proper NMR data normalization is crucial for correct interpretation of metabolomic investiga- tions. However, common normalization techniques, such as Quantile or Variance Stabilization
normalization, can lead to erroneous results if different investigated cohorts do not exhibit ap- proximately equal shares of up- and down-regulated features. This thesis reports a prominent case of inappropriate NMR data normalization and provides, as well as evaluates alternative normalization methods.
The absolute quantification of the metal ions calcium and magnesium in plasma specimens by NMR spectroscopy is an addition to NMR based metabolomic methods. Here, their absolute quantification via ethylenediaminetetraacetic acid (EDTA) complexes is implemented and val- idated for the AKI plasma data set.
Moreover, the acquisition of 1D1H NMR spectra of unfiltered EDTA plasma specimens implies several challenges with regard to the traditional NMR reference substance 3-trimethylsilyl- 2,2,3,3-tetradeuteropropionate (TSP). These challenges are reported and easily implementable solutions are presented in the context of the GCKD study.
This Ph.D. thesis has in parts already been published in [Zacharias 2012, Zacharias et al.
2013a), Zacharias et al. 2013b), Zacharias et al. 2015, Hochrein et al. 2015] and was funded by the Bavarian Genome Network (BayGene), the German Federal Ministry of Education and Research (BMBF Grant no. 01 ER 0821), the German Research Foundation (KFO 262), and the intramural funding program of the Regensburg School of Medicine.
4.1 Introduction to nephrology
4.1.1 Renal structure and physiology
The human kidneys are the most important organs for maintaining the homeostatic balance in the body [Eckardt et al. 2013, Dörner 2013]. They are bean-shaped organs, located in the retroperitoneum [Arastéh et al. 2009].
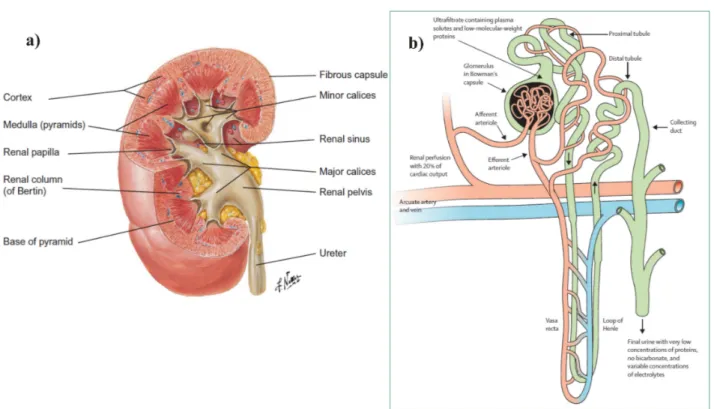
The kidney’s principal anatomy is depicted in Figure 4.1a). It is surrounded by a thin fibrous capsule and the renal parenchyma can be subdivided into the cortex and the medulla [Treuting and Kowalewska 2012, Arastéh et al. 2009]. The medulla itself consists of so-called pyramids, which form a broad base towards the cortex and a cone end, denoted as papilla, extending into the sinus [Treuting and Kowalewska 2012, Arastéh et al. 2009]. The spaces between the pyramids are filled by cortex tissue and are termed renal columns (of Bertin) [Treuting and Kowalewska 2012, Arastéh et al. 2009]. Each of the papillae ends in a minor calyx, whereas two to three of the minor calyces unite to form one major calyx [Treuting and Kowalewska 2012, Arastéh et al. 2009]. The major calices themselves are discharged into the renal pelvis, located at the renal sinus [Treuting and Kowalewska 2012, Arastéh et al. 2009]. The formed urine is conducted from the renal pelvis via the ureter to the bladder [Treuting and Kowalewska 2012, Arastéh et al. 2009]. The kidney’s blood supply is managed by the renal artery, the fil- tered blood is removed by the renal vein [Treuting and Kowalewska 2012,Arastéh et al. 2009].
The structure of the basic functional unit of the kidney, the nephron [Eckardt et al. 2013,Tre- uting and Kowalewska 2012, Arastéh et al. 2009], is given in Figure 4.1b). A single kidney comprises about one million nephrons. Every nephron can be further subdivided into a fil- trating body, the glomerulus, and different tubule segments [Eckardt et al. 2013,Treuting and Kowalewska 2012,Arastéh et al. 2009], compare to Fig. 4.1b). The glomeruli are only located in the renal cortex, whereas the tubuli can additionally be found in the medulla [Treuting and Kowalewska 2012,Arastéh et al. 2009]. In the glomerulus, which is imbedded into the Bowman’s capsule, incoming blood transported by the afferent arteriole, a branch from the arcuate artery, is ultrafiltrated to form the so-called primary urine or ultrafiltrate [Eckardt et al. 2013,Arastéh et al. 2009]. About 180-200 l of ultrafiltrate are generated daily, usually containing sodium, potassium, chloride, phosphate, water, glucose, amino acids, urea and proteins with a mass below 60-70 kDa [Eckardt et al. 2013, Arastéh et al. 2009]. The ultrafiltrate is released from the Bowman’s capsule into the proximal tubule, whereas the filtered blood is discharged by the efferent arteriole [Eckardt et al. 2013, Arastéh et al. 2009]. During the ultrafiltrate’s propaga- tion along the proximal tubule, about 80% of the fluid is being reabsorbed into the peritubular capillaries, including about two-thirds of filtered water and salt, 100% of filtered glucose and
amino acids, as well as proteins [Eckardt et al. 2013, Arastéh et al. 2009]. At the end of the proximal tubule, organic molecules and drug metabolites are secreted into the filtrate [Eckardt et al. 2013]. The loop of Henle, subdivided into the descending and ascending limb, is respon- sible for concentrating the filtrate [Eckardt et al. 2013]. The associated mechanisms, namely reabsorption of water and removal of sodium from the filtrate, take place in the descending and ascending limb, respectively [Eckardt et al. 2013, Arastéh et al. 2009]. The tubular NaCl concentration is monitored at the junction between the ascending limb of the loop of Henle and the distal nephron, the macula densa [Eckardt et al. 2013, Arastéh et al. 2009]. Thereby, the glomerular blood flow is tightly autoregulated by the so called tubuloglomerular feedback mechanism [Eckardt et al. 2013,Arastéh et al. 2009]. The distal nephron, comprising the distal tubule and the collecting duct at the renal papilla, reabsorbs approximately 5% of the total amount of filtered sodium and responds to the hormons aldosterone and vasopressin, hence controlling the composition and concentration of the final urine [Eckardt et al. 2013, Treuting and Kowalewska 2012,Arastéh et al. 2009].
The main functions of the human kidney can be summarized as follows. The secretion of metabolic waste products from the blood into the urine with the possibility of an effective reabsorption mechanism enables the elimination of potentially toxic products without loosing vital nutrients [Treuting and Kowalewska 2012, Arastéh et al. 2009]. Its central role in home- ostasis is furthermore reflected by the regulation of the acid-base and osmolality balance as well as the blood pressure [Treuting and Kowalewska 2012, Arastéh et al. 2009]. Finally, the human kidney produces important hormones like renin, calcitriol, the activated form of vita- min D, and EPO, which stimulates the production of red blood cells [Treuting and Kowalewska 2012,Arastéh et al. 2009].
Figure 4.1: a) Principal anatomy of the human right kidney. b) Structure of a nephron, the basic functional unit of the kidney. a) The human kidney is surrounded by a fibrous capsule and can be further divided into the cortex and the medulla, comprising the pyramids. Their tips, the papillae, point towards the minor calices. The minor calices join in order to form the major calices, which end into the renal pelvis at the renal sinus. The renal pelvis is connected to the ureter.
The cortex fills up the space between the pyramids, which is called the renal column (of Bertin) [Treuting and Kowalewska 2012, Arastéh et al. 2009]. Reprinted with permission from [Treuting and Kowalewska 2012]. b) Blood plasma, supplied by the afferent arteriole, a branch of the arcuate artery, is filtered by the glomerulus in the Bowman’s capsule. The ultrafiltrate is modified along its propagation through the proximal tubule, the loop of Henle and the distal tubule until it is secreted into the collecting duct, where a final adjustment of the urine takes place [Eckardt et al.
2013,Arastéh et al. 2009]. Reprinted with permission from [Eckardt et al. 2013].
4.1.2 Clinical diagnostic tools for assessment of renal performance
With the human kidney executing essential tasks for maintaining body’s homeostasis, compare to section 4.1.1, a deterioration of its performance can have hazardous consequences, as depicted in section 3.1. Therefore, monitoring renal function is vital for detection and supervision of all renal complications. As the filtration of blood and the formation of urine is strongly regulated by the kidney (compare to section 4.1.1), the study of their composition is predestined to offer comprehensive insights into renal performance.
In clinical practice, the most commonly used diagnostic methods for the detection of kidney malfunctions are based on alterations of the following parameters.
The glomerular filtration rate (GFR) is considered to be the best indicative reference for renal performance [KDIGO workgroup 2013,Stevens and Levey 2009,Stevens et al. 2006]. However, its exact determination by measuring the urinary or plasma clearance of exogenous filtration markers, e.g. inulin or EDTA, is considered to be too cumbersome and expensive for routine ap- plication [KDIGO workgroup 2013, Macedo and Mehta 2013, Stevens and Levey 2009, Stevens et al. 2006]. Therefore, the GFR is usually estimated from levels of endogenous filtration markers such as SCr, and consequently denoted as estimated GFR (eGFR) [KDIGO work- group 2013, Cravedi and Remuzzi 2013, Jha et al. 2013, Stevens and Levey 2009]. An ideal filtration marker would be a substance that is freely filtered at the glomeruli, neither reab- sorbed, secreted, synthesized, or metabolized by the tubuli, and that does not change renal function [Stevens and Levey 2009]. Various equations can be employed for the determination of eGFR, e.g. the Modification of Diet in Renal Disease (MDRD) Study or the Chronic Kidney Disease Epidemiology Collaboration (CKD-EPI) equation [KDIGO workgroup 2013, Cravedi and Remuzzi 2013, Jha et al. 2013, Stevens and Levey 2009]. However, these equations still perform poorly in comparison to direct measurement of the GFR in various critically ill patient cohorts [Bragadottir et al. 2013,Cravedi and Remuzzi 2013].
In general, SCr is well suited as an endogenous filtration marker, as it is almost completely removed from the blood by glomerular filtration and proximal tubular secretion, compare to sec- tion 4.1.1, and only marginally reabsorbed, e.g. in healthy newborns or elderly people [Dörner 2013, Arastéh et al. 2009, Musso et al. 2009]. SCr levels, however, are significantly influenced by age, sex, race, muscle mass, chronic illnesses, diet, and medications of the monitored pa- tient [Stevens and Levey 2009,Curhan 2005]. Consequently, in order to ascertain, for example, an acute impairment of the renal function, only the alteration of the SCr level in comparison to the individual baseline level is meaningful [Stevens et al. 2006]. In healthy subjects, SCr values range between 74-110 µmol/l (0.84-1.25mg/dl) in white men and 58-96 µmol/l (0.66- 1.09mg/dl) in white women [Dörner 2013]. The eGFR determined by estimating equations additionally takes age, sex, and certain races into account [KDIGO workgroup 2013, Stevens and Levey 2009, Arastéh et al. 2009, Stevens et al. 2006] and is typically adjusted for body surface area [Stevens and Levey 2009,Stevens et al. 2006], with eGFR values in young healthy whites of about 130 ml/min per 1.73m2for men and 120 ml/min per 1.73m2 for women [Stevens and Levey 2009,Stevens et al. 2006].
However, the detection of renal impairment based on alterations of SCr levels and/or eGFRSCr
can be erroneous because of several major drawbacks. First, a rise in SCr levels due to impaired
glomerular filtration does not take place until about 50% of the kidney function is already lost, hampering early detection of impaired glomerular filtration [Dörner 2013, Macedo and Mehta 2013]. Second, under non-steady state conditions, as often presented in critically ill patients, alterations in SCr levels and therefore in the eGFRSCr might reflect the magnitude and direc- tion of the change in GFR, but do not accurately reflect its exact level [Macedo and Mehta 2013, Stevens and Levey 2009]. Additionally, in patients with a chronic impairment of the re- nal function, the kidney might adapt to the loss of nephrons and no change in the SCr levels or eGFRSCr is detectable, hence obscuring disease progression [Macedo and Mehta 2013]. In healthy subjects, about 10-20% of overall excreted creatinine is secreted by the proximal tubuli, but in patients with impaired glomerular filtration, up to 50% can be eliminated by proximal tubular secretion [Macedo and Mehta 2013, Curhan 2005]. This can lead to an overestimation of the eGFR based on SCr levels, which needs to be overcome by drug administration [Macedo and Mehta 2013]. Moreover, clinical measurements of SCr levels are not absolutely precise and therefore require a change in creatinine of at least 10% to exhibit significant results [Macedo and Mehta 2013]. The accurate determination of SCr levels in critically ill patients is further hampered by positive fluid balance, which leads to diluted SCr concentrations [Macedo and Mehta 2013].
An alternative to determination of eGFR by assessing SCr clearance is the measurement of serum cystatin C (SCysC) levels [Macedo and Mehta 2013, Stevens et al. 2006, Curhan 2005].
CysC is supposed to be constantly produced by all nucleated cells, it is filtered in the glomeruli, and taken up as well as degraded by the proximal tubular cells [Curhan 2005]. CysC is less affected by age, sex, muscle mass, and race of the monitored patient in comparison to SCr and faster mirrors changes in GFR [Macedo and Mehta 2013]. However, it is still significantly influenced by non-renal factors like smoking status, glucocorticoids use, and C-reactive pro- tein (CRP) [Macedo and Mehta 2013, Stevens et al. 2006], it can be altered in specific health states such as diabetes, cancer, obesity, liver disease, and thyroid status [Macedo and Mehta 2013,Curhan 2005], and its concentration can also be affected by positive fluid balance [Macedo and Mehta 2013]. Nevertheless, CysC is also considered to be a biomarker for inflammation and a predictor of cardiovascular events and death independent of kidney function [Curhan 2005].
In healthy adults, SCysC values range between 0.54-0.94 mg/l in men and 0.48-0.82 mg/l in women [Dörner 2013].
A deterioration of the renal function is, in general, often accompanied with diminished urinary output (UO) [Dörner 2013]. Therefore, monitoring the state of UO can illustrate the renal per- formance in a sensitive and non-invasive way [Dörner 2013,KDIGO workgroup 2012,Macedo et al. 2011]. Daily UO for healthy adults ranges between 800-1800 ml for men and 600-1600 ml for women [Dörner 2013]. Oliguria and anuria in adults are defined as a daily UO below 400-500 ml or 100 ml, respectively [Dörner 2013, Arastéh et al. 2009]. However, the determination of UO over a fixed period of time, mostly ranging between 6-24 hrs, can be challenging and prone to errors [Dörner 2013,Macedo et al. 2011]. Moreover, the urine flow can be affected by non-renal factors, e.g. fluid intake and drug administration [Macedo et al. 2011], and oliguria or anuria can also be induced by urinary tract obstruction and total arterial or venous occlusion, dimin- ishing their specificity for detection of renal damage [KDIGO workgroup 2012]. Furthermore, UO is usually normalized to body weight and the non-consistent use of body weight might lead
to an underestimation of UO in obese patients [KDIGO workgroup 2012].
In the course of clinical urinalysis in nephrology, several additional important parameters are assessed, e.g. the urinary protein content [Dörner 2013, Arastéh et al. 2009]. Healthy individ- uals usually excrete less than 150mg of protein per day into the urine [Dörner 2013,Arastéh et al. 2009], with 10-15% thereof being represented by albumin, a large-molecular-weight protein of about 67kDa [Arastéh et al. 2009]. Proteinuria is defined as a protein excretion of more than 150mg per day [Dörner 2013,Arastéh et al. 2009]. An increase of urinary protein content may be caused by elevated permeability of the glomeruli for large-molecular-weight proteins (so- called albuminuria or glomerular proteinuria), insufficient reabsorption of low-molecular-weight proteins in the tubuli (so-called tubular proteinuria) or higher concentration of low-molecular- weight proteins in the filtered plasma (so-called overproduction proteinuria) [KDIGO workgroup 2013]. With albumin representing the major part of urinary protein in most renal diseases, the assessment of urinary albumin content mainly substitutes the diagnosis of proteinuria in clinical practice [KDIGO workgroup 2013]. Drawbacks of albuminuria as a biomarker for detection and progression of impaired renal function include lack of standardized laboratory assays [Jha et al. 2013] and unreleability due to clinical treatment of albuminuria as, for example, included in clinical interventions to improve CKD outcome [Fassett et al. 2011].
The detection of increased excretion of low-molecular-weight proteins into the urine can be uti- lized to specify tubular dysfunction [Del Palacio et al. 2012]. These "tubular proteins" include neutrophil gelatinase-associated lipocalin (NGAL), β-2-microglobulin, retinol-binding protein, urinary CysC, and N-acetyl-β-D-glucosamini- dase (NAG) [Del Palacio et al. 2012]. Other biomarkers for tubular injury comprise glutathione S-transferases, liver-type fatty acid binding protein, kidney injury molecule-1 (KIM-1), and interleucin-18 (IL-18) [Del Palacio et al. 2012].
Kidney biopsies are one of the most specific diagnostic tools for renal malfunctions, how- ever exhibit various drawbacks associated with the required invasive procedure [Arastéh et al. 2009,Kuhlmann et al. 2003].
In addition to the aforementioned clinical tools to monitor renal performance, numerous other parameters are typically assessed in nephrology, e.g. blood pressure, blood and urinary glucose content, urinary pH, urinary leukocyte content, urinary urea content, blood electrolyte con- tent, etc. [Dörner 2013, Arastéh et al. 2009, Kuhlmann et al. 2003], and imaging techniques like sonography, computer tomography, or magnetic resonance imaging are applied in clinical practice [Arastéh et al. 2009,Kuhlmann et al. 2003].
4.1.3 Basic concepts of acute kidney injury after cardiac surgery
Acute kidney injury (AKI) is basically described as an abrupt decrease of the renal perfor- mance [Eckardt et al. 2013,KDIGO workgroup 2012,Mehta et al. 2007]. The most commonly used diagnostic and staging systems for AKI are the Risk Injury Failure Loss End-Stage Renal Disease (RIFLE) [Bellomo et al. 2004], the Acute Kidney Injury Network (AKIN) [Mehta et al. 2007], and the Kidney Disease: Improving Global Outcomes (KDIGO) [KDIGO workgroup 2012] criteria [Ostermann 2014], which are summarized in Table 4.1. They are all based on alterations in SCr levels and UO over certain periods of time, whereas the RIFLE criteria also consider changes in the GFR [Ostermann 2014,KDIGO workgroup 2012,Mehta et al. 2007,Bel-
lomo et al. 2004]. These are common clinical parameters assessed in nephrology, as elaborately discussed in section 4.1.2. RIFLE and AKIN criteria exhibit certain differences, compare to Table 4.1, whereas the KDIGO criteria merge both into a uniform staging system for AKI [Os- termann 2014]. One has to notice that although initiation of renal replacement therapy (RRT) is explicitly excluded in the AKIN criteria as a staging criterion for AKI [Mehta et al. 2007], patients treated with RRT are commonly classified as AKIN-stage 3 irrespective of their AKI stage at RRT initiation [Ostermann 2014].
AKI after cardiac surgery mostly arises due to different, interconnected, pathophysiological mechanisms, and main causes are patient-related factors and the use of cardiopulmonary by- pass (CPB) before, during, and after the surgery [Mariscalco et al. 2011].
CPB use leads to unavoidable changes in blood flow by ischemia-reperfusion injury, low cardiac output, renal vasoconstriction, hemodilution and loss of the pulsatile blood flow [Mariscalco et al. 2011]. This leads to an imbalanced oxygen supply/demand of the kidney, whose blood circulation is usually tightly regulated, compare to section 4.1.1, resulting into significant cel- lular injury [Mariscalco et al. 2011]. Moreover, AKI after cardiac surgery also seems to result from hypothermia, systemic inflammatory response, cell lysis, and embolization caused by CPB use [Mariscalco et al. 2011].
Patient-related risk factors include type of surgery, sex, age, genetic AKI susceptibility, conges- tive heart failure, anemia, diabetes mellitus, chronic obstructive pulmonary disease, emergency status, nephrotoxic drugs and contrast agents, blood transfusions, post-surgical low cardiac output, use of post-operative intraaortic balloon pump, occurrence of sepsis after the surgery, and baseline renal performance [Mariscalco et al. 2011], with CKD, in general, being strongly associated with AKI incidence [Chawla et al. 2014,Lameire et al. 2013].
The AKI pathology is usually divided into several clinical phases [Mariscalco et al. 2011]. The early phase is determined by a vasomotor nephropathy with alterations in vasoreactivity and renal perfusion [Mariscalco et al. 2011]. Consequently, AKI is initiated and the early AKI phase is characterized by prerenal azotemia, cellular adenosine triphosphate depletion and ox- idative injury [Mariscalco et al. 2011]. The extension of these symptoms in the next clinical phase leads to the activation of bone-marrow derived and endothelial cells with a subsequent proinflammatory state [Mariscalco et al. 2011]. These inflammatory cells adhere to the acti- vated endothelium in the peritubular capillaries of the outer medulla with medullary congestion and hypoxic injury of the proximal tubule [Mariscalco et al. 2011]. The final clinical phase is characterized by a proliferation to the tubule cells and the renal function is reconstructed after their redifferentiation and repolarization [Mariscalco et al. 2011].
A typical symptom of post-operative AKI is acute tubular necrosis including urinary granular casts [Mariscalco et al. 2011].
Due to the significantly negative outcomes of AKI after cardiac surgery, as discussed in section 3.1, its prevention and/or early treatment is crucial to improve patient outcome [KDIGO work- group 2012, Wyckoff and Augoustides 2012, Shaw 2012, Mariscalco et al. 2011]. With the use of CPB being the most important cause of AKI, its employment should be adapted in order to prevent AKI [Mariscalco et al. 2011]. In this context, pulsatile CPB proved to be superior to standard linear CPB and in general, CPB flow rates of 1.8 - 2.2 l·min−1·m−2 (only refers to cerebral flow) with a mean arterial pressure >50 - 60 mmHg are recommended [Mariscalco et
al. 2011]. Furthermore, cardiac surgeries should be delayed beyond 24hrs of the patient’s ex- posure to nephrotoxic contrast agents and their use should be limited [Mariscalco et al. 2011].
Moreover, drugs, which increase the renal blood flow, e.g. fenoldopam, show renal protective effects and could therefore prevent AKI [Mariscalco et al. 2011].
The detection of AKI based on SCr levels, UO, and GFR, usually takes place within 48hrs after the surgery when applying the AKIN and KDIGO criteria or within seven days after the surgery when applying the RIFLE criteria [Ostermann 2014, KDIGO workgroup 2012, Cruz et al. 2009,Mehta et al. 2007,Bellomo et al. 2004].
SCralterationsUOalterations RIFLEAKINKDIGORIFLEAKINKDIGO AKIabsoluteincreaseinSCrabsoluteincreaseinSCrreductioninUOurine definitionofeither≥0.3mg/dl(≥26.4µmol/l)ofeither≥0.3mg/dl(≥26.5µmol/l)(documentedoliguriavolume orpercentageincreasewithin48hrsorincreaseof<0.5ml/kg/h<0.5ml/kg/h of≥50%(1.5-foldfromto≥1.5×baseline,for>6hrsfor6hrs baseline)in48hrswhichisknownor presumedtohaveoccurred withintheprior7ds Stage1orincreasedSCrincreasedSCrincreasedSCrUO<0.5ml/kg/hUO<0.5ml/kg/hUO<0.5ml/kg/h Risk×1.5orof≥0.3mg/dl(≥26.4µmol/l)of≥0.3mg/dl(≥26.5µmol/l)×6hrsfor>6hrsfor6-12hrs GFRdecreaseorincreaseto≥1.5to2orincreaseto1.5-1.9× >25%-foldfrombaselinebaseline Stage2orincreasedSCrincreasedSCrincreasedSCrUO<0.5ml/kg/hUO<0.5ml/kg/hUO<0.5ml/kg/h Injury×2or×2to3-fold×2.0to2.9×12hrsfor>12hrsfor≥12hrs GFRdecreasefrombaselinefrombaseline >50% Stage3orincreasedSCrincreasedSCrincreasedSCrUO<0.3ml/kg/hUO<0.3ml/kg/hUO<0.3ml/kg/h Failure×3or>3-fold×3.0from×24hrsfor24hrsfor≥24hrs GFRdecrease75%frombaseline(orbaselineororanuriaoranuriaoranuria orSCr≥4mg/dlSCr≥4.0mg/dl(≥354µmol/l)increaseinSCr×12hrsfor12hrsfor≥12hrs (acuterisewithacuteriseto≥4.0mg/dl→oliguria ≥0.5mg/dl)ofatleast(≥353.6µmol/l)or 0.5mg/dl(44µmol/l)initiationofRRTor inpatients<18yrs decreaseineGFRto <35ml/minper1.73m2 LosspersistentARF =completeloss ofkidneyfunction >4weeks ESKDEndStage KidneyDisease (>3months) Table4.1:AKIdefinitionandstagingsystemsaccordingtoRIFLE,AKIN,andKDIGOcriteria.Abbreviations:ARF, acuterenalfailure;GFR,glomerularfiltrationrate;SCr,serumcreatinine;RRT,renalreplacementtherapy;UO,urine output.Modifiedfrom[Ostermann2014,KDIGOworkgroup2012,Mehtaetal.2007,Bellomoetal.2004].