Water Megamasers in Active Galaxies
INAUGURAL-DISSERTATION
zur
Erlangung des Doktorgrades
der Mathematisch-Naturwissenschaftlichen Fakult¨at der Universit¨at zu K¨oln
vorgelegt von Jan Florian Wagner aus Helsinki, Finnland
K¨oln 2014
Tag der m¨undlichen Pr¨ufung: 26. Juni 2014
This thesis studies the central parsec in active galaxies via spectral line observations of OH and water megamasers and millimeter-wave interferometry. The aims are four-fold: 1) measure the mass of the supermassive black hole in active galactic nuclei (AGN) through circumnuclear wa- ter maser observations, 2) measure the Hubble constant through circumnuclear water maser ob- servations, 3) mitigate the radio frequency interference that degrades spectral line observations, and 4) probe the innermost regions of AGN by expanding a mm-wavelength interferometer.
The AGN is a compact region at the center of active galaxies and can reach extremely high luminosities. The current paradigm conjectures that AGN contain a supermassive black hole (SMBH) fed by matter from a rotating accretion disk, and that this sub-parsec SMBH/disk sys- tem is partially enshrouded in a “torus” of obscuring material within 10 parsec (pc) of the SMBH.
Some AGN also launch a pair of relativistic jets via mechanisms that are still debated, partly due to the high frequency and extreme resolution required to resolve the jet launching region.
The high spatial resolution of very long baseline radio interferometry (VLBI) allows to track jet components over pc to kilo-pc scales outside an AGN. Within AGN, water megamaser emis- sion mapped by VLBI is an excellent tracer of the sub-pc structure, in particular of the accretion disk. Its rotation curve, traced by water masers, allows an accurate SMBH mass measurement, important for constraining the empirical relation between black hole mass and stellar velocity dispersion in the galactic bulge – current evidence suggest that this M
BH–σ
?-relation is not universal, indicating differences in SMBH feeding, accretion history and AGN evolution.
Disk masers further yield accurate distances to nearby maser galaxies by an almost purely geometric means. This allows measuring the current rate of expansion of the Universe, described by the Hubble constant, H
0, an important cosmological parameter that can constrain competing Dark Energy (DE) -like models. The maser-based H
0is an important complement to other tech- niques as it does not rely on not yet fully understood astrophysics. To constrain DE models the key goal of the Megamaser Cosmology Project (MCP) is to measure H
0to at least 3 % precision.
Relatively few ( . 5 %) active galaxies have been detected in water masers. In this thesis I
carried out a water maser survey in nearby galaxies, some with AGN, some also detected in the
dissociation product of water, the neutral hydroxyl radical (OH). Four new water masers were
detected, including OH-detected galaxies, such as NGC 4261 famous for its dusty torus.
ther an association with a possibly truncated low-luminosity jet, or exceptionally luminous nu- clear / extranuclear star formation masers. The AGN disk water masers in UGC 3193 reveal a large accretion disk with two rings suggestive of a disrupted disk around a low central SMBH mass of about 0.6 ± 0.2 × 10
6M . The disk masers in IC 2560 on the other hand indicate a SMBH mass of 5.4
+−0.60.9× 10
6M
, which in light of the 134 ± 12 km s
−1stellar velocity dis- persion in the (pseudo)bulge and the common M
BH–σ
?-relation is undermassive, consistent with the trend seen in other water maser galaxies. The IC 2560 disk masers also allowed the Hubble constant to be measured, resulting in an H
0of 67.7
+−8.911.6km s
−1Mpc
−1. Combined with recent MCP results (UGC 3789, NGC 6264) this yields a new maser-based Hubble constant of 68.4 ± 5.3 km s
−1Mpc
−1(8 %). Additional galaxies are analyzed in the MCP project and the 3 % precision on H
0necessary to constrain the DE may soon be reached.
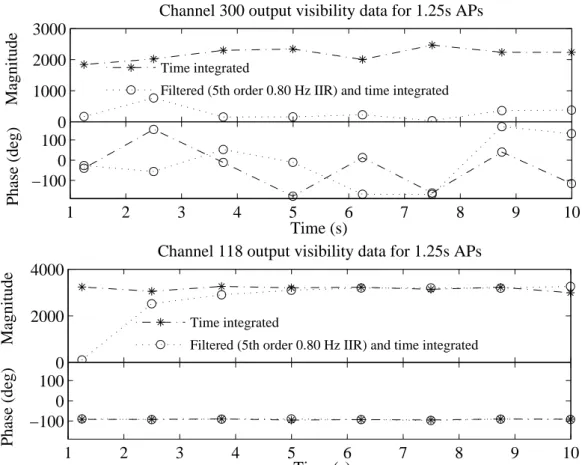
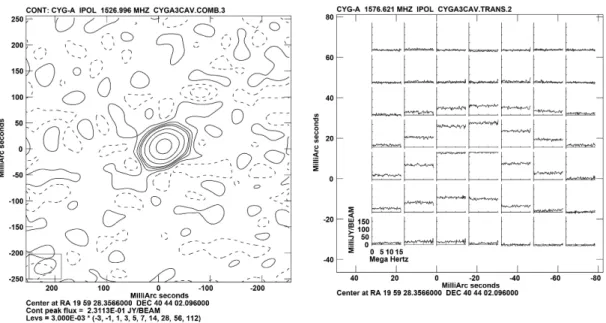
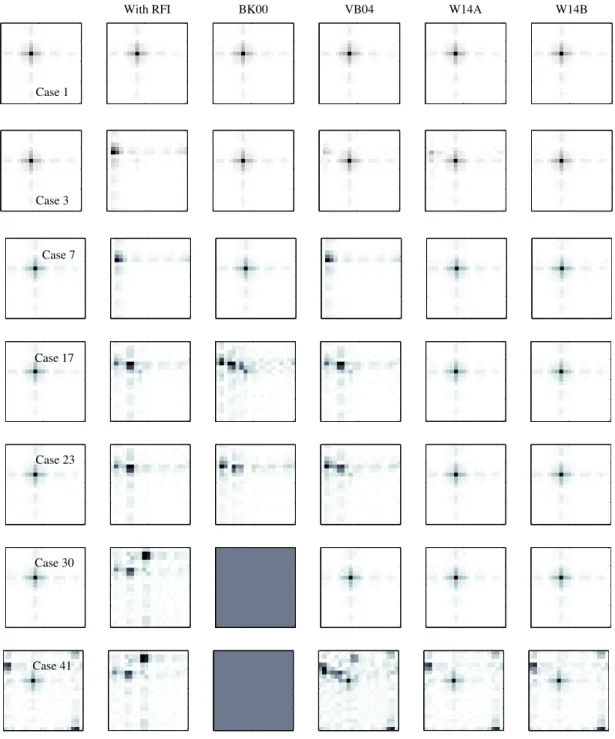
The above observations of low flux density spectral lines, and especially lines at lower fre- quencies, are often degraded by man-made radio frequency interference (RFI). Thus I also dis- cuss two techniques for mitigating RFI. The first method was implemented in a popular VLBI software correlator. I evaluate the theoretical and practical performance, also in a VLBI search for 1.6 GHz OH in tori of Cygnus A and NGC 1068. I find the mitigation method to be e ff ective but limited in practice due to the particular software correlator architecture. The second method improves over two existing approaches for antenna arrays, including focal plane arrays. While current instrumentation did not allow an immediate application, e.g., in my maser survey, I find that the method shows great potential for future spectral line observations in presence of RFI.
Finally, our recent work on expanding a global sub-millimeter VLBI array has enabled ex- treme angular resolution, su ffi cient to resolve the SMBH / disk system and the jet launching re- gion. At the end of this thesis I present the first 230 GHz VLBI observation of the core region of blazar 3C 279. The work also allowed extreme-resolution observations of Sgr A* and the SMBHs in M 87, recently carried out, with emission detected at a scale shorter than 10 gravita- tional radii. These latter data are being analyzed, in a post-thesis time frame, and will lead to a better understanding of SMBH spin, accretion, and jet launching.
This thesis contributes on multiple fronts, both to instrumentation and to RFI mitigation, and increases the current knowledge of individual maser galaxies and observational cosmology.
Keywords: RFI, arrays, VLBI, AGN, extragalactic water masers, observational cosmology.
Diese Arbeit untersucht die inneren Parsec (pc) aktiver Galaxien anhand Spektrallinenbeob- achtungen und Radiointerferometrie. Aktive Galaxien beherbergen eines der leuchtkr¨aftigsten Objekte des Universums, den Aktiven Galaktischen Kern (engl. AGN), eine kompakte zentrale Region die extreme Leuchtst¨arken erreichen kann. Die aktuelle Lehrmeinung vermutet ein su- permassives Schwarzes Loch (engl. SMBH) im inneren sub-pc-Bereich eines AGN, mit Mate- riezufluss aus einer das SMBH umgebenden rotierenden Akkretionsscheibe (AS). Man vermutet außerdem, dass das SMBH/AS-System teilweise durch einen ¨außeren sub-10 pc Materie-“Torus”
verdeckt wird. In einigen AGN st¨oßt die innere Region auch einen relativistischen Materiestrom aus. Die Mechanismen die diesen “Jet” bilden sind umstritten, da die Region bisher nicht direkt beobachtet und bildgebend aufgel¨ost werden konnte.
Mit Radiointerferometrie auf langen Basislinien (engl. VLBI) kann man z.B. der Jet-Materie- fluss außerhalb des AGN ¨uber mehrere (kilo-)pc verfolgen. Die innere sub-pc -Region kann wiederum durch VLBI-Beobachtungen leuchtstarker Wassermaser (H
2O-Emissionslinien) er- fasst werden. Wassermaser werden oft in Jet-N¨ahe, aber auch in der sub-pc AS beobachtet. Die durch “Disk-Maser” abgetastete Rotationskurve der AS erlaubt eine genaue Bestimmung der Masse des zentralen SMBH. Dies liefert wichtige Daten zur empirischen Relation zwischen der SMBH-Masse und der stellaren Geschwindigkeitsdispersion im Zentralbereich der Galaxie (der sog. M
BH–σ
?-Relation). Die Relation scheint bekanntermaßen nicht universell zu sein und dies deutet auf Unterschiede in der AGN- und SMBH-Evolution in verschiedenen Galaxientypen hin.
Disk-Maser erm¨oglichen auch eine pr¨azise und nahezu rein geometrische Entfernungsmes- sung zu Masergalaxien. Anhand der Distanz l¨asst sich die Expansionsrate des Universums be- stimmen, also die Hubble-Konstante, H
0, einem wichtigen kosmologischen Parameter. Anders als bei popul¨aren Methoden h¨angt die maserbasierte H
0-Messung nicht von teils noch umstrit- tenen Details der Astrophysik ab. Mit einem exakten Wert f¨ur H
0lassen sich konkurrierende Dark Energy (DE) -¨ahnliche Modelle der theoretischen Physik ausschließen. Deshalb ist das Hauptziel des Megamaser Cosmology Project, f¨ur das ich drei recht verschiedene Masergalaxi- en analysiert haben, die Bestimmung von H
0auf eine Genauigkeit von mindestens 3 %.
Noch sind relativ wenige Masergalaxien bekannt. In dieser Arbeit habe ich eine Masersuche
in aktiven Galaxien, und Galaxien mit Hydroxyl-Radikal (OH) -Spektrallinien (einem Dissozia-
tionsprodukt von Wasser) durchgef¨uhrt. Vier neue Detektionen enthielten u.a. einen Disk-Maser,
mit m¨oglichen AGN niedriger Leuchtst¨arke (NGC 23, UGC 3193 und IC 2560) analysiert. Die Maser in NGC 23 sind entweder mit einem gek¨urzten Jet von sehr niedriger Leuchtkraft asso- ziert, oder sind ungew¨ohnlich leuchtstarke Maser in inneren Sternformationregionen in NGC 23.
Die Disk-Maser in UGC 3193 andererseits beschreiben eine weite, gew¨olbte und unterbrochene AS mit zwei Ringen, die eine SMBH-Masse von nur 0.6±0.2×10
6M
umgeben. Die Disk-Maser in IC 2560 deuten wiederum auf eine SMBH-Masse von 5.4
+−0.90.6× 10
6M hin. Mit einer σ
?von 134 ± 12 km s
−1ist auch dieses SMBH untermassiv im Vergleich zu der M
BH–σ
?-Relation.
Dieser Trend ist auch in anderen Masergalaxien sichtbar. Zus¨atzlich erlaubten die Disk-Maser in IC 2560 eine Messung der Hubble-Konstante, in diesem Fall 67.7
+11.6−8.9km s
−1Mpc
−1. Mit den Resultaten des MCP zu zwei weiteren Galaxien (UGC 3789, NGC 6264) aktualisiert dies den maserbasierten Wert von H
0auf 68.4 ± 5.3 km s
−1Mpc
−1(8 %). Das MCP-Projekt analysiert noch weitere Galaxien und wird bald eine Genauigkeit von 3 % erreichen.
Die obigen Beobachtungen, und besonders Spektrallinienbeobachtungen auf noch niedrige- ren Frequenzen, leiden oft unter terrestrischen St¨orsignalen (engl. RFI). Diese Arbeit enth¨alt des- halb auch zwei Methoden zur RFI-Abwehrung (engl. RFI mitigation). Die erste Methode wurde in einem bekannten VLBI-Softwarekorrelator implementiert und die theoretischen und prakti- schen Leistung wurde evaluiert, auch in einer VLBI-Suche nach 1.6 GHz OH in den Tori von Cygnus A und NGC 1068. Die Methode an sich ist effektiv, aber wegen der Softwarearchitektur des Korrelators konnte die volle Leistungsf¨ahigkeit nicht erreicht werden. Die zweite Methode, RFI-Subtraktion f¨ur Antennenarrays, stellt eine Verbesserung zweier Ans¨atze dar. Die aktuelle Antenneinstrumentation erlaubte zwar keine sofortige Anwendung der Methode, sie zeigte je- doch großes Potential f¨ur Beobachtungen mit zuk¨unftigen Arrays und Multi-pixel-Empf¨angern in der Pr¨asenz von RFI.
Um zuk¨unftig auch die innerste AGN-Region um das SMBH bildgebend aufzul¨osen, das Ziel der Event Horizon Telescope (EHT) -Kollaboration, arbeiteten wir an einer Erweiterung ei- nes globalen Sub-Millimeter-VLBI-Arrays. Im letzten Kapitel werden die Ergebnisse einer ers- ten extrem hochaufl¨osenden Beobachtung von 3C 279 vorgestellt. Vor kurzem beobachteten wir bzw. das EHT auch Sgr A* und das SMBH in M 87. Es wurde hierbei Emission innerhalb von 10 Schwarzschild-Radii detektiert. Diese frischen noch auszuwertenden Daten und zuk¨unftige Beobachtungen mit dem erweiterten EHT werden, im Anschluss an die hier vorliegende Arbeit, zu einem besseren Verst¨andis des SMBH-Spins, Akkretion und der Jet-Entstehung beitragen.
Mit der vorliegenden Arbeit werden sowohl Beitr¨age im Bereich der Instrumentation und RFI-Abwehrung, als auch Beitr¨age zu mehreren Masergalaxien und der Kosmologie geleistet.
Schl ¨ usselw¨orter: RFI, Arrays, VLBI, AGN, Maser, beobachtungsorientierte Kosmologie.
Glossary viii
1 Introduction 3
1.1 Active Galaxies and Jets . . . . 4
1.2 The Active Galaxy Zoo . . . . 4
1.3 The AGN Unification Scheme . . . . 5
1.4 Astrophysical Masers . . . . 7
1.5 Water Masers in AGN Accretion Disks . . . . 11
2 Radio Interferometry 13 2.1 Modern Arrays . . . . 15
2.2 The Principle of Synthesis Imaging . . . . 17
2.3 The Coherence Function . . . . 18
2.4 The Intensity Distribution . . . . 18
2.5 The Complex Visibility . . . . 19
2.6 Derived Observables . . . . 21
3 Radio Frequency Interference and Interference Mitigation 23 3.1 Overview of RFI Mitigation . . . . 24
3.2 Interference Mitigation for Arrays . . . . 28
3.3 A Fringe Rate Filter Implementation for DiFX-2 . . . . 34
3.4 Fringe Rate Filter Tests and Results . . . . 39
3.5 EVN VLBI Test Observation for RFI Mitigation . . . . 46
3.6 Conclusions for VLBI RFI Mitigation in DiFX . . . . 54
3.7 RFI Mitigation for Arrays . . . . 56
3.8 Array RFI Mitigation Tests and Results . . . . 64
3.9 Summary and Conclusions for Array RFI Mitigation . . . . 76
4 Water Megamaser Survey 77
4.1 Source Sample . . . . 78
4.2 Observations . . . . 79
4.3 Data Reduction . . . . 79
4.4 Detections and Discussion . . . . 82
4.5 Dual Maser Species . . . . 86
4.6 Conclusions and Summary . . . . 88
5 Jet Water Masers in NGC 23 91 5.1 Abstract . . . . 91
5.2 Introduction . . . . 92
5.3 Observations and Data Reduction . . . . 93
5.4 Results . . . . 95
5.5 Discussion . . . . 101
5.6 Summary and Conclusions . . . . 103
6 A Black Hole Mass Measurement for Megamaser Galaxy UGC 3193 104 6.1 The Megamaser Galaxy UGC 3193 . . . . 105
6.2 Single Dish Observations . . . . 106
6.3 Fitting of Maser Accelerations . . . . 107
6.4 Maser Accelerations in UGC 3193 . . . . 109
6.5 Interferometric Observations . . . . 111
6.6 VLBI Data Reduction . . . . 113
6.7 VLBI Results . . . . 115
6.8 Geometric Keplerian Disk and Plummer Cluster Models . . . . 118
6.9 Model Fit Results and Discussion . . . . 119
6.10 Summary and Conclusions . . . . 121
7 An Angular Diameter Distance to Megamaser Galaxy IC 2560 122 7.1 Abstract . . . . 122
7.2 Introduction . . . . 123
7.3 The Water Maser Galaxy IC 2560 . . . . 126
7.4 Single-Dish Observations and Data Reduction . . . . 127
7.5 Single-Dish Results . . . . 128
7.6 Maser Acceleration Fitting . . . . 130
7.7 Maser Accelerations Results . . . . 130
7.8 VLBI Observations and Data Reduction . . . . 133
7.9 VLBI Results . . . . 134
7.10 Geometric Models Fit to IC 2560 Maser Data . . . . 136
7.11 Model Fit Results and Discussion . . . . 138
7.12 Summary and Conclusions . . . . 146
8 Deeper into AGN: λ1.3 mm-VLBI 147 8.1 Abstract . . . . 148
8.2 Introduction . . . . 149
8.3 Zero Spacing Flux Density . . . . 151
8.4 VLBI Observation . . . . 151
8.5 VLBI Data Reduction . . . . 155
8.6 Results . . . . 161
8.7 Discussion . . . . 172
8.8 Conclusions . . . . 173
8.9 Future Outlook . . . . 174
Bibliography 177 List of Figures 193 List of Tables 197 Acknowledgements 199 A Appendix 201 A.1 DiFX Configuration Files for Fringe Rate Filtering . . . . 201
A.2 Summary of the RFI Mitigation Source Code . . . . 205
A.3 Spectra of the Water Maser Non-Detections . . . . 207
A.4 Geometric Models for the Maser Distribution . . . . 211
A.5 Water Megamaser Epochs on IC 2560 . . . . 223
A.6 Water Megamaser Positions in NGC 23, UGC 3193 and IC 2560 . . . . 224
A.7 Parameter Posteriors for the IC 2560 Disk Maser Model Fit . . . . 232
Erkl¨arung 248
Curriculum Vitae 249
AGN active galactic nucleus.
AP averaging period.
APEX Atacama Pathfinder Experiment telescope.
EHT Event Horizon Telescope.
EVN European VLBI Network.
FWHM full width at half maximum.
GBT Robert C. Byrd Green Bank Telescope.
GMVA Global mm-VLBI Array.
INR interference to noise power ratio.
IVS International VLBI Service.
LOS line of sight.
LSR local standard of rest reference frame.
MCP Megamaser Cosmology Project.
NED the NASA / IPAC Extragalactic Database.
RFI radio frequency interference.
SMBH supermassive black hole.
SNR signal-to-noise ratio.
VLA Karl G. Jansky Very Large Array.
VLBA Very Long Baseline Array.
VLBI very long baseline interferometry.
This thesis covers a range of studies on active galactic nuclei, combining technical improvements with observational astronomical applications. To help orient the reader the general outline and structure of the thesis is described here.
The main theme of this thesis is the central region in active galaxies at scales shorter than a few parsec. The thesis started out as a technical project for mitigating man-made radio frequency interference that is detrimental to radio astronomical observations, and in particular to spectral line observations. The technical work was followed by spectral line observations, observations of the extremely luminous astrophysical megamasers found near the core of active galaxies, partly with implications to observational cosmology, and finally, the first ultra-high resolution observation of the core region of an active galaxy.
The first part of this thesis presents the general background and technical matter. The second part then moves towards progressively higher resolution and finer scales in active galaxies. The chapters are organized as follows:
• Chapter 1 introduces the reader to active galaxies and astrophysical masers, and in partic- ular to water megamasers that trace accretion disks around the supermassive black hole in the center of these active galaxies. The Chapter sets the context for the observations of active galaxies carried out under this thesis.
• Chapter 2 presents the fundamentals of the classic radio interferometric technique that is related to very long baseline interferometry (VLBI), phased arrays, and focal-plane arrays.
Radio interferometry was used in VLBI observations of active galaxies at frequencies from 1.6 GHz to 230 GHz. Interferometry is also the underlying principle of the radio interference mitigation techniques under this thesis.
• Chapter 3 begins with an introduction to radio frequency interference in relation to as-
tronomy. The Chapter then discusses the technical aspects of the particular interference
mitigation techniques that were implemented, improved, and tested under this thesis. Re-
sults for synthetic and actual data are presented.
interferometric follow-ups are pending. The following Chapters instead concentrate on the first observations of water megamasers previously detected by in three other galaxies.
• Chapter 5 presents observations of the putative “jet” water megamasers in the galaxy NGC 23, carried out under the Megamaser Cosmology Project.
• Chapter 6 discusses observations of the water megamasers in a large accretion disk around the core of the active galaxy UGC 3193. The masers were first detected by the Megamaser Cosmology Project and this Chapter presents the results of the first VLBI observations, including a maser-based estimate of the mass of the supermassive black hole in UGC 3193.
• Chapter 7 discusses another “disk” maser galaxy, IC 2560, for which both a black hole mass as well as an accurate distance are derived. The main goal of the Megamaser Cos- mology Project is to measure the cosmological parameter related to Dark Energy and the accelerated expansion of the Universe, the Hubble constant, by measuring distances to several galaxies similar to IC 2560. This Chapter provides a new estimate of the Hubble constant based on the water maser distance to IC 2560.
• Finally, Chapter 8 discusses the future ultra-high resolution interferometry with a tele-
scope network that now includes the APEX telescope in Chile. The Chapter shows the
results of a fringe finder observation and tentative results on the fine-scale structure in the
blazar 3C 279.
The building blocks of our Universe are galaxies, also known as “dust” to cosmologists. Galaxies are massive gravitationally bound objects of star systems, star clusters, interstellar medium, and a hypothetical component, a halo of dark matter that appears to affect the motion of the stars and gas in a galaxy. In addition to ordinary galaxies like our own, there exists a category of galaxies that have an exceptionally high luminosity across a wide range of the spectrum (Fig. 1.1). Most of the energetic activity in these active galaxies is concentrated to a single central region, the active galactic nucleus (AGN).
Fig. 1.1: A typical spectral energy distribu- tion for normal and active galaxies across radio frequency (RF), infrared (IR) and visible light wavelengths. (Image credit:
Cengage Learning.) This central region is bright, extremely com-
pact, and often outshines the host galaxy by sev- eral orders of magnitude. Its spectral energy distri- bution indicates radiative processes that are thermal (e.g., heated gas and dust, thermal bremsstrahlung) and non-thermal (e.g., synchrotron and inverse- Compton emission). Unlike in other galaxies the spectrum is not dominated by stellar radiation.
The emission by AGN is thought to be pow- ered by the gravitational energy dissipated through accretion onto a supermassive black hole (SMBH;
over 10
5solar masses). Most of the radiated energy comes from very close to the event horizon of the SMBH. While SMBHs are found in the nucleus of both active and non-active galaxies (Kormendy &
Richstone 1995), and both galaxies have the same
morphological properties, only active galaxies appear to have sufficient matter transport towards
the core region to fuel the AGN (see, e.g., Jogee 2006; Hopkins & Quataert 2010 and references
therein). Depending on the radiative efficiency and the nature of the accretion disk and the gas
accretion, relatively low fueling rates of between 10
−5and 10 solar masses per year are sufficient
to explain the observed luminosity.
1.1 Active Galaxies and Jets
Approximately 10 % of AGN are known to launch a diametrically opposed pair of relativistic jets. The jets are detected as linear radio structure in interferometric images, and with apparent superluminal motion due to viewing angle e ff ects (e.g., Lister et al. 2013). Due to relativistic Doppler de-boosting the receding jet is usually not detected unless the jet axis is closely aligned with the plane of the sky.
Jets have been the subject of extensive study for several decades, yet there is no consensus on the mechanism that leads to the creation, launching, and collimation of the jet in the innermost region of an AGN. With a dramatic improvement in the angular resolution of radio interferome- ters, however, a work that is currently in progress, su ffi ciently high resolution will be reached to probe accretion mechanisms and directly observe the jet launching region in nearby AGN (e.g., Doeleman et al. 2012). It also becomes possible to constrain the spin of certain SMBHs such as the black hole in the center of our Galaxy (e.g., Dexter & Fragile 2013).
1.2 The Active Galaxy Zoo
There are several types of active galaxy, divided into radio-quiet and radio-loud objects, and classified as Seyfert galaxies, radio-quiet quasars, radio-loud quasars, blazars or BL Lac type objects and optically violently variable quasars, and radio galaxies (e.g., Antonucci 1993).
The most luminous active galaxies, blazars, and their slightly less energetic relative, quasars,
are thought to be the result of beamed emission by a jet that is pointed towards the observer
(Fig. 1.2). Recently quasars have been detected up to high redshifts, as far back as the epoch of
reionization, an epoch in the evolution of the Universe (Fan et al. 2006). A common character-
istic of most active galaxies is their optical spectral line emission. Depending on the presence
of broad or narrow optical emission lines, the AGN in an active galaxy is often classified as a
Type 1 AGN (Seyfert 1) or a Type 2 AGN (Seyfert 2), or neither. Quasars and Seyfert 1 galax-
ies have broad optical permitted lines such as Hα and Hβ, with a > 500 km s
−1full width half
maximum (FWHM) line width. In Seyfert 2 galaxies these lines are not detected. On the other
hand, quasars and both Seyfert types are detected in narrow high and low ionization forbidden
lines, such as [O III] and others, with < 500 km s
−1FWHM line widths. Quasars and Seyferts
are also detected in very high ionization coronal lines ([Fe X] and others), with similar line ratios
(Bianchi et al. 2012).
Fig. 1.2: The structure of an active galactic nucleus (AGN) under the AGN Unification scheme.
(Image credit: Cengage Learning.)
Fig. 1.3: A close-up view of Fig. 1.2 on the structure of the accretion disk and the inner magne- tosphere in the region where the disk terminates at the black hole’s innermost stable circular orbit (left), or with the accretion flow extending beyond this orbit (right). Image from Komissarov (2012).
1.3 The AGN Unification Scheme
Under the Seyfert or AGN unification model, a model that has been debated for the last two decades, the apparent different classes of AGN mentioned above are explained by an orientation- dependent obscuration of a basically similar central object (Antonucci 1993).
The structure of an AGN under the unification model is shown in the left of Fig. 1.2. The
emission that is dominant in di ff erent parts of this structure is shown in the right of Fig. 1.2. For
example, the narrow line region (NLR) with narrow optical spectral lines is thought to reside at
a larger distance from the SMBH and its surrounding accretion disk. In contrast, the broad line
region (BLR) that emits broad optical spectral lines, possibly from a deep gravitational potential
well, is thought to reside near the SMBH. The accretion disk around the SMBH produces strong
ultraviolet (UV) emission that is typical of Seyfert galaxies.
From certain viewing angles an obscuring region of material (the “dusty torus” of Fig. 1.2) coincides with the line of sight towards the SMBH and obscures the view to the broad line region. The region of obscuring material is often thought to be clumpy and composed of clouds, and is often thought to have the shape of a torus, although other geometries are also possible.
An AGN in which the obscuring torus is seen edge-on will have an obscured BLR and will be subsequently undetected in broad optical lines, leading to its optical classification as a Seyfert 2.
Current evidence for a torus is indirect, and its structure and formation are uncertain or largely unknown. Even its existence is debated. If it exists, the torus is likely not larger than 100 pc, may be clumpy, perhaps molecular, and may arise from outflow of clouds embedded in a hydromagnetic disk wind (indicated in Fig. 1.3), with clouds uplifted from the accretion disk (Blandford & Payne 1982). It may also consist of clouds accreted from the host galaxy (Krolik
& Begelman 1988), or in some galaxies even only a single cloud (Aretxaga et al. 1999).
For an overview of the past and current understanding of the unification scheme and the obscuring torus, the reader is referred to Antonucci (1993) and the reviews by Urry & Padovani (1995) and Bianchi et al. (2012), but also see Ramos Almeida et al. (2011) and Elitzur (2012).
Recently, clouds in a putative torus may have been detected in spectral line emission, and in spectral line absorption against the core, although such detections have been highly elusive in the past. Elitzur & Shlosman (2006) consider the water megamaser emission seen at parsec scales in the Seyfert 2 galaxy NGC 3079 to be associated with a torus. A similar association has also been suggested for masers in Circinus A (Greenhill et al. 2003) and NGC 1052 (Sawada-Satoh et al. 2008). In addition, hydroxyl has been seen in absorption at sub-parsec scales in NGC 1052 and tentatively in Cygnus A (Impellizzeri 2008).
In all cases, however, a torus association is not definite. Also other evidence of the existence of a torus and the ability of a torus to explain the sometimes quite different properties even of Seyfert galaxies (e.g., the recently detected “unobscured” Seyfert 2 galaxies, with a possible explanation given by Tan et al. 2012) remains inconclusive.
Currently only the black-hole / accretion-disk paradigm is well-established. The structure of the accretion disk at less than ten gravitational radii from the black hole (Fig. 1.3) – and the relation of the disk structure to jet launching and black hole spin – can soon be observed directly owing to the advancements in high resolution radio interferometry (e.g., Doeleman et al. 2012).
The structure and conditions in the accretion disk can, in fact, already be probed through
water maser emission at sub-parsec scales and at a few thousand gravitational radii.
1.4 Astrophysical Masers
Astrophysical “masers” (microwave amplification by stimulated emission of radiation; cf. Elitzur 1992, 2007) are the result of stimulated radiative transitions from a higher to a lower energy level in molecules in some medium (Fig. 1.4). Some of the energy levels of water vapour (H
2O) and some of the radiative transitions between these levels are shown in Fig. 1.5.
Masers operate by the same principle as terrestrial optical lasers. Maser emission occurs when the medium is out of thermal equilibrium and when there is an energy source available that pumps the maser emission by maintaining a population inversion, a greater occupancy of the higher energy level in the molecular gas. To allow a radiative rather than collisional de- excitation the density of the medium must be below a certain critical volume density.
In addition, for an incident photon to produce a second photon (Fig. 1.4), its wavelength must be within the thermal line width of the inverted molecules, without a significant Doppler shift. The latter requires the molecules to have the same radial velocity i.e. the medium must be
Fig. 1.4: Stimulated emission in a masing molecule.
15 10 5 0 5 10 15
0 500 1000 1500 2000 2500 3000 3500 4000
Ortho Para
Energy Level (E / k b) [K]
Total Angular Momentum (J) 557 GHz
380 GHz 448 GHz 22 GHz
439 GHz 443 GHz 321 GHz
183 GHz 325 GHz 475 GHz
471 GHz
488 GHz 437 GHz v2=1
658 GHz Ground
Fig. 1.5: The energy levels and some radiative transitions of ortho and para isomers of water. The
nuclear spins of the hydrogen atoms are either parallel (total spin I = 1) or antiparallel (total spin
I = 0) for the ortho and para isomers, respectively. Data from Tennyson (2011).
velocity coherent along the line of sight. When the column density is sufficiently high, a growing cascade of stimulated photons will be generated along this path, producing a maser.
Maser emission by OH, H
2O, H
2CO, CH
3OH, SiO, and other molecules has been detected in our Galaxy, but the most luminous extragalactic masers are hydroxyl (OH) and water vapour (H
2O) masers. They have been detected at kilomaser ( . 1 L ) and megamaser luminosities
( & 1 L ). However, currently Arp 299 (IC 694) is the only galaxy with both OH and H
2O mega-
masers detected in their lowest frequency radiative transition.
Fig. 1.6: Abundances of O, O
2, OH, and H
2O as a function of temperature. Abundances are relative to a density n(H
2) of 10
6cm
−3and are sensitive to temperature (Neufeld et al. 1995).
Extragalactic OH masers at 1665 MHz and 1667 MHz, first detected in NGC 253 (Whiteoak & Gardner 1974) and at a mega- maser luminosity first in Arp 220 (Baan et al.
1982), are generally found in the inner 100 pc of luminous infrared galaxies. The masers are associated with starbursts and AGN and of- ten shows disk/ring-like structure (Kl¨ockner
& Baan 2004; Pihlstr¨om 2005).
Extragalactic H
2O masers on the other hand, first found in M 33 by Churchwell et al. (1977), are generally detected in the 6
16→ 5
23(J
KaKc) rotational energy level tran- sition with a corresponding rest frequency of 22.23508 GHz (λ1.3 cm). While several of
the other transitions in Fig. 1.5 have been detected in our Galaxy in, e.g., star formation regions and circumstellar envelopes of stars, the detection of extragalactic water masers at frequencies higher than 22 GHz appears to be limited by sensitivity. In fact, currently only two extragalactic masers have been found at 183 GHz, in NGC 3079 and Arp 220, with one tentative maser detec- tion at 439 GHz in NGC 3079 (Humphreys et al. 2005). Future high-sensitivity high-frequency arrays are likely to increase the number of these detections.
The currently known λ1.3 cm water masers are predominantly found in nearby radio-quiet Seyfert 2s and low-ionization nuclear emission-line region (LINER) galaxies (Greenhill 2007).
The population inversion necessary for masing is thought to be the result of purely collisional
pumping. The water masers favour large hydrogen densities, 10
7≤ n(H
2) ≤ 10
11cm
−3, and
large gas phase water abundances of x(H
2O) = n(H
2O)/n(H
2) > 10
−4. The abundance of water
is significantly enhanced at > 300 K temperatures by the neutral-neutral reaction, O + H
2→ OH + H
OH + H
2→ H
2O + H
that produce but also deplete OH, depending on the temperature (Fig. 1.6; also see, e.g., Elitzur
& de Jong 1978; Neufeld et al. 1995). Gas kinetic temperatures of 300 K up to the dissociation of the water molecule at about 1000 K are typical for the environment of water masers.
To date, over 4000 galaxies have been searched for 22 GHz water masers, resulting in 150 masers detections (e.g., Braatz & Gugliucci 2008; Braatz et al. 1997; Henkel et al. 2005; Kon- dratko et al. 2006; Nakai et al. 1995).
The water masers known so far may be subdivided into five categories with masers associated
with: 1) late-type stars, 2) star forming regions, 3) AGN “outflow masers” in outflow impinging
onto dense molecular clouds and collisionally pumped in the shocked interface, 4) “jet” masers
in jet-cloud or jet-interstellar medium interactions within a few 10 parsec of the SMBH and also
related to a shocked region, and 5) disk masers that trace a sometimes warped accretion disk
around the SMBH at sub-parsec scales (Figs. 1.7 and 1.8).
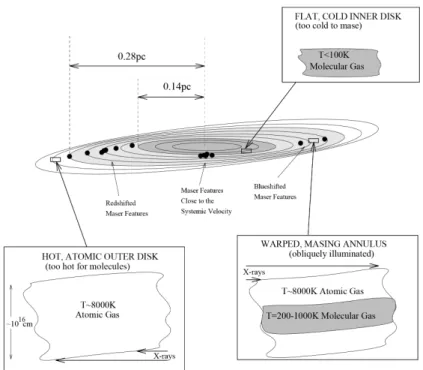
Fig. 1.7: Schematic of the sub-pc warped accretion disk in NGC 4258, inferred from H
2O masers (dots). It is often thought that the disk is multi-layered (bottom right). The conditions for masing (a gas kinetic temperature of 300 K to 1000 K, hydrogen densities of n
H2∼10
7− 10
11cm
−3) are reached in the dense inner molecular layer of the disk near the atomic–molecular transition region via a combination of disk midplane pressure and X-ray heating by the central engine. A warp is crucial for oblique X-ray illumination and heating of the disk. Flat regions and regions self-shadowed by a warp are too cold to mase (top right). Conversely, X-ray ionization increases with larger radii (bottom left) and near the surface of the disk, with temperatures too high for water molecules. Masers trace the disk over about 10
5to 10
7gravitational radii. Image adopted from Neufeld & Maloney (1995).
Fig. 1.8: The maser single-dish spectrum (top left), the interferometric map of the maser distribution
(bottom left), and the Keplerian rotation curve (right) of the water masers in the prototypical disk
maser galaxy NGC 4258. Image adopted from Bragg et al. (2000).
1.5 Water Masers in AGN Accretion Disks
Fig. 1.9: The M
BH–σ
?relations for di ff erent types of galaxies. Im- age adopted from McConnell et al.
(2011).
The disk masers in over 15 known active galaxies of Seyfert 2 and LINER types appear to trace the accretion disk around the SMBH at sub-parsec scales.
The prototypical example of a disk maser galaxy is NGC 4258. As indicated in the previously mentioned Figs. 1.7 and 1.8, the spatial maser distribution and the maser kinematics (reflected by the position–velocity dia- gram) appear to be consistent with a well-defined edge- on thin Keplerian disk that is slightly warped and has a diameter of about 0.3 pc. For another disk maser galaxy, IC 2560, X-ray observations by Tilak et al. (2008) further suggest a possible relation between the obscuring torus and the disk with di ff erent accretion disk geometries, shown in Fig. 1.10: in some geometries, the warped masing accre- tion disk may itself provide the obscuration of the central engine, taking the function of an obscuring “torus”.
In general, AGN disk water masers can also pro- vide very accurate “gold standard” mass measurements for
SMBHs (Kuo et al. 2011). These masses are inferred from the disk kinematics in the sub-parsec inner region of an AGN, close to the gravitational sphere of influence of the SMBH. They reflect the SMBH mass more reliably than the virial masses that are determined from the H I rotation curve at kiloparsec scales or from the stellar velocity dispersion in the galactic bulge (if the galaxy has a bulge rather than pseudo-bulge).
The maser-based SMBH mass estimates are important for constraining the empirical M
BH–σ
?relation between black hole mass and stellar velocity dispersion in the bulge – current findings suggest the M
BH–σ
?relation is not universal, but depends on the type of galaxy (see Fig. 1.9).
The black hole mass in early type galaxies and maser galaxies may follow a different relation than in late type galaxies (McConnell et al. 2011), which in turn suggests a different black hole feeding and accretion history in these galaxies (Greene et al. 2010).
In addition to SMBH masses, the disk masers around a SMBH can provide extremely ac- curate geometric distance determinations without the need for indirect assumptions about the cosmology and the geometry (curvature) of the universe (Braatz et al. 2009; Reid et al. 2013).
The maser distance and a redshift determined for the spectral emission lines of the AGN
allow measuring the Hubble constant, H
0. With several disk maser galaxies at a distance between
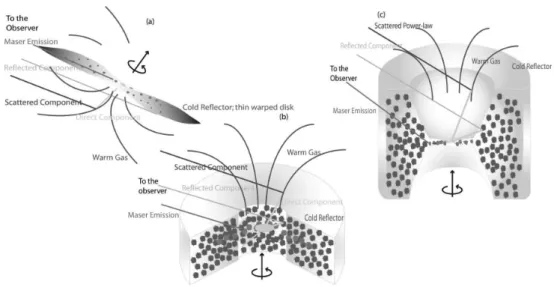
Fig. 1.10: Schematic illustration of three possible accretion disk geometries. X-ray observations in water megamaser galaxy IC 2560 find a cold reflecting medium (interpreted as the disk detected in water maser emission) and a warm scattered component. Image adopted from Tilak et al. (2008).
about 20 Mpc to 250 Mpc, H
0could be ultimately determined to better than 3% precision, the goal of the Megamaser Cosmology Project (MCP) by Braatz et al. (2009).
A maser-based H
0determined to 3 % with nearby galaxies at low redshifts is able to place tighter constraints on Dark Energy -like models (models that explain the current expansion of the Universe) than measurements at higher redshifts, such as baryon acoustic oscillation and cosmic microwave background observations. The main practical obstacle of the MCP project are sensitivity and resolution; the disk water masers are faint with a very low flux density (typically between 0.01 Jy and 1 Jy) compared to galactic water masers (typically 1 Jy), and masers are distributed over a small region of only a few milliarcseconds. Due to these factors, not many of the currently known disk maser galaxies are suitable for a low-uncertainty H
0measurement.
The MCP project thus also conducts surveys to find new disk maser galaxies.
Water disk megamaser observations related to the MCP project, i.e., a short survey, one “jet”
maser galaxy (NGC 23), a disk maser galaxy (UGC 3193) yielding a new maser-based black hole mass, and a disk maser galaxy (IC 2560) yielding a measurement of the Hubble constant that updates a previously published H
0for this galaxy by a different group and that is based on new data and an improved technique, will be presented in a later Chapter of this thesis.
Before proceeding with the above maser galaxies, however, the following two Chapters will
first introduce the radio interferometric technique that was used in these observations, and will
also cover two radio frequency interference (RFI) mitigation techniques pertaining to future
interferometric observations.
Fig. 2.1: The interferometric fringe pattern of a two-antenna baseline. The baseline has maxi- mum sensitivity towards source regions that co- incide with the constructive interference peaks of the fringe pattern.
Astrophysics has a continuous demand for observational astronomy to observe ever fainter or distant sources and resolve them down to ever smaller scales. Increases in both sensitivity and resolution are crucial to this.
Compared to optical telescopes, however, ra- dio astronomical telescopes have a notably lower resolution. This is due to the physical resolution limit, ∝ λ/D, set by di ff raction in a circular telescope aperture of diameter D at a wavelength λ (e.g., Airy 1835), and due to the factor of & 10
4di ff erence in the typical radio (∼ 1 cm) and optical (∼ 500 nm) wavelengths.
The observing wavelength is often fixed due to, e.g., the need to observe a certain spectral line. Higher resolution would require a larger telescope. Unfortunately, with the exception
of stationary dishes like the 305 m Arecibo Observatory and soon the 500 m Aperture Spheri- cal Telescope, the limits of support structure and surface stability and financial feasibility have already been reached with the largest steerable telescope, the 110 m Green Bank Telescope.
Optical interferometers, on the other hand, are relatively small and very sensitive to propa-
gation delays and signal phase di ff erences. The latter allow a high angular resolution, as shown
later. In 1655 Grimaldi detected the first optical interference patterns, di ff raction fringes. This
sparked a search for a theory of light that eventually lead to modern quantum mechanics and
quantum field theory, and also produced a series of inventions that lead to the first highly
phase-sensitive optical interferometers. Examples include the optical stellar interferometer by
Fizeau and St´ephan in 1879, the 1887 Michelson–Morley interferometric experiment with its
non-detection of an æther wind, the Fabry-P´erot interferometer and filter used in optical astron-
Fig. 2.2: The e ff ect of longer baselines on fringe spacing: an increase in resolution.
During the 1950s, high angular resolution radio interferometry was pioneered by the Nobel laureates Ryle and Hewish, and others such as Neville and Pawsey (see, e.g., Ryle 1955, 1957, 1962, and Ryle & Hewish 1960).
In radio interferometry the radiation incident from the astronomical source is simultane- ously received at widely separated antennas and their signals are combined to produce a fringe (Fig. 2.1). The angular resolution θ ∝ λ/B improves as one increases the observing frequency or the projected distance between antenna-pairs as seen from the source, also called the baseline length B. This is illus-
trated in Fig. 2.2. Widely separated antenna pairs very easily yield a resolution that is unattain- able with a single telescope. Due to the higher resolution for example source positions can be measured to much greater precision than with a single telescope.
Also note that baselines have their highest sensitivity towards the directions of peaks of the fringe pattern (constructive interference) and are insensitive to source emission from the null regions of the fringe pattern (destructive interference). In addition, to detect a fringe at a given resolution the source must also be spatially coherent over the respective angular spacing. This can be used to measure the source diameter of a compact object, e.g., a quasar: one simply narrows the fringe spacing (via longer baselines) until it eventually becomes comparable to the source diameter. Beyond this spacing the source is resolved out and the spatial coherence is lost.
The non-detection of the fringe below a certain fringe spacing reveals the source diameter.
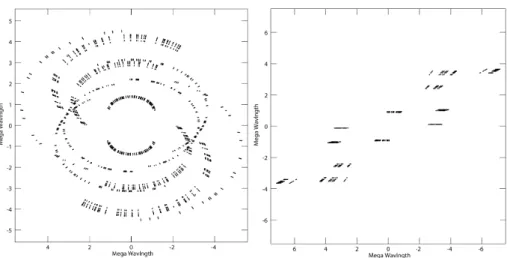
Other important techniques are radio interferometric imaging and the non-imaging technique of modelfitting. The average amplitude and the di ff erence in the phase of the incident signal can be measured between many antenna pairs. This samples structural information of the astronom- ical target over a large number of spatial frequencies. With su ffi cient data and certain algorithms it is possible to reconstruct an image of the source brightness distribution. With fewer data, the spatial frequency representations of simple superposed Gaussian-shaped image components may be fit to derive the most likely image of the source. A technique called Earth rotation aperture synthesis is also often used to improve the data; Earth rotation increases the effective number of the spatial measurements. A glimpse of this can be seen in Fig. 2.7 discussed later.
Among the first notable radio interferometric observations were the sunspot measurement
by Ryle & Vonberg (1946), the stellar observation by Scott et al. (1961), and a survey of the North Polar region by Ryle & Neville (1962), and a series of galactic 1665 MHz hydroxyl and 22 GHz water maser mapping observations by, e.g., Rogers et al. (1967) and Moran et al. (1973).
More about the history and observations can be found in the reviews by Kellermann & Cohen (1988) and Kellermann & Moran (2001). See also Alef (2004) for a terse technical review of VLBI instrumentation.
2.1 Modern Arrays
Fig. 2.3: The large scale jet and the core region of the active radio galaxy Cygnus A seen by a local array (VLA) and by a VLBI array (GMVA).
Turning to current times, radio astronomical in- strumentation often places small antenna arrays in the telescope primary focus. These multi-beam or multi-pixel receivers, focal-plane arrays (FPAs), and phased array feeds (PAFs) allow a larger sky area to be observed in a shorter time and dramati- cally increase the speed of, e.g., 21 cm H i mapping and spectral line surveys, continuum surveys, cos- mological surveys, and pulsar and radio transient searches.
For better resolution and sensitivity one may also use a traditional local array of several anten- nas, such as the Low-Frequency Array (LOFAR), the Long Wavelength Array (LWA), the Karl G. Jan- sky Very Large Array (VLA), the Atacama Large Millimeter / submillimeter Array (ALMA), and the Square Kilometre Array (SKA). Modern arrays cover di ff erent frequency bands from about 40 MHz (LOFAR) up to 1.6 THz (ALMA), with an angular resolution of arc minutes to some ten milliarcsec-
onds depending on the array, and are highly suitable for a broad range of galactic and extra- galactic astrophysics, including cosmology.
Even higher resolution observations became routine thanks to many innovations over the past decades, such as specialized image reconstruction techniques, calibration algorithms like the
“closure phase”-based array self-calibration by Jennison in the 1950s, and digital recording and
signal processing advances towards increasingly wider-bandwidth signals. These paved the path
to very long baseline interferometry (VLBI) with antennas on most continents. VLBI provides
baselines of 100 km to 12,000 km, or, with space VLBI, up to some 100,000 km, with sometimes
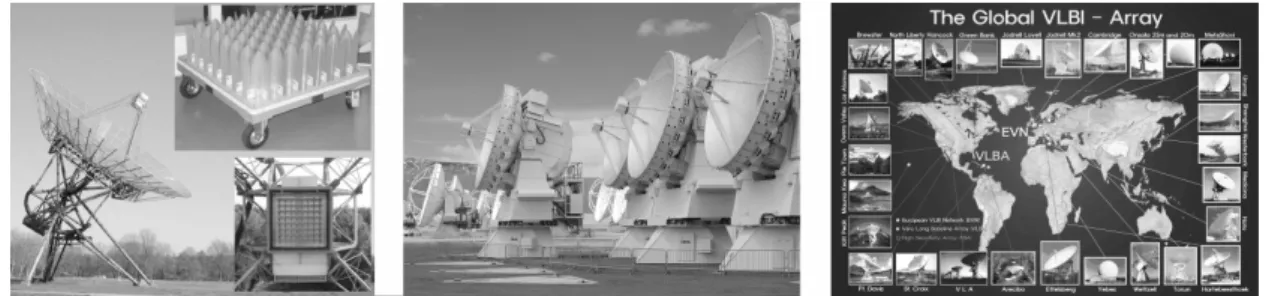
Fig. 2.4: Common radio interferometric antenna arrays and their various scales: a focal-plane array (left), a high sensitivity connected local interferometer (middle), and a network of anten- nas for very long baseline interferometry (right). (Images courtesy of Verheijen et al., ALMA (ESO / NAOJ / NRAO) and T.-H. Jung.)
spectacular resolution. Many VLBI arrays are in operation today, such as the European VLBI Network (EVN), the Very Long Baseline Array (VLBA), the new East Asia VLBI Network (EAVN), the Global mm-VLBI Array (GMVA), and the Event Horizon Telescope (EHT). At the time of writing, VLBI reaches arcsecond resolution at 1.4 GHz and 30 microarcseconds at 230 GHz, surpassing the milliarcsecond best optical resolution of e.g. the VLT Interferometer optical telescope. Note, however, that large scale source structure is resolved out by VLBI. It can be imaged at the given frequency using a local array owing to its lower resolution, as illustrated by images of Cygnus A (Fig. 2.3) and its compact radio core region and famous large scale jet.
The science goals of the observation thus dictate the choice between VLBI or an array.
All arrays can in principle operate in two modes: in phased array mode and interferometric mode. Both are fundamentally identical and differ mainly in the final output of the antenna array signal processing. A phased array coherently sums all antenna signals and produces a single high-sensitivity time domain output signal. (Antenna signal phases are adjusted so that geomet- ric propagation delay differences from each antenna towards a chosen position on the sky have been removed. The array is then phase-coherent towards that direction, quite related to beam forming and tracking of the target position under Earth rotation). Conversely, in interferometric mode the antenna phases are also adjusted as described, but the final output is the 3-D spatial coherence of the source radiation incident on the array and can be used for imaging.
To show the scale of the three types of arrays introduced in this Section, representative ex- amples and the locations of some VLBI antennas are shown in Fig. 2.4. For more details, a useful review of modern arrays is given by Garrett & Greenwood (2012) and other articles of the online proceedings of the RTS 2012
1conference.
1Resolving The Sky - Radio Interferometry: Past, Present and Future (http://pos.sissa.it/cgi-bin/
reader/conf.cgi?confid=163)