High Spatial Resolution Millimeter VLBI Studies of the Nearby Radio Galaxies M 87 and 3C 84
INAUGURAL-DISSERTATION
zur
Erlangung des Doktorgrades
der Mathematisch-Naturwissenschaftlichen Fakultät der Universität zu Köln
vorgelegt von Jae-Young Kim
aus Ulsan, Republik Korea
Köln 2018
Tag der letzten mündlichen Prüfung: 11 September 2018
To my beloved parents and sister
사랑하는부모님과동생에게
Abstract
Active galactic nuclei (AGN) are believed to be powered by accretion of gas onto a central su- permassive black hole (SMBH). In particular, a certain fraction of AGN show unusual, dramatic outflows of ionized plasma – relativistic jets – which are extended from the compact central engine region up to millions of light years from the host galaxies. The jets are observationally characterized by superluminal propagation speeds and a highly collimated structure. Recent theoretical studies suggest physical models to explain the origin and evolution of the jets. In spite of the recent progress, however, the extremely small spatial scale of the base of the jet (a few to hundreds of Schwarzschild radii R
s) poses almost unsurmountable difficulties to observe the regions directly.
This thesis presents my work attempting to understand the physics and test observation- ally the existing theoretical models of the central regions based on high spatial resolution observations of selected nearest radio galaxies Messier 87 (M 87, Virgo A, NGC 4486, 3C 274) and 3C 84 (NGC 1275). For this, I employ the technique of very-long-baseline interferometry (VLBI), which allows to resolve the vicinity of the central engine at an ultra-high angular resolution of 50 micro-arcseconds at the high observing radio frequency of 86 GHz (providing a spatial resolution of only 7R
sfor M 87).
In Chapter 1, I present a brief review of the historical and astrophysical backgrounds of AGN and their relativistic jets. Basics of radio astronomical observations and theoretical/practical aspects of VLBI are given in Chapter 2. The main results and conclusions from our studies of M 87 and 3C 84 based on the Global Millimeter VLBI Array (GMVA) observations at 86 GHz are presented in Chapters 3 and 4, respectively.
GMVA observations of M 87 performed between 2004 and 2015 reveal the fine-scale structure of the innermost jet at the highest resolution and sensitivity to date. The following main results are presented in the thesis based on the high-resolution high-fidelity images and other VLBI data of M 87: (i) the substantially low brightness temperature of the compact VLBI core region (whose size is only ∼ 10R
sat 86 GHz), suggesting a magnetic energy dominated jet launching region, (ii) the wide diameter of the jet base ( ∼ (4 − 6)R
s) inferred from the collimation profile of the edge-brightened jet and the slow propagation speed of the inner jet (apparent speed ≲ 1.0 c), indicating that the bright edges of the outflow may originate from the inner accretion disk, (iii) the rapidly increasing brightness temperature of the VLBI core at low observing frequencies (by an order of magnitude from 230 GHz down to 1.6 GHz), which could be a signature of internal microscopic particle accelerations, and (iv) the presence of a faint central lane between the bright edges of the jet, which may correspond to an ultra-relativistic
“spine” of the outflow with a different physical origin.
this frequency to date). Other intensive multi-frequency VLBI observations during 2015 also reveal highly time-variable flux density in the VLBI core region. In this thesis, I particularly focus on the spectral and linear polarization properties and present the following results: (1) a significant detection of linearly polarized features in the VLBI core region at 86 and 43 GHz, whose morphology appears to be highly time-variable on monthly timescales (at 43 GHz), (2) a significant detection of large Faraday rotations in the core region (typical values of rotation measure ∼ 10
(5−6)rad/m
2) and the rotation measure sign change in time, (3) comparisons of the Faraday depolarization models and the observed linear polarization spectrum, which suggests the boundary layer of the jet threaded by ordered magnetic fields as the external Faraday screen, and (4) an estimate of the magnetic field strength and the electron number density in the jet by a joint analysis of the observed Faraday rotation and the synchrotron self-absorption in the core region.
These findings provide a lot of valuable information about the inner structure of M 87
and 3C 84 which was not available before, and these observational data will be served as a
paramount morphological description of the total intensity and polarized emission of these
sources for theoreticians to tune their models. I summarize our main conclusions and suggest
future work in Chapter 5.
Zusammenfassung
Es wird angenommen, das Aktive Galaktische Kerne (AGN) durch Akkretion von Gas auf ein zentrales supermassereiches schwarzes Loch (SMBH) angetrieben werden. Im Besonderen zeigt ein bestimmter Teil von AGNs ungewöhnliche, dramatische Ausströmungen von ion- isiertem Plasma - relativistische Jets - welche sich von dem kompakten, zentralen Motor bis zu Entfernungen von Millionen von Lichtjahren von der Heimatgalaxie erstrecken. Beobachtungen von Jets sind durch Überlichtgeschwindigkeiten und einer sehr kollimierten Struktur gekennze- ichnet. Aus jüngste theoretische Studien folgen physikalische Modelle, welche den Ursprung und die Evolution von Jets erklären. Trotz der aktuellen Fortschritte stellt die unglaublich kleine räumliche Ausdehnung der Jetbasis (einige hundert Schwarzschild-Radien R
s) dennoch eine nahezu unüberwindliche Hürde dar diese Regionen direkt zu beobachten.
Diese Doktorarbeit präsentiert meine Bemühungen die Physik zu verstehen und bestehende theoretische Modelle der zentralen Region durch Beobachtungen mit hoher räumlicher Auflö- sung anhand einer Auswahl der uns am nächsten gelegenen Radiogalaxien Messier 87 (M 87, Virgo A, NGC 4486, 3C 274) und 3C 84 (NGC 1275) zu überprüfen. Hierfür verwende ich die Technik der Very long Baseline Interferometry (VLBI), welche es mir erlaubt die Umgebung des zentralen Motors mit einer ultra-hohen Winkelauflösung von 50 Mikrobogensekunden bei einer hohen Radiofrequenz von 86 GHz aufzulösen (dies resultiert in einer räumlichen Auflösung von nunmehr 7 R
sfür M 87).
In Kapitel 1 präsentiere ich einen kurzen überblick über die historischen und astrophysikalis- chen Hintergründe von AGNs und deren relativistischen Jets. Grundlagen von radioastronomis- chen Beobachtungen und theoretische sowie praktische Aspekte von VLBI sind in Kapitel 2 erläutert. Die wichtigsten Ergebnisse und Schlussfolgerungen unserer Studien von M 87 und 3C 84, anhand von Global Millimeter VLBI Array (GMVA) Beobachtungen bei 86 GHz, sind jeweils in den Kapitel 3 und 4 präsentiert.
GMVA Beobachtungen von M 87, durchgeführt in dem Zeitraum zwischen 2004 und 2015, offenbaren die Feinstruktur des innersten Jets bei der bisher höchsten Auflösung und Sensitivität. Die folgenden wichtigsten Ergebnisse, wie sie in dieser Arbeit präsentiert sind, basieren auf den hoch-aufgelösten Karten mit hoher Genauigkeit und anderen VLBI Daten von M 87: (i) Die erheblich niedrige Helligkeitstemperatur der kompakten VLBI Kernregion (deren Größe gerade einmal ∼ 10R
sbei 86 GHz beträgt), welche nahelegt, dass die Entstehungsregion des Jets von magnetischer Energie dominiert wird; (ii) der große Durchmesser der Jetbasis ( ∼ (4-6) R
s), abgeleitet von dem Kollimationsprofil des an den Rändern helleren Jets und der langsamen Ausbreitungsgeschwindigkeit des inneren Jets (scheinbare Geschwindigkeit ≲ 1.0 c).
Dies gibt Hinweise darauf, dass die hellen Ränder des Jets wahrscheinlich von der inneren
Akkretionsscheibe hervorgehen; (iii) die rapide ansteigende Helligkeitstemperatur des VLBI
Vorhandensein einer schwachen, zentralen Spur zwischen den hellen Rändern des Jets, welche mit einem ultra-relativistischen inneren Teil der Ausströmung übereinstimmt, welche einen anderen physikalischen Ursprung hat.
Die GMVA Beobachtungen von 3C 84 von Mai 2015 bilden die komplizierte innere Struktur des Jets mit einer Auflösung von 250R
sbei 86 GHz ab (mit dem bisher höchsten Kontrast eines Bildes von ∼ 3400 bei dieser Frequenz). Andere intensive Multi-Frequenz VLBI Beobachtun- gen im Laufe des Jahres 2015 haben ebenfalls eine mit der Zeit sehr variable Flussdichte in der VLBI Kernregion offenbart. In dieser Doktorarbeit habe ich meinen Schwerpunkt speziell auf die spektralen Eigenschaften und die der linearen Polarisation gesetzt und präsentiere folgende Ergebnisse: (1) Eine signifikante Detektion von linear polarisierten Strukturen in der VLBI Kernregion bei 86 GHz und 43 GHz, deren Morphologie auf Zeitskalen von Monaten sehr vari- abel ist (bei 43 GHz); (2) eine signifikante Detektion von Faraday-Rotation in der Kernregion (typische Werte des rotation measure (RM) sind ∼ 10
(5−6)rad/m
2) und einer änderung des Vorzeichens des RM im Laufe der Zeit; (3) Vergleich der Faraday-Depolarisations-Modelle und des beobachteten linearen Polarisations-Spektrums, welches eine Grenzfläche des Jets suggeriert. Diese wird durch geordnete magnetische Felder aufgefädelt wie der externe Faraday- Schirm; (4) eine Abschätzung der magnetischen Feldstärke und der Teilchendichte der Elektro- nen im Jet mithilfe einer gemeinsamen Analyse der beobachteten Faraday-Rotation und der Synchrotron-Selbst-Absorption in der Kernregion.
Diese Erkenntnisse stellen neue, sehr wertvolle Informationen über die innere Struktur von
M 87 und 3C 84 zur Verfügung. Diese Beobachtungen fungieren als hervorragende, morpholo-
gische Beschreibung der totalen und polarisierten Intensität dieser Quellen, mit welchen Theo-
retiker ihre Modelle anpassen können. Eine Zusammenfassung meiner wichtigsten Schlussfol-
gerungen und vorgeschlagenen zukünftigen Arbeiten gebe ich in Kapitel 5.
Table of contents
List of figures xiii
List of tables xvii
1 Introduction 1
1.1 Brief history of active galactic nuclei . . . . 1
1.1.1 Modern understanding of AGN . . . . 2
1.2 The central engine . . . . 3
1.2.1 The supermassive black holes . . . . 4
1.2.2 Accretion flow . . . . 5
1.2.3 X-ray corona . . . . 8
1.3 Broad- and narrow-line emission regions . . . . 9
1.4 Dusty torus . . . . 11
1.5 Jets and outflows . . . . 13
1.5.1 Relativistic AGN jet . . . . 14
1.5.2 Non-relativistic disk winds . . . . 23
1.6 Radiation from AGN jets . . . . 24
1.6.1 Synchrotron spectrum . . . . 24
1.6.2 Brightness temperature . . . . 27
1.6.3 Polarization . . . . 27
1.6.4 Relativistic effects . . . . 30
1.6.5 Inverse Compton scattering . . . . 34
1.7 Summary – unification of (nearly all) AGNs . . . . 36
1.8 Main scope of this thesis . . . . 38
2 Radio interferometric observations 41 2.1 Concepts of radio astronomy . . . . 41
2.1.1 Antenna . . . . 42
2.1.2 Feed horns . . . . 43
2.1.3 Receivers and further data processing . . . . 44
2.1.4 Practical calibration procedure . . . . 45
2.2 Radio interferometry . . . . 47
2.2.1 Interferometric response – fringes . . . . 48
2.2.2 Image ⇔ Visibility – 2D Fourier transform . . . . 51
2.2.3 Practicalities of interferometric observations . . . . 54
2.2.4 VLBI polarimetry . . . . 64
3 Millimeter VLBI observations of the radio galaxy M 87 67 3.1 Introduction . . . . 67
3.1.1 Previous studies and motivation . . . . 68
3.2 GMVA 86 GHz observations of M 87 . . . . 72
3.2.1 Observations and data reduction . . . . 72
3.2.2 Results and analysis . . . . 73
3.2.3 Discussions . . . . 83
3.2.4 Conclusions from the GMVA observations . . . . 95
3.3 Multi-frequency VLBI observations . . . . 96
3.3.1 Quasi-simultaneous multi-frequency VLBI observations in 2009 . . . 96
3.3.2 Frequency dependence of the brightness temperature in the M 87 core 108 3.4 KVN multi-frequency VLBI monitoring of M 87 . . . . 113
3.4.1 Observations and data processing . . . . 116
3.4.2 Results and analysis . . . . 118
3.4.3 Discussion . . . . 122
3.5 Summary of the multi-frequency VLBI observations . . . . 123
4 Millimeter VLBI polarimetry of 3C 84 125 4.1 Introduction . . . . 125
4.2 Observations and data reduction . . . . 128
4.2.1 GMVA 86 GHz data . . . . 128
4.2.2 Contemporaneous 43 GHz and 15 GHz VLBA data . . . . 134
4.2.3 Other VLBA 43 GHz data . . . . 135
4.2.4 Contemporaneous ALMA data . . . . 135
4.2.5 Model-fitting, polarization measurements, and their uncertainties . . . 136
4.3 Results . . . . 137
4.3.1 Total intensity structure and the core flux density . . . . 137
4.3.2 Linear polarization in the core region . . . . 140
Table of contents xi 4.3.3 Rotation measure between 43 GHz and 343.5 GHz in May 2015 . . . 142 4.3.4 Rotation measure within the 43 GHz band . . . . 145 4.4 Discussions . . . . 149 4.4.1 Polarization structure . . . . 149 4.4.2 Polarization spectrum and the origin of the large EVPA rotation . . . 150 4.4.3 Faraday depolarization models . . . . 152 4.4.4 Estimation of the jet magnetic field strength and electron density . . . 157 4.5 Summary of conclusions . . . . 159
5 Summary 161
References 167
Appendix A Model-fit parameters of the VLBI core of the M 87 jet obtained by KVN
observations 179
Appendix B GMVA polarization images of the other sources in May 2015 185 Appendix C Multi-epoch VLBA 43 GHz total and linear polarization measurements
of 3C 84 195
List of figures
1.1 Schematic diagram of AGN unification model . . . . 3
1.2 A sketch of the spacetime around a Kerr BH . . . . 5
1.3 Different types of accretion flows versus Eddington ratio . . . . 7
1.4 Illustration of a broad emission line profile in a BH-disk system . . . . 10
1.5 Median quasar composite spectrum in the optical band . . . . 11
1.6 Geometry of AGN torus . . . . 12
1.7 Illustration of jet phenomena in compact astrophysical systems . . . . 13
1.8 Example of structure of an extragalactic jet in M 87 . . . . 16
1.9 Example of jet formation from BH and disk in numerical simulation . . . . . 18
1.10 Conversion of magnetic energy into kinetic power in jets . . . . 19
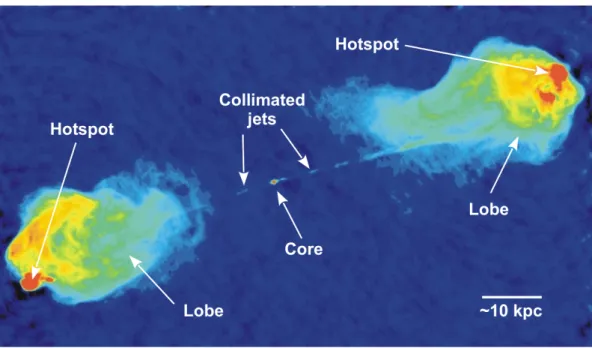
1.11 Example of kpc-scale jet structure in Cygnus A . . . . 21
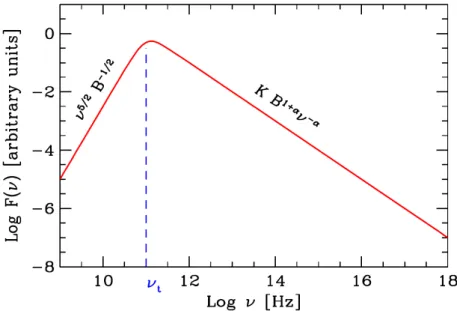
1.12 Synchrotron spectrum of a partially self-absorpbed plasma . . . . 26
1.13 Schematic illustration of a typical AGN jet polarization morphology . . . . . 29
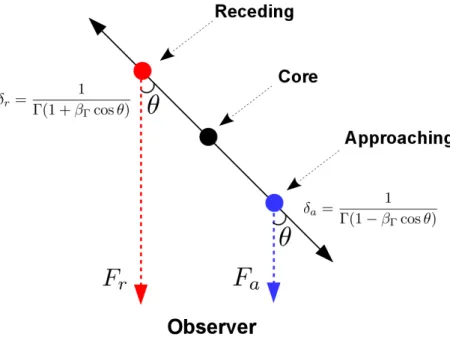
1.14 Relativistic beaming . . . . 31
1.15 Doppler boosting effect . . . . 32
1.16 Geometry of relativistic beaming in a bipolar jet . . . . 33
1.17 Flux density ratio of the jet and counter-jet . . . . 33
1.18 Apparent superluminal jet speed versus viewing angle . . . . 34
1.19 Example of apparent superluminal motion . . . . 35
1.20 Example of broadband SED variabilities of a blazar 3C 454.3 . . . . 36
1.21 Summary of the AGN categories . . . . 37
2.1 Diagram of data acquisition and analysis . . . . 42
2.2 Beam pattern of an antenna . . . . 43
2.3 Block diagram of data acquisition and process . . . . 45
2.4 A photo of ALMA band-8 receiver box . . . . 46
2.5 Illustration of the fundamental idea of interferometry . . . . 49
2.6 Two element interferometer . . . . 50
2.7 Definition of the coordinates (l, m, n) in the sky and (u, v, w) for the baseline . 52
2.8 Example of FFT fringe fitting . . . . 57
2.9 Incomplete (u, v) sampling and the corresponding synthetic beam . . . . 59
2.10 Example visibility distribution and dirty map . . . . 60
2.11 Final dirty and C LEAN maps . . . . 62
3.1 Hubble Space Telescope image of M 87 . . . . 69
3.2 Proper motions of bright components in the inner jet of M 87 . . . . 70
3.3 Illustration of Global Millimeter VLBI Array . . . . 71
3.5 Radial dependence of the visibility amplitude of the 2015 data . . . . 75
3.6 GMVA images of M 87 . . . . 76
3.7 Stacked M 87 jet images and transverse intensity profiles . . . . 79
3.8 Averaged transverse jet intensity profile . . . . 80
3.9 M 87 jet base collimation profile . . . . 81
3.10 Illustration of the central engine and the 86 GHz core geometry . . . . 82
3.11 Gradient of the jet to counter-jet intensity ratio (R) . . . . 84
3.12 Diameter of the jet base at a distance of 1R
sfrom the BH center as a function of positional offset ε . . . . 88
3.13 Possible range of M 87 jet viewing angles and jet speeds . . . . 92
3.14 Bulk Lorentz factor of the inner jet of M 87 . . . . 93
3.15 Doppler factor versus Lorentz factor for the spine . . . . 94
3.16 VLBA 43 GHz and 15 GHz images of the jet of M 87 in 2009 . . . . 98
3.17 GMVA 86 GHz image of the jet of M 87 recovered by the model-fitting . . . 101
3.18 The same as Fig. 3.17 but for the VLBA 43 GHz data . . . . 102
3.19 The same as Fig. 3.17 but for the VLBA 15 GHz data . . . . 103
3.20 Arc-second scale ALMA flux measurements of the M 87 core synchrotron spectrum between 221 GHz and 635 GHz in 2012 . . . . 105
3.21 The VLBI core synchrotron spectrum between 43 GHz and 230 GHz in 2009 106 3.22 Kinematics of the inner M 87 jet in 2009 . . . . 109
3.23 Apparent inner M 87 jet velocity versus the core separation . . . . 110
3.24 Brightness temperature of the core of M 87 at different frequencies . . . . 114
3.25 Doppler factor versus bulk Lorentz factor . . . . 114
3.26 Multi-frequency core flux density light curves obtained by the KVN observations119 3.27 KVN visibility amplitudes of M 87 as a function of (u, v) distance at 43 GHz . 119 3.28 Spectral index light curve of the core of M 87 (S ∝ ν
+α). . . . 120
3.29 Radio spectrum of the M 87 core region in log-log scale . . . . 121
List of figures xv 4.1 Hubble Space Telescope and VLBI images of the host galaxy NGC 1275 and
the radio source 3C 84 . . . . 126
4.2 Stokes I visibilities of the GMVA 86 GHz data of 3C 84 . . . . 131
4.3 Polarimetric VLBI images of 3C 84 at 15 GHz and 43 GHz . . . . 138
4.4 GMVA 86 GHz images of 3C 84 . . . . 139
4.5 Transverse jet intensity profiles at 43 GHz and 86 GHz . . . . 140
4.6 Total intensity spectrum of the VLBI core region between 15 GHz and 86 GHz. 140 4.7 VLBA 43 GHz core flux density and the peak values of 3C 84 during 2015 . . 141
4.8 Comparison of the total intensity, the polarized intensity, and the polarization angle in the nuclear region at 43 GHz and 86 GHz . . . . 141
4.9 VLBA 43 GHz polarization images of 3C 84 zoomed into the core . . . . 143
4.10 Spatially integrated EVPA versus the squared wavelength and the best λ
2fit in May 2015 . . . . 145
4.11 43-86 GHz RM distributions of 3C 84 . . . . 146
4.12 Variation of the measured EVPA in 4 sub-bands of the VLBA 43 GHz observing band at different observing epochs . . . . 147
4.13 EVPAs of 3C 84 versus the squared wavelength λ
2within the VLBA 43 GHz band . . . . 148
4.14 Slice profiles of the total intensity, linear polarization intensity, and degree of linear polarization at 86 GHz . . . . 150
4.15 Degrees of linear polarization of 3C 84 from this work, previous VLBA ob- servations, and spatially integrated single-dish or connected-interferometer observations from the literature . . . . 151
4.16 Upper limits for m
Lfor external (Case I and II) and internal (Case III) Faraday depolarization and the VLBI polarization from observations . . . . 154
4.17 Illustration of the geometry discussed throughout Sect. 4.3.3 and 4.4.3 . . . . 156
B.1 0716+714. . . . 186
B.2 3C 111. . . . 187
B.3 3C 120. . . . 188
B.4 3C 273. . . . 189
B.5 3C 279. . . . 190
B.6 3C 454.3. . . . 191
B.7 BL Lac. . . . 192
B.8 CTA 102. . . . 193
B.9 OJ 287. . . . . 194
List of tables
3.1 Summary of the GMVA 86 GHz observations of M 87 . . . . 74
3.2 VLBI core model-fit parameters at 86 GHz . . . . 77
3.3 Brightness temperature ratio and the magnetic field strength . . . . 86
3.4 M 87 jet component parameters obtained by the multi-Gaussian model-fitting 104 3.5 Synchrotron spectrum model-fit parameters . . . . 107
3.6 A summary of the jet component kinematics . . . . 110
3.7 Gaussian modelfit properties of the VLBI core of M 87 at different frequencies 115 4.1 Summary of the polarimetric VLBI observations of 3C 84 in May 2015. . . . 130
4.2 Summary of the GMVA antenna D-terms at 86 GHz . . . . 133
4.3 Summary of the ALMA archival data . . . . 136
4.4 VLBI model-fit core properties of 3C 84 in May 2015 . . . . 138
4.5 Properties of the polarized components of 3C 84 in May 2015 . . . . 144
4.6 Rotation measure within the VLBA 43 GHz band . . . . 147
A.1 KVN observing epochs and M 87 core model-fit parameters . . . . 180
A.1 Continued. . . . 181
A.1 Continued. . . . 182
A.1 Continued. . . . 183
C.1 Properties of the polarized components of 3C 84 obtained for the four different IFs of the VLBA 43 GHz data . . . . 196
C.2 Stokes I core flux density, the peak, and the core FWHM size during 2015
measured from the VLBA 43 GHz data of 3C 84 . . . . 196
Chapter 1 Introduction
1.1 Brief history of active galactic nuclei
Active galaxies are, like normal galaxies, systems of stars, gases, and dust that are bound to each other by self gravity. However, active galaxies contain peculiar nuclei (active galactic nuclei; hereafter AGN), which are characterized by their extreme luminosity and compact size.
A brief history about pioneering studies of AGN is outlined below to illustrate basic properties of AGN.
One of the first systematic observations towards AGN was made by Seyfert (1943) when extragalactic objects were still often called as nebulae due to their nebulous aspect. The author reported that the velocity dispersion of the observed galaxy optical emission lines is
∼ 8500 km/s. Such a large velocity dispersion was later interpreted as extreme motion of
ionized gas in the galactic nuclei (Burbidge et al., 1959). Woltjer (1959) also pointed out that
bright galactic nuclei emitting the broad emission lines are spatially extended only over ∼ 100
parsec scales. This implies a large dynamical mass of 100 million solar masses to hold the
ionized gases moving at high speed. Galaxies showing such optical emission lines were later
named as Seyfert galaxies. Independently, novel techniques were developed to observe celestial
sources at radio wavelengths in the 1930s. Karl G. Jansky detected the serendipitous radio
emission from outside our solar system for the first time (Jansky, 1933). Its origin was later
identified as the center of our galaxy. In the 1950s, a number of extragalactic objects were
identified in radio wavelengths by the Third Cambridge Catalogue of Radio Sources (3CR)
survey. However, the origin of extragalactic radio emission remained elusive because it was
difficult to match their poorly determined radio positions with photographic images. This
occasionally confused astronomers (see, e.g., Baade & Minkowski 1954 for the case of Cygnus
A). It was 1963 when Maarten Schmidt discovered that the radio source 3C 273 was associated
with an optically unresolved, star-like bright object (Quasi-Stellar Object; QSO) (Schmidt,
1963). The source was emitting highly red-shifted optical emission lines. The high red-shift suggested that the star-like object (and the radio counter-part) is located at a cosmological distance. Another interesting aspect of this finding was that the star-like object was nearly 100 times brighter than typical host galaxies of similar radio sources. Thus, it became clear that both the QSO and the quasi-stellar radio source 3C 273 (Quasar) were associated with an ultra-luminous nucleus in a distant extra galaxy, i.e., an AGN. Indeed, AGNs are typically ultra- luminous so that they can easily outshine their host galaxies in the distant universe and appear to the observer in the optical just like starts. New observational studies followed. Sandage (1965) found a large number of AGNs at even higher redshifts. It was also found that a large fraction of QSOs do not have radio counterparts. This implies that AGNs do not always produce radio emission. Later, this idea led to the classification of radio-loud and radio-quiet AGN.
Based on observational progress, new theoretical questions were posed. The most intriguing question among them was the possible source of the extraordinary high luminosity observed.
Several explanations were suggested. Burbidge (1961) proposed a chain reaction of supernovae explosions in a dense star cluster in a galactic nucleus. Spitzer & Saslaw (1966) also suggested frequent stellar collisions and tidal encounters in a dense star cluster and release of large amount of gases and energies. Notably, Hoyle & Fowler (1963) proposed the possibility of powering AGN by gravitational potential energy via mass accretion onto a stellar-type object of large mass. It was soon realized that mass accretion is a highly efficient process for a given small volume. Later, researchers suggested more specific scenarios such as mass accretion onto supermassive black holes (SMBHs) in the center of active galaxies because SMBHs were able to hold large amount of mass in a small volume (Salpeter, 1964; Zel’dovich & Novikov, 1964; Lynden-Bell, 1969; Lynden-Bell & Rees, 1971). A model of an accretion disk around a
SMBH successfully explained the non-stellar origin of radiation in nearby Seyfert galaxies (e.g., Lynden-Bell 1969) and their X-ray emission observed by early astronomical X-ray observations as well (see Beckmann & Shrader 2012 and references therein).
A more detailed review about the history of AGN research can be found in the following literature; Urry & Padovani (1995); Shields (1999). In the next sections, I will provide additional, more recent physical explanations about AGNs based on the present understanding of their astrophysical processes.
1.1.1 Modern understanding of AGN
Since the early discoveries of AGNs, our knowledge has evolved significantly by cutting-edge
observations and state-of-the-art theories. Figure 1.1 provides a schematic illustration of how
we understand an AGN and its sub-components. The current paradigm of AGN is largely
based on this picture, which is the so-called AGN Unification Model (Urry & Padovani, 1995).
1.2 The central engine 3
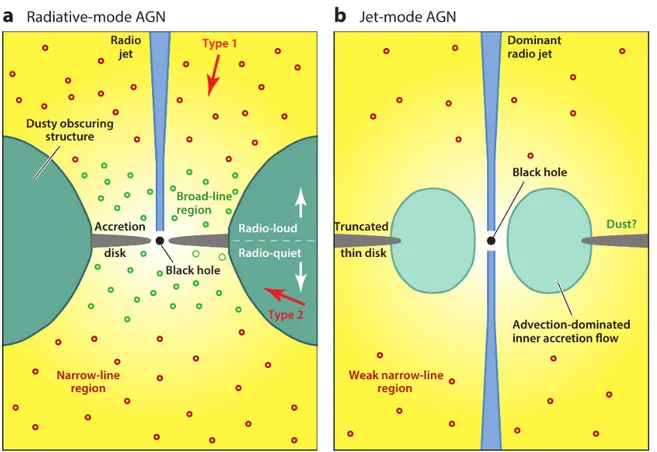
Fig. 1.1 A schematic diagram showing the geometry of several elements that constitute a typical AGN. (a) : For a radiative-mode AGN with weak or no radio jet. (b) : For a jet-mode AGN with a prominent radio jet but weak or no line emissions. The figure is not drawn to scale. Figure taken from Heckman & Best (2014).
The model explains variety of AGN properties by adopting intrinsically the same AGN but viewed at different angles by observers. From §1.2 to §1.5 we describe the basic properties of each individual component in more detail. In §1.6 we discuss the radiation processes in AGN, particularly focusing on emission mechanisms related to AGN jets. Then, we discuss in §1.7 how different viewing angles give rise to different AGN classes (and what are still not clearly understood).
1.2 The central engine
The central engine converts the gravitational energy of accreting gas into radiation and triggers
outflows of plasma. The central engine is the main source of the deep gravitational potential
which attracts gas spiralling around and falling onto the central supermassive black hole.
1.2.1 The supermassive black holes
Supermassive black holes (SMBHs) are a scaled-up version of typical astrophysical black holes such as stellar mass black holes. As the name implies, SMBHs have extraordinarily large mass ranging between 10
6− 10
10M
⊙where M
⊙≈ 2 × 10
33g is the solar mass. It is also remarkable that SMBHs are supposed to reside not only exclusively in AGNs but also in many other types of galaxies. One of the best examples is the Milky Way. A massive BH named as Sagittarius A*
resides at the center of our galaxy and its mass is accurately measured (M
BH∼ 4.3 × 10
6M
⊙based on Keplerian motions of stars orbiting the BH; see, e.g., Gillessen et al. 2009). It is still not fully understood how SMBHs were able to accumulate such a large mass over the cosmic time. However, several evolutionary pathways to produce SMBHs have been proposed during the last decades. The scenarios basically suggest that SMBHs and/or their seeds were formed in the early universe when primordial cold gases in proto-galaxies condensated due to gravity of dark matter halo (see, e.g., Volonteri 2012). An observationally found strong correlation between mass of the SMBHs and the host galaxy stellar mass also indicate that there have been strong interplay between the SMBH and host galaxies during their evolution over cosmic time (see Heckman & Best 2014 for a review).
SMBHs can be characterized by two main parameters – their mass (M
BH) and spin (a)
1. The mass is a dominant factor in determining the size of the event horizon. The event horizon of a non-rotating BH is characterized by the Schwarzschild radius R
swhich is the radius of a spheri- cal BH sphere. R
sis given by R
s= 2GM
BH/c
2≈ 3(M
BH/M
⊙) km where G is the gravitational constant and c is the speed of light. This implies that more massive BHs are simply larger, being the radius directly proportional to the mass. It is also useful to define the gravitational radius R
g= GM
BH/c
2and express R
sby R
s= 2R
gbecause R
gis independent of the BH spin. On the other hand, SMBHs in galaxies presumably have non-zero spin because of their astrophysical origin. The BH spin a is expressed in a normalized form by a = (Jc)/(GM
BH2) where J is the BH angular momentum (i.e., 0 ≤ a ≤ 1). A non-zero BH spin has an important implication because it changes the structure of the spacetime near the event horizon as well as the size of the event horizon itself. A sketch of the spacetime near a spinning black hole is presented in Fig. 1.2. The radius of the event horizon of a spinning BH R
kis smaller than that of the non-spinning BH:
R
k= 2GM/c
2× (1 − p
1 − a
2) = 2R
g(1 − p
1 − a
2) . (1.1)
1
In theory, BHs can have certain non-zero net electric charge
Q. However, astrophysical BHs haveQ≈0
because they form out of stars, compact objects, and gaseous interstellar medium, all of which have no net electric
charge.
1.2 The central engine 5
Fig. 1.2 A sketch of the spacetime around a Kerr BH.
Outside the event horizon is a region in which BH rotation causes the inertial frame to be dragged in the direction of the BH spin (thus accelerating a test particle in this region). This phenomenon is called Lense-Thirring effect and also known as frame-dragging (see, e.g., Misner et al. 1973). This region is called ergosphere and has a radius of
R
e= R
g(1 − p
1 − a
2cos θ ) (1.2)
where θ is the angle measured from the pole of the rotation. We note that R
eis always greater than R
k. This implies that matter falling towards BH can enter this region and also escape to outside if sufficient escape energy is provided. This is indeed possible because matter orbiting around the BH within the ergosphere can extract rotation energy of the BH via the Blandford- Znajek mechanism (Blandford & Znajek, 1977). This has important implications for the physics of the mass accretion (§1.2.2) and outflows (§1.5) in the central engine of AGN.
1.2.2 Accretion flow
Gas in the vicinity of the central engine falls towards central BH due to the strong gravitational potential. In astrophysical circumstances, the gas has non-negligible angular momentum with respect to the central BH. Therefore, the gas forms a rotating flow. The rotating flow has different rotation speeds at different radial distances as a consequence of the Keplerian motion.
Therefore, various kinds of viscosities are naturally developed between different layers. The
viscosity gradually transports the angular momentum in the inner region to outward. This helps
the gas finally plunge into the BH. Such kind of inflow is broadly called accretion flow.
Observational evidence for the presence of accretion flows in AGNs includes the large bolometric luminosity of AGN and shape of the spectral energy distribution (SED) in the optical and ultraviolet wavelengths (e.g., Malkan & Sargent 1982). Broadband SEDs of AGNs typically show a big bump of continuum emission in the form of the so-called Big Blue Bump.
The optical continuum SED of BH accretion flow can be understood as following. Near the BH, the rotation velocity of accretion flow becomes very high and the viscosity effect is also strong.
This makes the gas temperature high (e.g., ≳ 10
4K) and the exact flow temperature depends on the distance from the BH. Given that the accretion disk is optically thick, the emission spectrum of a local region in the disk can be approximated by that of a black body with the disk temperature. The sum of the black body spectra with different disk temperature gives rise to the excess ultraviolet emission from the entire accretion disk. Similarly, the SEDs of accretion disks can be decomposed into several black body spectra with typical temperatures of 10
4−7K or even higher.
There are several macroscopic, phenomenological parameters describing accretion flows in AGNs. The first parameter is the mass accretion rate ˙ M which is also simply called accretion rate. For spherical mass accretion, the total amount of gas captured by the central engine is predominantly determined by the total mass within a critical radial distance where the velocity of a test particle v (or the sound speed of environmental gas c
swhen v < c
s) is equal to the escape velocity. Bondi (1952) shows that the mass accretion rate is then
M ˙ = 4π ρ G
2M
BH2c
3s(1.3)
where ρ is the ambient gas density. The second parameter is the bolometric luminosity of the accretion flow L. Accretion flows produce radiation and the radiation energy primarily comes from the gravitational potential energy of the accreting gas. It is therefore useful to express the luminosity in terms of the rest mass energy of the accretion rate ˙ M such that L = η Mc ˙
2where η is the efficiency of the energy conversion process. Although the exact value of η depends on a number of details, typical values are η ∼ 0.1 for the geometry of BH accretion systems. This is far greater than that of the nuclear fusion of hydrogen into helium, η ∼ 0.007. Thus, mass accretion is a very efficient mechanism to power AGN. The third parameter is a characteristic upper limit of the luminosity of the accretion. The luminosity upper limit and the accretion rate are closely related because the disk radiation produces an outward pressure against the gravitational force acting on the infalling gas. For an accretion flow with spherical geometry, this upper limit is called Eddington luminosity and is given by
L
Edd= 4πGcM
BHκ
es(1.4)
1.2 The central engine 7
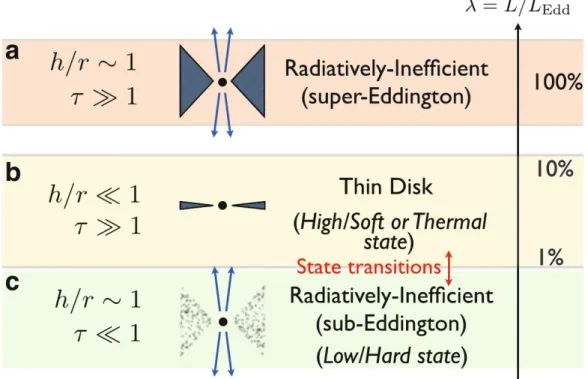
Fig. 1.3 Different types of accretion flows depending on the Eddington ratio. The figure taken from Tchekhovskoy (2015).
where κ
es∼ 0.4 cm
2g
−1is the electron scattering opacity. If the BH mass is known a priori, one can compare the observed disk luminosity with L
Eddand compute the Eddington ratio by λ = L/L
Edd. Similarly, one could also define the corresponding mass accretion rate, the Eddington accretion rate, M
Edd˙ = L
Edd/η c
2. The Eddington ratio and accretion rate are useful to understand the state of the mass accretion (see 1.3).
Finally, the innermost stable circular orbit (ISCO) distinguishes BH accretion flow from other similar flows. This is because the effective gravitational potential of BH differs from that of Newtonian cases. When a test particle approaches the BH closer than the ISCO, the particle cannot maintain a stable orbit any more and plunges into the BH. For a continuous flow, this implies a truncated inner edge of the disk. Therefore the ISCO defines the minimum inner radius of a rotating accretion flow. Depending on the BH spin a, the ISCO radius ranges between (1 − 6) × R
gfor a = (1 − 0) where R
gis the gravitational radius
2.
The above descriptions are useful to understand the basic properties of the accretion flows.
However, it is also important to note that the detailed microphysics of rotating and magnetized plasma is highly complicated. For instance, the presumed viscosity in the accretion disk is a complicated process involving a number of different physical mechanisms. So far, the most
2
This is for the case of a prograde black hole and accretion disk system. In the retrograde case, the ISCO
radius is
(6−9)
×Rgfor
a=−(1−0).
realistic and dominant process driving the viscosity is considered to be magnetorotational instability (MRI; Balbus & Hawley 1991). Also, in the strong magnetic field case, the accretion flows are not only subject to the gravitational potential of the BH but the fields themselves also become dynamically important (see Zamaninasab et al. 2014 and references therein).
The thermodynamics of the accretion flow is also important. It is possible that the viscously dissipated energy is not converted into radiation but rather heats the particles by advection (Ichimaru, 1977). Other microphysical processes such as magnetrohydrodynamic (MHD) turbulence, magnetic reconnection, and pressure anisotropy in a collisionless plasma are also able to do so. In fact, observations often find a large X-ray to optical bolometric luminosity ratio and frequent absence of the excess of ultraviolet emission (i.e., the big blue bump).
They suggest that non-standard disk-like accretion flows do exist in a number of AGNs. Such accretion flows are often called advection dominated accretion flows (ADAFs) (Narayan & Yi, 1994) or more broadly hot accretion flows (see Yuan & Narayan 2014 for a review).
To summarize, there exist two main types of accretion flows : (i) relatively cold plasma with thin and disk-like geometry (electron temperature T
e∼ 10
4K; Shakura & Sunyaev 1973 and see also Blaes 2014 for a brief review) and (ii) hot plasma with thick disk with large disk height to disk radius ratio (T
e∼ 10
10K; see Yuan & Narayan 2014). Those models are successful in explaining various types of AGNs which are believed to be in different phases of their evolution.
In particular, the hot accretion flow appears to be crucial for the formation and propagation of jets and outflows (§1.5).
1.2.3 X-ray corona
Based on the existence of ubiquitous hard X-ray continuum emission in AGN (i.e., photon energy ≳ 10 keV), astronomers have suggested the existence of a coronal medium on top of the AGN accretion disk (see Uttley et al. 2014 for a review). The corona most likely contains energetic electrons and produces X-ray radiation by inverse Compton scattering of seed photons from accretion disks. In addition, the continuum X-ray photons ionize gas in the accretion disk.
This results in highly ionized iron and other emission lines, which are frequently observed at X-ray energy spectrum. It is unclear if the corona is just a part of the hot accretion flow or it is a group of clouds floating above the disk. However, studies suggest that the X-ray corona is often located very close to the BH ( ∼ 10R
g).
One of the important merits of observing the X-ray corona emission is that it allows us
to indirectly probe geometry and properties of the inner BH accretion disk. For instance, as
explained above, the observed X-ray emission originates not only from the corona itself (which
emits a power-law continuum) but also from the inner accretion disk (which emits highly
ionized emission lines). The latter lags behind the former because of additional geometric
1.3 Broad- and narrow-line emission regions 9 pathlengths. This time lag depends on the spatial extension of the highly ionized regions in the disk (e.g., located within a few to tens of R
gfrom the BH). Thus, the time-series analysis of the X-ray continuum and line emission can constrain the geometry of the inner accretion disk. This technique is called the X-ray reverberation mapping (see Uttley et al. 2014 for technical details).
On the other hand, detailed shape of the line emission profile also contains a lot of information.
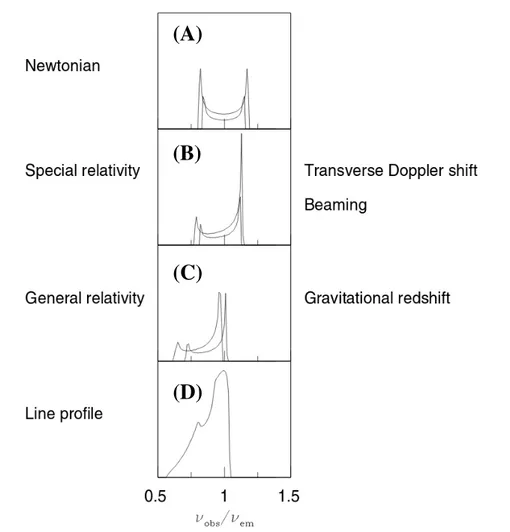
The line profiles are influenced by (i) Doppler shift from the relativistic beaming due to the fast disk rotation and (ii) gravitational redshift due to the deep gravitational potential of the central BH. Therefore, it is possible to build a model of the line profiles based on the above effects. An example of the resulting line emission is shown in Fig. 1.4. Observational studies measure the time lags and model the disk geometry including the BH spin effect (Brenneman
& Reynolds, 2009). Now the X-ray reverberation phenomena are found in ∼ 50% of all X-ray detected Seyfert galaxies (Kara et al., 2016). It is also important to note that such measurements are not possible at longer observing wavelengths because of heavy obscuration of the inner accretion disk by the presumed dusty torus (see §1.4).
1.3 Broad- and narrow-line emission regions
The gravitational potential of the central engine is strong enough to hold ambient gas at even larger distances from the central BH. The gases are strongly bound to the system and move at high speed. They can be also photo-ionized by the strong continuum radiation from the accretion disk. Therefore, the gases produce unique emission lines with very large line widths.
Typical full-width-half-maximum (FWHM) widths of observed hydrogen Balmer lines are typically ∆v ≳ 1000 km s
−1(see Fig. 1.5). Because of the broad widths of such lines, a region containing these gases is called broad line region (BLR). It is unclear if the gases are a group of randomly moving clouds or if they form an organized stream surrounding the central engine.
But it is remarkable to note that thermal Doppler broadening cannot reproduce the observed Hα or Hβ line widths because the corresponding kinetic temperature of T ∼ 10
7K to 10
8K should ionize almost all hydrogen in the gas. This indicates that the broad lines are produced by bulk, Keplerian random motions of the gases under strong gravity.
Another interesting feature of the BLR is that the broad line luminosity is time-variable
and the variability is correlated with the variable continuum radiation from the disk. The line
variabilities lag behind the disk luminosity by usually a few weeks to several months (or even
years). This provides an estimate of the distance of the gas from the BH. The mass of the central
BH responsible for the gravitational potential can be estimated from the observed Keplerian
velocities based on the Virial theorem by M
BH≈
τcGf ∆v
2where τ is the time lag and f is a
scaling factor that depends on the geometry. This technique is called Reverberation mapping
(A)
(B)
(C)
(D)
Fig. 1.4 Illustration of a broad iron line profile in a BH-disk system. (A) The line profile of one annulus in the disk without relativistic effects, (B) The same line profile affected by relativistic Doppler boosting. (C) The same profile as (B) after accounting for the gravitational redshift.
(D) A synthetic line profile of a disk ring generated by the sum of many orbits. The figure has been taken from Fabian (2008).
and gives a good estimate of the BH mass. Studies based on this method reveal wide range of the BH masses with M
BH∼ 10
6− 10
9M
⊙(see, e.g., Bentz et al. 2009).
In addition, some lines have relatively narrower widths (∆v of hundreds of km s
−1). Inter- estingly, the narrow lines are much less time-variabile. The gas responsible for this emission is considered to be located in the so-called narrow line region (NLR). The narrower widths and smaller velocities suggest the NLR is located farther from the BH than the BLR. Lack of the time variability also indicates that the gas in the NLR is kinetically separated from the BLR.
An example of a quasar line spectrum showing the BLR and NLR signatures is displayed in
Fig. 1.5.
1.4 Dusty torus 11
Fig. 1.5 Median quasar composite spectrum derived from the Sloan Digital Sky Survey. Note the broad Hβ and narrow [OIII] emission lines. The figure has been taken from Vanden Berk et al. (2001).
The different spatial extension of BLR and NLR makes another crucial observational difference. The broad lines are often missing in the observed spectrum in contrast to the narrow lines, which are observed in a number of Seyfert galaxies. The former and latter types of AGN are called type 1 and type 2, respectively. It is assumed that this difference is due to dusty torus whose thickness is sufficient to obscure the BLR cloud emission from close to the central engine. This difference leads to the development of the unified scheme.
1.4 Dusty torus
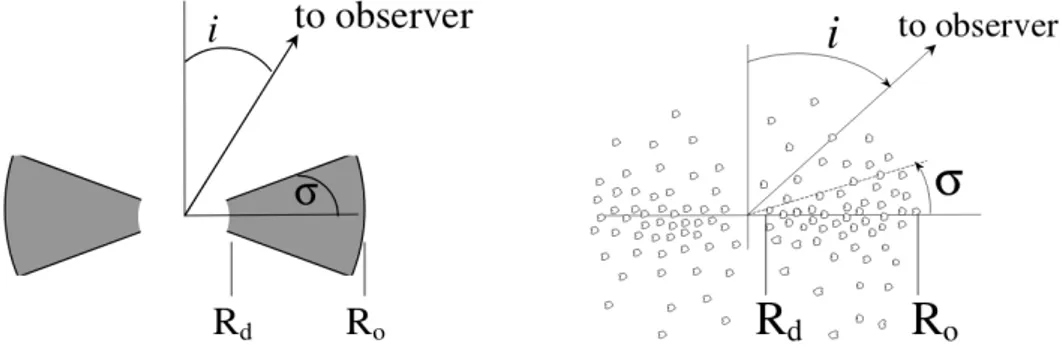
The torus is a key element in the unified model of AGN (Urry & Padovani, 1995). It mainly consists of dust and gas with different temperatures. As the name implies, the torus has a toroidal structure and surrounds the central engine (see Fig. 1.6 for an illustration). AGN tori are considered to have a finite thickness and obscure emission from the BLR, when the AGN is observed at a large inclination with respect to the line of sight (i.e., close to edge- on view). Statistical studies of type 1 and 2 sources suggest that a torus thickness-to-radius ratio H /R ∼ 1 (and the corresponding viewing angle i ∼ 45
◦) can explain the observed AGN population ratio (Schmitt et al., 2001). The torus obscuration is also seen in the soft X-ray band ( ∼ 1 keV), implying that the column density of the dust is sufficiently large to scatter soft X-ray photons produced by inner accretion disk and corona away. For hard X-rays, the torus generally appears transparent and the obscuration is very weak (e.g., Gilli et al. 2001). However, very large torus column density of N
H≳ 10
24cm
−2could obscure even hard X-ray emissions (i.e.,
“Compton-thick” torus; see Comastri 2004).
It is also important to note that the internal structure of the torus could be complex. Several
observational evidences – e.g., presence of cold dust ( ∼ 200 − 300 K) close to the central
Fig. 1.6 Geometry of AGN torus. Left : a torus with smooth density. Right : a torus with clumped gases. Figure from Elitzur (2007).
engine, isotropic infrared emission from the torus, and peculiar X-ray absorption properties – suggest that the torus dusts and gases may be clumpy (Fig. 1.6, right; see Elitzur 2007).
The luminosity of inner accretion disk also affects the obscuration geometry because the disk radiation sublimates dust in the inner edge of the torus. For higher-luminosity AGN, the inner wall recedes away from the central BH and the obscuration effect is weaker (i.e., larger fraction of type 1 sources; Simpson 2005).
A crucial evidence for the existence of the torus and its obscuration was obtained by detection of linearly polarized broad emission lines in type 2 Seyfert galaxies. Even though the broad optical lines are heavily obscured by the dust and thus not directly observed, electron scattering by molecules in the dust and gas can reflect the emission without absorbing them.
Eventually, the scattered broad lines can escape from the central engine region and be observed.
An important observational signature of the scattering is that it induces linear polarization in the broad line emission. In fact, Antonucci & Miller (1985) first discovered linearly polarized broad lines in the Seyfert 2 galaxy NGC 1068 and suggested unification of type 1 and 2 sources following the ideas discussed above. We also note that strong free-free absorptions in the counter-jet regions of several AGNs suggest a disk-like geometry of the screening medium (e.g., see §1.5 of this thesis and Krichbaum et al. 1998; Walker et al. 2000).
Last but not least, it is worth noting that the origin of dusty tori in AGNs is still not yet fully
understood. Theories suggest that the formation of the torus involves gas and dust transported
from the outer accretion disk, direct feeding of molecular gas from the host galaxy, and/or
molecular clouds vertically outflowing from the outer accretion disk (see Beckmann & Shrader
2012 for a brief review). In spite of theoretical challenges in understanding the origin of
the torus, recent millimeter/sub-millimeter observations with sensitive telescopes such as the
Atacama Large Millimeter/submillimeter Array (ALMA) started to directly resolve the torus
structure in nearby AGNs and reveal complex, dynamical evolution of the toroidal gas structure
(see, e.g., García-Burillo et al. 2016).
1.5 Jets and outflows 13
Fig. 1.7 Illustration of jet phenomena in compact astrophysical systems over a wide range of central masses. The figure has been taken from Tchekhovskoy (2015).
1.5 Jets and outflows
Bipolar outflow phenomena are commonly seen in compact astrophysical systems across all ranges of central masses. Typical examples are young and protostellar objects (typical central mass ∼ 1M
⊙), evolved stellar binaries and massive stars associated with gamma-ray bursts (a few to 10M
⊙), and most remarkably the centers of active galaxies ( ∼ 10
6M
⊙to 10
10M
⊙).
Figure 1.7 provides an illustration of the astrophysical jets and outflows, including those in
the still poorly understood intermediate-mass BH systems whose typical BH mass is in the
range of ∼ 10
(2−5)M
⊙. Certainly, these systems differ in many aspects. However, they have
a similarity in that the outflow phenomena commonly involve accretion of mass onto central
compact object. For instance, observations reveal that the jet radio luminosity, the disk X-ray
luminosity, and the BH mass strongly correlate over many orders of magnitude of BH masses
(from M
BH≲ 10
2M
⊙to M
BH≳ 10
9M
⊙; Merloni et al. 2003). The correlation implies a tight
connection between the BH, accretion disk, and relativistic jet, suggesting that the fundamental
physics of the jet phenomena might be the same in all the compact objects. In this section, let
us particularly focus on the phenomenology and physics of jets and outflows in AGNs, since
those are deeply associated to the main focus of this thesis.
1.5.1 Relativistic AGN jet
A relativistic jet is an outflow of ionized plasma concentrated in a narrow beam (opening angle
≲ a few degrees on kpc-scales). In particular, jets in AGN are characterized by their highly collimated structure and relativistic propagation speeds (close to the speed of light). The typical kinetic power of the jet ranges between 10
43− 10
49erg s
−1(e.g., Ghisellini et al. 2014), which corresponds to ∼ 10
9− 10
15L
⊙where L
⊙∼ 3.8 × 10
33erg s
−1is the solar luminosity. This is comparable to or even larger than the luminosity of most massive host galaxies of AGNs.
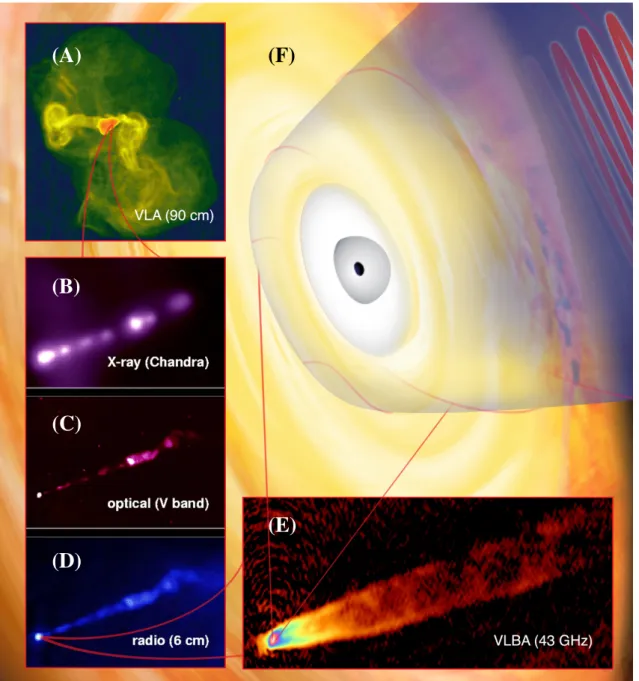
Figure 1.8 shows an example of an extragalactic jet in the nearby radio galaxy M 87, which is
one of the first discovered jets (Curtis, 1918). The figure shows a jet originating from the central
engine within ≪ 1 pc from the BH and propagating up to kpc-scales without disruption. The
jet emits radiation from radio to optical and X-ray wavelengths. The jet also produces photons
even up to GeV and TeV energies by the inverse Compton scattering or by intrinsic hadronic
processes within the jet. In the nearby Universe, jets are found in approximately 10% of AGNs
(e.g., Heckman & Best 2014). This small fraction is intriguing and suggests that (i) relativistic
jets are a universal phenomenon in active galaxies, but (ii) their formation requires certain
conditions. Indeed, jets are found in AGNs with quite low Eddington ratios (L/L
Edd< 0.01) and
very massive central BHs. One clear difference between low- and high-Eddington ratio AGNs
is that the geometry and physical properties of the accretion flow are substantially different
(see §1.2.2). This indicates that ADAF-like hot accretion flows may play an important role in
the jet formation. Relativistic AGN jets contain large amount of kinetic energy and the jets
can affect the phase of the interstellar medium in the host galaxy. For instance, the typically
observed temperature of the diffuse hot gas in a galaxy cluster is T ∼ 10
7− 10
8K. For such a
high temperature, the gas quickly looses its internal kinetic energy by emitting bright X-ray
radiation and falls towards the center of the galaxy cluster due to the gravity. The cooling time
of the hot intracluster medium, i.e., a typical timescale needed for the gas to loose its internal
energy by radiation, is ≲ 10
8yr. However, this is extremely short compared to the age of the
Universe ( ∼ 10
10yr). The large discrepancy between the two timescales makes it difficult to
understand why many galaxy clusters still host the hot intracluster medium and how the clusters
maintain the high temperature of the ambient gas against the high cooling rate. This is known
as the cooling flow problem (see Fabian 1994). Interestingly, jets of AGNs in the centers of the
galaxy clusters could interact with the ambient gas and convert the bulk kinetic jet power into
random and thermal energy of ambient gas, for example by propagation of sound waves. Such a
mechanical feedback heats the ambient medium efficiently and could be a possible solution for
the cooling flow problem (see, e.g., Vernaleo & Reynolds 2006). The importance of mechanical
AGN feedback through relativistic jet is also importantly recognized in galaxy formation in
cosmological context (Croton et al., 2006).
1.5 Jets and outflows 15 In the following, I describe different main stages of AGN jet evolution in more detail, i.e., launching, collimation and acceleration, and its final disruption and energy dissipation (see also other review articles; Zensus 1997; Boccardi et al. 2017).
Launching the jet
A relativistic jet requires matter in the outer accretion disk to fall towards the vicinity of the central BH and to escape from the deep gravitational potential. This is not a trivial process and requires special physical mechanisms. Different models were suggested during the last decades (see Lynden-Bell 2015 for a historical review). An immediate candidate is the magnetic field which emerges naturally in astrophysical plasmas. Magnetic fields also work efficiently, especially for rotating and turbulent plasma (like accretion flows near the BH).
Currently, two most favored scenarios of jet launching involve the central SMBH (Blandford
& Znajek, 1977) and the inner accretion disk (Blandford & Payne, 1982). We recall that astrophysical BHs are presumably rotating with nonzero spin (i.e., a > 0), thus they have an ergosphere. As explained in §1.2.1, the BH rotation forces plasma trapped within the ergosphere to rotate in the direction of the BH spin. This rotation is faster than the pure Keplerian rotation and thus leads to a differential rotation in the vicinity of the BH. Magnetic fields frozen in the plasma rotate in the same way. Eventually, the differential rotation develops a number of magnetic loops around the BH. The growing magnetic pressure then starts to push away the “ceiling” (i.e., the ambient medium) vertically and creates the pathway of the jet (see also Tchekhovskoy 2015). In this regard, the ergosphere is also called BH magnetosphere. At the same time, the rotating plasma extracts the spin energy of the BH via the Lense-Thirring or Penrose mechanism (Penrose & Floyd, 1971) and becomes able to escape from the ergosphere with sufficient energy. This is the basic idea of the Blandford-Znajek mechanism (BZ; Blandford
& Znajek 1977). Several arguments suggest that the central SMBHs do power relativistic jets in
AGN. For instance, a statistical comparison of the jet power and the accretion disk luminosity
reveals that the jet power usually exceeds the power provided by gravitational potential energy
of the disk (Ghisellini et al., 2014). Based on this, Ghisellini et al. (2014) suggest that additional
energy from the BH magnetosphere is involved in powering the jet. Similar phenomena are
also observed in numerical simulations of BH accretion with strong magnetic fields (e.g.,
Tchekhovskoy et al. 2011). They show that the jet power P
Jetcould exceed the mass accretion
power (e.g., η ≡ P
Jet/ Mc ˙
2> 1). It is important to recall that typical values of η corresponding
to the gravitational energy of accretion flow is ∼ 0.1 (see §1.2.2). Recent theoretical studies
show that the process of energy extraction from the central spinning BH is particularly efficient
when the magnetic field flux threading the inner accretion disk – which is eventually transported
to the central BH – is large. Such an accretion flow is often referred to as the magnetically
(A)
(B)
(C)
(D)
(E) (F)
Fig. 1.8 Example of structure of an extragalactic jet in the radio galaxy M 87 on different
spatial scales. From the top left panel and in counter-clockwise direction: (A) : The jet and
halo structure. The image covers ∼ 60 kpc projected distance. (B-D) : Zoom into the inner
jet structure on ∼ 1 kpc scale. The kpc-scale jet structure observed at X-ray (B), optical (C),
and radio (D) are displayed. (E) : The innermost jet structure observed by very long baseline
interferometry technique. The displayed jet structure extends ≲ 2 pc. (F) : An artistic view
of the central engine launching the jet (blue). The central dark point is the central SMBH
surrounded by ergosphere (gray sphere) and accretion disk (yellow). Red lines show wrapped
magnetic fields. Image credit : Bill Saxton, NRAO/AUI/NSF.
1.5 Jets and outflows 17 dominated accretion disk (MAD; Igumenshchev et al. 2003; Narayan et al. 2003). The MAD models are widely investigated in recent theoretical works because the resulting jet power is usually very large (see §3.2.3 of Yuan & Narayan 2014 for a brief review). In summary, the BH magnetosphere launches the relativistic jet efficiently, in particular in presence of strong magnetic field and fast BH spin. The resulting jet also has high speed, although the exact value of the asymptotic speed seems to depend strongly on the initial conditions assumed in the numerical simulations
3.
On the other hand, the accretion disk can launch less relativistic, but still strong outflows via the Blandford-Payne mechanism (BP; Blandford & Payne 1982) in which magnetocentrifugal acceleration of the inner accretion disk plasma leads to rather relativistic MHD winds (see also Camenzind 1986). Also, Blandford & Begelman (1999) point out that accreting gases may not easily plunge into the central BHs if the accretion flows are hot, radiatively inefficient, and geometrically thick. In this case, the viscous energy dissipation is used to heat the ions and electrons and causes advection. Such accretion flow is usually gravitationally unbound and produces an outflow from the surface. This substantially lowers the mass accretion rate closer to the BH in comparison to the rate defined at much larger Bondi radius (see Yuan & Narayan 2014 and references therein). Differential rotation in accretion disks can also build up loops of magnetic fields. The magnetic loops eventually generate a magnetic “tower”, which also launches a jet from the disk via magnetic pressure (Lynden-Bell, 2003; Hawley & Krolik, 2006;
Contopoulos et al., 2009). Anyhow, recent studies suggest that the power of the jet from the disk is considered to be ∼ Mc ˙
2and is less dependent on the BH spin and magnetic flux in the BH magnetosphere (see §3.3.2 of Yuan & Narayan 2014). However, the jet originating from the very inner accretion disk might not be clearly distinguishable from the jet from the BH itself in terms of the total jet power (e.g., De Villiers et al. 2005; Sa¸dowski et al. 2013).
Because of the two distinct origins, the jets from the BH and the disk have several different characteristics. First of all, the jet originating from the BH (“BH jet”) is narrow, highly magnetized, less mass-loaded, and easily achieves high velocity. Therefore it plays a central role in transporting energy outward in the form of magnetic fields (in other words magnetic energy dominated). On the other hand, the jet launched from the disk (“disk jet”) is wider, more mass dominated, and is considered to have lower velocity than the jet from the BH. Thus it is believed that the jet from the disk mainly carries mass and momentum of the whole outflow.
For this reason, the disk jet separates the BH jet from the geometrically thick mass accretion flow and help the latter maintain its own properties (see discussions in Hawley & Krolik 2006).
From this perspective, it is crucial to note that the jets from the BH and the disk are not mutually
3
One of the main reasons responsible for the discrepancy is that the detailed physical processes related to the
mass loading onto the magnetic fields of the jet are poorly understood. See §3.3.1 of
Yuan & Narayan(2014) for
more discussions.
Fig. 1.9 An example of a 3D general relativistic magnetohydrodynamic simulation showing jet formation from the BH and disk. The coordinate values of the simulation box are in units of the gravitational radius (R
g= GM
BH/c
2). Figure taken from Sa¸dowski et al. (2013).
exclusive. Instead, they may co-exist in the same system as a natural consequence of the mass accretion and BH physics (e.g., Hawley & Krolik 2006; Hardee et al. 2007; Sa¸dowski et al.
2013; see Fig. 1.9).
Acceleration
The acceleration of the relativistic jet requires additional mechanisms. Many studies have widely investigated different ideas involving gas-dynamic acceleration, acceleration by radiation pressure, gas and magnetic pressure gradient due to overpressure, and magnetic acceleration by magnetohydrodynamic (MHD) processes (see §1 of Singh et al. 2016 and references therein).
Currently, the magnetic acceleration scenario appears to have several advantages over the other models because (i) it is able to provide acceleration over long distances for highly magnetized flow and (ii) the MHD acceleration can occur as a natural consequence of jet expansion under external pressure confinement (e.g., Komissarov et al. 2007; Lyubarsky 2009).
Details of the magnetic acceleration scenario are different from model to model. But many
different models are based on the same root, which is the conversion of the magnetic energy to
the kinetic power. Theoretical works have mainly explored the magnetic acceleration scenario
for rather cold plasma with strong toroidal magnetic field (i.e., negligible internal energy of the
1.5 Jets and outflows 19
Total E (µ = Γ(1 + σ))
Magnetic (Γσ )
Kinetic (Γ)
Fig. 1.10 Conversion of magnetic energy into kinetic power in a numerical simulation of MHD jet. The abscissa corresponds to the logarithm of the jet radius in units of gravitational radius.
The figure has been taken from Komissarov et al. (2007).
gas and poloidal component of the magnetic field
4). This condition is usually reasonable for magnetically launched, supermagnetosonic jet (i.e., the bulk speed faster than the sound speed of the magnetic plasma). When such a jet expands under the pressure of ambient atmosphere, the flow maintains a parabolic shape and the inner layers of the quasi-cylindrical jet expand slower than the outer layers (i.e., differential collimation). This leads to an overall decrease of the magnetic energy density and invokes bulk acceleration the jet plasma (see Komissarov 2012 for a quantitative analysis based on the relativistic Bernoulli equation). Figure 1.10 shows an example of evolution of the magnetic and kinetic power versus the expanding jet radius as obtained by numerical simulations. There is a number of observational evidence showing acceleration of the jets. Homan et al. (2015) find significant, parallel acceleration of jets in
∼ 100 blazars within projected linear distances of ∼ 10 − 20 pc (de-projected distances of order of ∼ 100 pc). In individual nearby sources such as M 87, the jet acceleration is observed in greater detail. The source shows significant acceleration from projected distances of initial
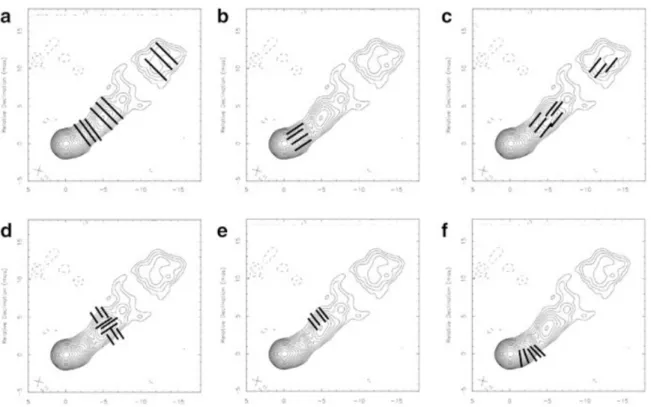
∼ 0.1 pc from the central engine (Mertens et al., 2016; Walker et al., 2018) up to kpc (Asada et al., 2014), followed by significant deceleration (Biretta et al., 1999). Similar jet acceleration patterns are also found in Cygnus A (Krichbaum et al., 1998; Bach et al., 2003; Boccardi et al., 2016b).
4
![Fig. 1.5 Median quasar composite spectrum derived from the Sloan Digital Sky Survey. Note the broad Hβ and narrow [OIII] emission lines](https://thumb-eu.123doks.com/thumbv2/1library_info/3695990.1505809/29.892.115.778.165.349/median-quasar-composite-spectrum-derived-digital-survey-emission.webp)