• Keine Ergebnisse gefunden

Spectroscopic studies on AGNs and High angular resolution in the NIR: The construction of an imaging beam combiner for the LBT

N/A
N/A
Protected

Academic year: 2021

Aktie "Spectroscopic studies on AGNs and High angular resolution in the NIR: The construction of an imaging beam combiner for the LBT"

Copied!
182
0
0

Wird geladen.... (Jetzt Volltext ansehen)

Volltext

(1)

Spectroscopic studies on AGNs and

High angular resolution in the NIR:

The construction of an imaging beam combiner for the LBT

INAUGURAL-DISSERTATION

zur

Erlangung des Doktorgrades

der Mathematisch-Naturwissenschaftlichen Fakult¨ at der Universit¨ at zu K¨ oln

vorgelegt von

Evangelia Tremou aus Trikala, Griechenland

K¨ oln 2011

(2)

Berichterstatter: Prof. Dr. J. Anton Zensus

Prof. Dr. Andreas Eckart

Tag der letzten m¨ undlichen Pr¨ ufung: 04. April 2011

(3)

To my soul mate N.P.

(4)
(5)

Abstract

The current thesis is divided into two projects. The first part deals with studies on active galaxies hosting an Active Galactic Nucleus (AGN). Specifically, an optical spectroscopic study of a nearby (z < 0.06) volume - limited sample of Low - Luminosity Quasi - Stellar Objects (LLQSOs) has been carried out. The sample has been drawn from the Ham- burg/ESO QSO survey (HES), which has a well-defined flux limit of B j < 17.3. The aim of the present project is to characterize the excitation degree of the sample, distin- guish between possible star forming and Seyfert activity and to investigate the spectral characteristics of the sample.

The spectroscopic data were analyzed and emission lines were fitted using a routine, which employs Levenberg - Marquardt least square minimization. The same analysis was also applied for some additional archival data from the 6 Degree Field Galaxy Survey (6dFGS). The objects of the LLQSOs sample are classified according to the classical optical diagnostic diagrams, based on optical emission lines close in wavelength, avoiding almost any impact of reddening. The diagrams provide a diagnosis of the ionizing source within a galaxy, hence activity between H ii, LINERs (Low Ionization Nuclear Emission- line Region), and Seyfert galaxies can be clearly distinguished. The classification of all members of the LLQSOs sample is shown in chapter 3. The broadness of the emission lines, cases with double components and the electron density are also analyzed.

The comparison of the diagnostic diagrams between the two data sets (HES and 6DFGS) results in different classifications of most of the sources. This is due to the different spectroscopic techniques applied in the two data sets during the observations, and is sketched in chapter 4. Several galaxies at a variety of cosmological distances, with elliptical and circular morphologies, were simulated. In these simulations, different in- struments (different spectroscopic techniques, i.e. slit, fiber) were applied to the galaxies, in order to study the instrumental effect (aperture effect). The impact of the aperture effect in local and high redshift universe is discussed in detail.

The second project of the thesis focuses on the construction of an image beam com- biner for the Large Binocular Telescope (LBT). The LINC - NIRVANA instrument will be operating in the near - infrared (1 - 2.4 µm) and will provide a high angular resolution ( ∼ 9 mas at 1.25 µm) over a wide field of view ( ∼ 100 arcsec at 1.25 µm). A fundamental com- ponent of the instrument, the Fringe and Flexure Tracking System (FFTS) is responsible to ensure a complete and time-stable wavefront correction at the position of the science detector. This will allow for long integration times at interferometric angular resolutions.

A historical overview and our current achievements are also discussed in chapter 5.

Laboratory tests of specific parts of the FFTS are presented in chapter 6. Especially,

the subparts of the Detector Positioning Unit (DPU), which has to be moved with respect

to an altitude - azimuth mounting under vacuum conditions, are characterized. The tilting

(6)

ii

of the instrument as a function of elevation results in a flexure of the system that has to

be corrected by an algorithm.

(7)

Zusammenfassung

Die vorliegende Arbeit unterteilt sich in zwei Bereiche. Der erste Teil besch¨aftigt sich mit Galaxien, die einen Aktiven Galaktischen Nukleus (AGN) besitzen. Hierzu wird eine volumenlimitierte Stichprobe von optische selektierten Low-Luminosity Quasi-Stellar Ob- jects (LLQSOs) benutzt. Diese basiert auf dem Hamburg/ESO QSO Survey (HES) und besitzt eine wohldefinierte Flussbegrenzung von B j < 17.3. Ziel ist es, die Anregungs- bedingungen der Linienstrahlung und die relative Bedeutung von Sternentstehungs- und Seyfert-Aktivit¨at f¨ ur diese Stichprobe zu untersuchen.

Die Analyse der spektroskopischen Daten fokussiert sich dabei auf die Anpassung von Emissionslinien mittels Levenberg - Marquardt Minimierung der kleinsten Quadrate.

Zus¨atzlich wurden Archivdaten des 6 Degree Field Galaxy Survey (6dFGS) f¨ ur einen Teil der Quellen der Stichprobe untersucht. Die LLQSOs werden entsprechend der klas- sischen optischen Diagnostik klassifiziert, die auf Flussverh¨altnissen von benachbarten Emissionlinien beruht. Dies minimiert den Einfluss von R¨otung auf die Bestimmung der Linienfl¨ usse. Diese Diagnostik erlaubt eine Unterscheidung von H ii, LINERs (Low Ionization Nuclear Emission-line Region), and Seyfert Galaxien, d.h. der dominieren- den Quellen der ionisierenden Strahlung. Die Ergebnisse f¨ ur die vorliegende Stichprobe werden in Kap. 3 pr¨asentiert.

F¨ ur den Großteil der Stichprobe, f¨ ur den sowohl HES als auch 6DFGS Daten vorliegen, ergibt die Analyse eine unterschiedlich Klassifikation. Dies liegt in den unterschiedlichen Beobachtungstechniken begr¨ undet und wird im Kap. 4 untersucht. Hierzu wurden Galax- ien unterschiedlicher (elliptischer und zirkulrer) Morphologie und bei verschiedenen kos- moligischen Abst¨anden als Funktion der instrumentellen Apertur, d.h. Schlitz- vs. Fiber- spektrograph, simuliert. Der Einfluss der Apertur auf die Beobachtung im nahen und hochrotverschobenen Universum wird im Detail diskutiert.

Der zweite Teil der Arbeit handelt von der Konstruktion von LINC-NIRVANA, der abbildenden Strahlvereiniger Kamera f¨ ur das Large Binocular Telescope (LBT). Das In- strument arbeitet im Nahinfraroten (von 1.0-2.4µm) und liefert hohe r¨aumliche Aufl¨osung ( ∼ 9 mas at 1.25 µm) ¨ uber ein großes Gesichtsfeld ( ∼ 100 arcsec at 1.25 µm). Eine wichtige Komponente des Instruments ist das Fringe and Flexure Tracking System (FFTS), das eine phasenkoh¨arente Strahlvereinigung (d.h. bei interferometrischer Winkelaufl¨osung)

¨

uber lange Integrationszeiten an der Position des wissenschaftlichen Detektors erm¨oglicht.

In Kap. 6 werden Labortests von spezifischen Komponenten des FFTS pr¨asentiert.

Im Speziellen wird die Detektorpositionierungseinheit (Detector Positioning Unit kurz

DPU) charakterisiert. Diese bewegt sich unter Vakuumbedingungen in der Fokalebene des

Instruments entsprechend der Alt-Azimuth Aufh¨angung des Teleskops. Das Kippen des

Instruments als Funktion der Elevation bedingt Verspannungen innerhalb des Systems, die

bei der Bewegung des FFTS Detektors in der Fokalebene ber¨ ucksichtigt werden m¨ ussen.

(8)

iv

(9)

Contents

1 Motivation and Thesis Outline 1

1.1 Galaxy evolution and interaction . . . . 1

1.2 Quest for High Angular Resolution . . . . 4

1.3 Outline of the current Thesis . . . . 6

2 AGN properties and Optical Spectroscopy 9 2.1 Host galaxies and their Active Galactic Nuclei . . . . 9

2.1.1 The Unification model . . . . 11

2.2 Optical spectroscopy . . . . 13

2.2.1 Techniques . . . . 14

2.2.2 Emission Lines of extragalactic objects . . . . 17

2.3 Sorting out Active Galactic Nuclei . . . . 20

3 Optical spectroscopic studies on the Low Luminosity Quasi Stellar Ob- jects sample 25 3.1 The nearby low luminosity QSO sample . . . . 25

3.2 Observations and Data Reduction . . . . 28

3.2.1 Hamburg/ESO Survey Observations . . . . 28

3.2.2 6 Degree Field Galaxy Survey . . . . 30

3.3 Data Analysis . . . . 34

3.4 Results and Discussion . . . . 36

3.4.1 Classification using the BPT diagrams . . . . 37

3.4.2 Analysis of the broad component . . . . 40

3.4.3 Electron density analysis . . . . 46

3.5 Concluding Remarks . . . . 46

4 Simulating the Aperture Effect 49 4.1 Motivation . . . . 49

4.1.1 Previous Investigations . . . . 50

4.2 Studies on the Aperture Effect . . . . 52

4.2.1 Nearby galaxies at high redshifts . . . . 53

4.2.2 Software algorithm for the simulations . . . . 57

4.2.3 The aperture effect in the local universe . . . . 59

4.2.4 Aperture effect at high redshift: Cosmological implications . . . . . 63

4.3 Concluding Remarks . . . . 66

(10)

vi CONTENTS

5 Optical/Infrared Interferometry - LINC NIRVANA 69

5.1 Interferometry retrospection . . . . 69

5.1.1 Adaptive Optics . . . . 71

5.1.2 Multi-Conjugate Adaptive Optics . . . . 73

5.2 The Large Binocular Telescope . . . . 74

5.2.1 The LBT Instruments . . . . 74

5.3 The LINC-NIRVANA Instrument . . . . 76

5.3.1 Principle of operation . . . . 78

5.4 The Fringe and Flexure Tracking System . . . . 78

6 Laboratory Tests of FFTS-DPU 81 6.1 The Detector Positioning Unit . . . . 81

6.2 Laboratory Tests of FFTS . . . . 84

6.2.1 Temperature and heat transfer tests of the linear stages . . . . 84

6.2.2 Tip-Tilt test . . . . 86

6.2.3 Software . . . . 89

6.2.4 DPU Repeatability and Flexure . . . . 90

6.3 Concluding Remarks . . . . 94

6.3.1 Outlook through High Angular Resolution Interferometry . . . . 94

A Appendix 97 A.1 The optical spectra of 6dFGS . . . . 97

Bibliography 145

List of Acronyms 153

Acknowledgements 155

Erkl¨ arung 157

Lebenslauf 161

(11)

List of Figures

1.1 Artistic representation of the center of an AGN . . . . 2

1.2 Projected gas density of the merger of two galaxies. . . . . 3

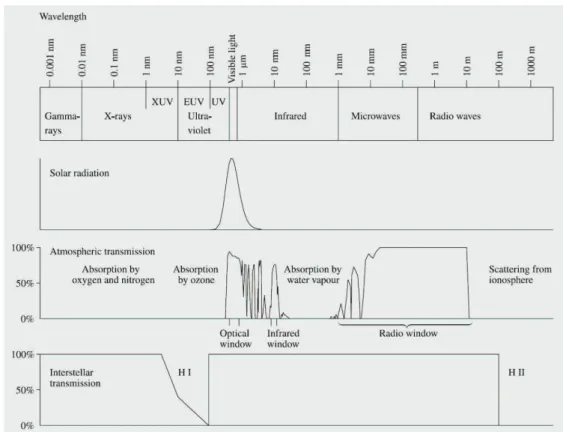
1.3 The transparency of the atmosphere at different wavelengths. . . . 5

2.1 Microphotometer tracings in the nebula NGC 1068. . . . 10

2.2 Schematic View of the Unification model of AGNs . . . . 12

2.3 Instrumental profiles for a perfect spectroscope and an optically perfect but real spectroscope. . . . 13

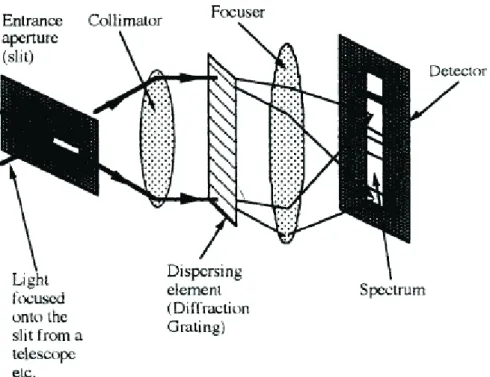
2.4 The basic components of a spectroscope . . . . 14

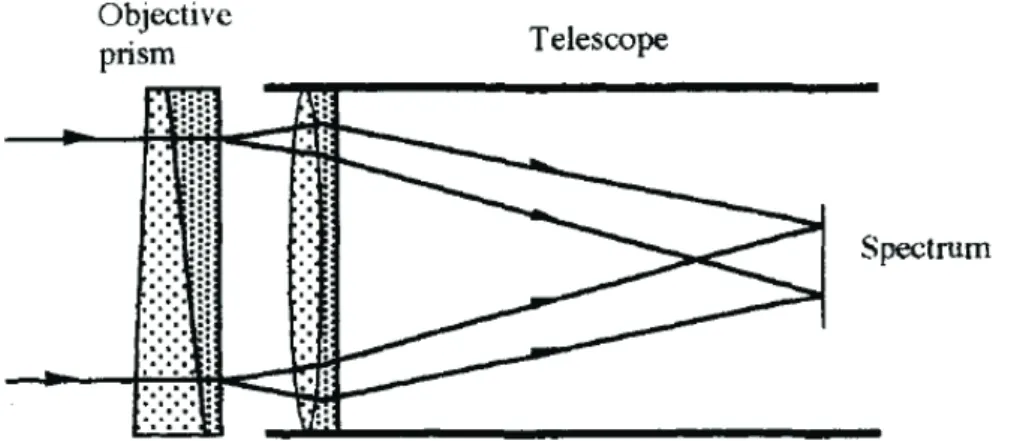
2.5 An objective prism spectroscope . . . . 15

2.6 Schematic view of an echelle grating and a cross disperser . . . . 16

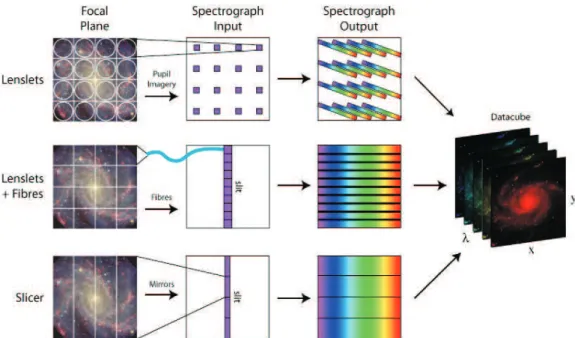
2.7 The main techniques for achieving integral field spectroscopy. . . . 17

2.8 Lyα line in a distant galaxy . . . . 18

2.9 The optical spectrum of the Seyfert 1 galaxy NGC 5548. . . . 19

2.10 Classical optical diagnostic diagram, BPT . . . . 21

2.11 The three BPT diagrams . . . . 22

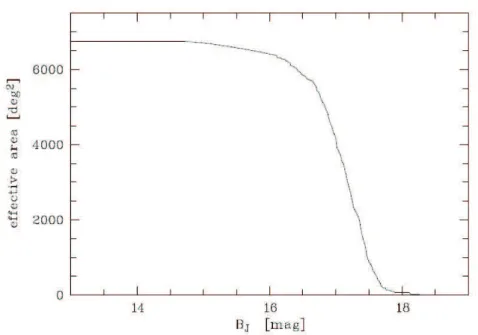
3.1 Effective area of the Hamburg/ESO survey as a function of the Galactic extinction corrected BJ magnitude. . . . 26

3.2 Magnitude and redshift distribution of the nearby LLQSO sample . . . . . 27

3.3 The three ESO telescopes . . . . 29

3.4 UK Schmidt Telescope and 6dF robotic posiotioner. . . . 30

3.5 6dFGS sky coverage . . . . 31

3.6 The optical spectrum of g0111097-472735 source observed by 6dFGS and fitting of Balmer lines. . . . 34

3.7 The galaxy g1138510-232135 and its optical spectrum and the fitting of line OI λ 6300˚ A. . . . 35

3.8 The entire spectrum of the galaxy g2234409-370644 and the fitting of line SII λ 6717˚ A and λ 6731˚ A . . . . 36

3.9 Classification diagram of HES . . . . 37

3.10 Classification diagrams of 6dFGS . . . . 38

3.11 Classification diagrams of cross-matching sources of 6dFGS and HES . . . 40

3.12 Distribution of Hα and Hβ broad component of HES. . . . 42

3.13 Distribution of Hα and Hβ broad component of 6dFGS. . . . 43

3.14 The source HE0236-3101. Fitting of lines Hα λ 6562˚ A and NII, Hβ λ 4861˚ A and OIII. . . . 44

3.15 The source HE0203m0031. Fitting of Balmer lines. . . . 45

(12)

viii LIST OF FIGURES

4.1 The comparison of the optical spectrum profile of the source HE0212-0059. 49 4.2 The difference in classification of the source HE0212-0059 which was ob-

served with different with instruments (HES and 6dFGS. . . . 50

4.3 Galaxy simulated with slit and fibre . . . . 53

4.4 Linear scale size of the galaxies as a function of redshift. . . . 55

4.5 Galaxy in redshift z=1 and z=7 produced by simulations . . . . 57

4.6 Simulating a galaxy with slit 2”, fibre 6.7” and fibre 3”. . . . 58

4.7 First case: The classification diagram of a simulated local galaxy (z = 0.02). 59 4.8 Second case: The classification diagram of a simulated local galaxy (z = 0.02). . . . 60

4.9 Third case: The classification diagram of a simulated local galaxy (z = 0.02). 62 4.10 Fourth case: The classification diagram of a simulated local galaxy (z = 0.02). . . . 62

4.11 The classification diagrams for high redshift objects 0.1 ≤ z ≤ 7, circular symmetry. . . . 65

4.12 The classification diagrams for high redshift objects 0.1 ≤ z ≤ 7, observed with long slit spectroscopy. . . . 66

5.1 Optics originally used by Labeyrie, Stachnik and Gezari for speckle inter- ferometry. . . . 70

5.2 Gemini North Laser Guide Star from Canada France Hawaii Telescope, credit:Gemini Observatory . . . . 71

5.3 Adaptive Optics system. . . . 72

5.4 Multi-Conjugate Adaptive Optics . . . . 73

5.5 The Large Binocular Telescope. . . . 75

5.6 Instruments location on the LBT . . . . 76

5.7 The LINC NIRVANA Instrument . . . . 77

5.8 The FFTS and the main subparts . . . . 79

6.1 The X, Y, Z linear stages . . . . 81

6.2 The rotation of the field . . . . 83

6.3 The set up of the temperature test. . . . 85

6.4 Results of the temperature measurements. . . . 86

6.5 The Tip - Tilt test set up . . . . 87

6.6 KGM 182 Heidenhain interferometric grid plate. . . . 87

6.7 The forth and back movement of X and Y stages with constant velocity under 0, 45 and 90 degrees of elevation. . . . 88

6.8 The flexure of X and Y stage. . . . 89

6.9 Screen shot of Dr. Greenthumb graphical interface. . . . 90

6.10 The repeatability of the X and Y stage. . . . 92

6.11 The precision of X linear stage movement. . . . 93

6.12 The motor error distribution of the X micro positioning stage. . . . 94

6.13 The motor error distribution of the Y micro positioning stage. . . . 94

A.1 The source g0023554-180251. . . . . 97

A.2 The source g0025013-452955. . . . 98

A.3 The source g0039159-511702. . . . . 99

(13)

LIST OF FIGURES ix

A.4 The source g0042369-104922. . . . 100

A.5 The source g0047413-212927. . . . 101

A.6 The source g0053544-240437. . . . . 102

A.7 The source g0111097-472735. . . . 103

A.8 The source g0111143-161555. . . . 104

A.9 The source g0129067-073830. . . . 105

A.10 The source g0151419-361116. . . . . 106

A.11 The source g0206160-001729. . . . 107

A.12 The source g0214336-004600. . . . 108

A.13 The source g0226257-282059. . . . 109

A.14 The source g0230055-085953. . . . . 110

A.15 The source g0111097-472735. . . . . 111

A.16 The source g0234378-084716. . . . . 112

A.17 The source g0256027-162916. . . . 113

A.18 The source g0259305-242254. . . . . 114

A.19 The source g0333078-135433. . . . 115

A.20 The source g0334245-151340. . . . 116

A.21 The source g0345032-264820. . . . 117

A.22 The source g0351417-402759. . . . . 118

A.23 The source g0400407-370506. . . . . 119

A.24 The source g0401462-383320. . . . 120

A.25 The source g0405017-371115. . . . 121

A.26 The source g0414527-075540. . . . 122

A.27 The source g0431371-024124. . . . 123

A.28 The source g0436223-102234. . . . . 124

A.29 The source g0450251-035903. . . . . 125

A.30 The source g0609175-560658. . . . 126

A.31 The source g0856178-013807. . . . . 127

A.32 The source g0952191-013644. . . . . 128

A.33 The source g1014207-041841. . . . 129

A.34 The source g1031573-184633. . . . 130

A.35 The source g1110480-283004. . . . 131

A.36 The source g1138510-232135. . . . . 132

A.37 The source g1251324-141316. . . . 133

A.38 The source g1313058-110742. . . . 134

A.39 The source g1331138-252410. . . . . 135

A.40 The source g1332391-102853. . . . 136

A.41 The source g1349193-301834. . . . . 137

A.42 The source g1356367-193145. . . . . 138

A.43 The source g2130499-020814. . . . . 139

A.44 The source g2207450-323502. . . . . 140

A.45 The source g2214420-384823. . . . . 141

A.46 The source g2234409-370644. . . . 142

A.47 The source g2309192-322958. . . . 143

A.48 The source g2340321-263319. . . . 144

(14)

x LIST OF FIGURES

(15)

List of Tables

3.1 Main Characteristics of the LLQSOs sample. . . . 33

3.2 Statistics of the sample . . . . 39

3.3 Statistics of the cross-matching sources. . . . 40

3.4 Electron density. . . . 46

4.1 Angular diameter sizes of the simulated galaxies. . . . 56

4.2 First Case: The emission line contribution on each region of the galaxy. . . 59

4.3 Second Case: The emission line contribution on each region of the galaxy. . 61

4.4 Third Case: The emission line contribution on each region of the galaxy. . 62

4.5 Fourth Case: The emission line contribution on each region of the galaxy. . 63

5.1 Main characteristics and status of the LBT Instruments . . . . 76

6.1 The high level requirements of the FFFTS component. . . . 82

6.2 The main characteristics of the 3 micro positioning stages. . . . 82

6.3 The main characteristics of KGM 182 Heidenhain grid plate. . . . 88

(16)

xii LIST OF TABLES

(17)

1. Motivation and Thesis Outline

The first chapter is an introductory one and its scope is to explain the motiva- tion that stands behind the studies of the present thesis following in the next sections. Since the thesis consists of two main parts, an introduction is given for both of them (AGN and high angular resolution studies using an upcoming instrument).

1.1 Galaxy evolution and interaction

An Active Galactic Nucleus (AGN) is an object in the center of a galaxy whose spectrum cannot be explained just by starlight. It produces enormous luminosities arising from very compact volumes. The light emitted by the nucleus equals (Seyfert activity) or even exceeds (Quasi Stellar Object, QSO) the total emission of the rest of the galaxy (host galaxy). The physics behind the AGN are still not completely understood, but the most current accepted model includes a super massive black hole in the center surrounded by a small (< 1 pc) accretion disc which is responsible for the huge amount of radiation we observe (Rees 1984; Magorrian et al. 1998). The accretion disc extends to the outer regions, forming a torus (1 to a few tens parsecs) that surrounds the entire AGN. As the matter falls into the central hole, some of it will escape from the disk forming jets. The inner clouds of the host galaxy form the Broad Line Region (BLR) as the gas rotates faster closer to the black hole and the Doppler effect widens the emission lines of these clouds.

The outer clouds form the narrow line region (NRL), which can extend for a few kpc (see Figure 1.1). The radiation from AGN is generally associated with gas accretion onto a Super Massive Black Hole (SMBH) located at the center of the host galaxy. The tight correlation between the black hole mass and the stellar velocity dispersion (Gebhardt et al.

2000) and the mass of the surrounding bulge (H¨aring & Rix 2004) suggests a co-evolution of the central black hole and its host galaxy.

Over the last decades observations of spiral galaxies point towards a hierarchy of mechanisms that all combine to transport the gas from the large kpc scales down to the inner pc scales. Additionally, fueling mechanisms triggered by the galactic environment, such as minor mergers and tidal interactions, might play a prominent role. Even less known are the processes responsible for fueling the innermost regions: secondary or inner bars were first proposed (Shlosman et al. 1989; Knapen 2005) to bridge the last few 100 pc, but more recent other mechanisms, such as m=1 modes (Emsellem 2001), warped gas disks (Schinnerer et al. 2000) and/or gas density waves (Englmaier & Shlosman 2000; Martini et al. 2003; Maciejewski 2004) have been suggested to be equally or more important.

The unified model of AGNs tells us that massive and super massive black holes un-

derlie the behaviors of almost all types of AGNs (Kormendy & Richstone 1995; Tremaine

(18)

2 1. Motivation and Thesis Outline

Figure 1.1: Artistic representation of the center of an AGN. Credit: Sonoma State University, NASA E/PO, Aurore Simonnet, http://epo.sonoma.edu

et al. 2002; Yu & Tremaine 2002). The first necessity in developing a theory of AGN evolution is thus to understand how such black holes originate. The fact that the earliest known QSOs and quasars were in existence just a few hundred million years after the Big Bang, constrains severely the fact that SMBHs must form very quickly by galactic time standards. The most popular suggestion is that super-massive black holes are born directly from the collapse of super-massive stars, which they have themselves been cre- ated from collapsing gas and dust clouds. The model of massive black hole formation via collisions within dense clusters is supported by the correlation between the masses of the central objects and those of the bulges of the host galaxies. The black holes are found to have masses between 0.2% and 1% of the mass of the bulge. The bulge in the case of an elliptical galaxy is the galaxy itself, for a spiral galaxy it is the galaxy’ s nucleus.

Further growth of the central black holes can occur if material from the outer parts of

the host galaxy finds its way down into the central regions. Collisions between galaxies

can drive to an increase of the black hole mass. Such collisions send fuel down towards

the central black hole (see Figure 1.2), but also if both galaxies have central black holes,

it can lead to a large increase in the black holes mass as those two black holes collide and

merge.

(19)

1.1. Galaxy evolution and interaction 3

Figure 1.2: Left Panels: Projected gas density of the merger of two galaxies shown in boxes of 140 kpc in side, color-coded by temperature (blue to red, upper panels). The bolometric luminosity of the central black hole(s) is shown in the lower panel, with diamonds marking the times shown above. Bolometric luminosities prior to the merger are the sum of the two individual black hole luminosities. Right Panels.

Top: Thick contours plot the median column density N H as a function of the simulation time, with thin contours at 25 % and 75 % inclusion levels. Solid contours represent the density of the ’hot-phase’ inter stellar medium (ISM), and dashed contours represent the total simulation density. Right Panels. Middle:

Bolometric luminosity of the black hole, L bol = ∈ M c ˙ 2 (thick line) and ratio of bolometric to Eddington luminosity, l ≡ L bol /L Edd (thin line). Right Panels. Bottom: Observed B-band luminosity calculated given the median hot-phase ISM density. Diamonds mark times shown in the right panel (Hopkins et al.

2005).

The starburst galaxies comprise a transient phase since they must have been some other type of galaxy before their starburst event and will go on to revert to some other type of galaxy after the starburst is over. The cores of starburst galaxies are not that active and starburst regions can occur within an AGN. In most of them there are signs of undergoing or of having undergone an encounter with another galaxy, and it is the disturbance to the gas and dust clouds arising from the tides induced during that encounter that lead to the outbursts of star formation. Star-formation rates in starburst galaxies can be up to several thousand solar masses per year. After the outburst, the galaxy is likely present a highly disturbed appearance for some time before eventually settling down towards an elliptical form. Interactions involving two large spiral galaxies can produce the most violent starbursts. Though spiral galaxy collisions arise probably the most luminous starburst galaxies ULIRGs (ultra luminous infrared galaxy). ULIRGs contain huge amounts of dust, therefore they emit most of their energy in far - infrared domain.

Great efforts have been made to understand the evolution scenarios of ULIRGs by previous studies depending either on their activity or their morphology. First, Sanders et al. (1988a) postulated that all ULIRGs develop into QSOs, which are hidden by dust.

The idea behind this scenario is that a cold ULIRG passes through the warm ULIRG 1 stage and finally formulates a QSO. A different evolutionary merging scenario for ULIRGs was

1 Warm ULIRGs are defined the systems with IRAS (Infrared Astronomical Satellite) colors f 25 /f 60 >

0.2 (Sanders et al. 1988b), while cold ULIRGs show IRAS colors f 25 /f 60 < 0.2

(20)

4 1. Motivation and Thesis Outline

proposed by Colina et al. (2001), which was based on the mass of the objects involved in the interaction. Concerning to this scenario, the merger of two intermediate mass (0.5L ∗ < L < L ∗ ) galaxies results a warm ULIRG or a low luminosity QSO (Chapter 3).

The advance phase of the merger of low mass galaxies is a cold ULIRG, while the merge of massive (< L ∗ ) galaxies produce high luminosity QSOs.

Based on the morphology of the observed ULIRGs, a different model has been proposed (i.e Kormendy & Sanders (1992); Genzel et al. (2001)). The last phase of this scenario is an elliptical galaxy which has been formed by the merger of two galaxies.

1.2 Quest for High Angular Resolution

The progress in astronomy is strongly dependent on the instrumentation breakthroughs.

The performance of any telescope and its ability to image celestial objects is limited by a fundamental optical phenomenon called Fraunhofer diffraction. The spatial or angular resolution of every telescope (circular diameter, D) is correlated by its power to distinguish the angular distance between two astronomical objects. Assuming, perfect optical prop- erties of the telescope and ideal circumstances, the angular resolution has a theoretical limit and is given by the Rayleigh criterion :

sinθ 2 = 1.22 λ

D , (1.2.1)

which actually is the diameter of the observed object’ s Airy disk and depends on the telescope’ s diameter and on the wavelength (visible, infrared, X- rays) (see also Figure 1.3). In practice, this could be more realistic for space telescopes, such as Hubble Space Telescope (HST) and the Spitzer Space Telescope, in contrast to the ground based tele- scope facilities that have to face the problem of the earth’ s atmospheric turbulence, the astronomical ’seeing’.

The light of a celestial object that travels though the turbulent layers of the atmo- sphere is collected from a telescope as a perturbed wavefront, because the gas density in the atmosphere is varying due to temperature and pressure inhomogeneities and with it the refraction index (Cox 2000). Its point spread function (PSF) is known as the ’seeing disk’ and is approximately Gaussian distributed. A model about the nature of the wave- front perturbations was introduced by Kolmogorov (1941) and developed by Tatarskii (1971). The model considers pressure, temperature and density in the atmosphere, and the variation of wind velocities and directions. The results show that the refractive in- dex structure function is being dependent not only on the altitude z but also on various geographical and seasonal conditions, such as geographical location and altitude of the telescope site, local environment of the telescope (i.e. the construction of the dome).

Considering that, a fundamental parameter, r 0 defined by Fried (1966) to characterize spatial extent of the phase perturbations (see also section 5.1). The FWHM of the ’seeing disc’ in combination with the Fried parameter results then : (Dierickx et al. 1988; Sarazin

& Roddier 1990)

seeing = F W HM = 0.98 λ

r 0 , (1.2.2)

2 θ is the angular resolution in radians. It is also called Dawes limit, which was introduced as the

result of a long series of observations by W. R. Dawes (1799 - 1868), one of the nineteenth century’s most

skilled observers.

(21)

1.2. Quest for High Angular Resolution 5

Figure 1.3: The transparency of the atmosphere at different wavelengths. 100% transmission means that all radiation reaches the surface of the Earth. The radiation is also absorbed by interstellar gas, as shown in the lowermost very schematic figure. The interstellar absorption also varies very much depending on the direction. Taken from Karttunen et al. (2007).

where it varies for the different ranges of wavelength, λ. Telescopes with diameters exceed- ing r 0 are dominated by seeing. A typical value for r 0 in the visible wavelength domain is ≈ 10 cm (Buscher 1988), corresponding to a size of the seeing disk of ≈ 1.1 arcsec.

The construction of the observatories in sites that are located on high altitude moun- tains far from cities with light pollution, and in areas with low humidity and suitable weather conditions, was the first step to overcome the limitations imposed by the atmo- spheric influence. However, the atmospheric effects still limit the performance of ground based telescopes, which exceed the aperture size of about 0.1 m in the visible and 0.6 m in the NIR (Hardy 1998).

Therefore, several efforts have been made to approach and come close to the theoret- ical resolving power of a telescope. The Speckle interferometry method was suggested by Labeyrie (1970), introducing the technique of short exposures times to ’freeze’ the atmo- spheric turbulence. The short exposure images contain bright spots (speckles) and the high resolution image can be resulted by ”shift and add” operation on the single frames.

Nevertheless, in this technique the read out noise of the detector affects the each short time exposure and the desirable sensitivity is limited due to its short integration times (see also section 5.1).

On the other hand, Adaptive Optics (AO) systems (see also subsection 5.1.1) allow

long integration times, exploiting the full sensitivity provided by the large aperture of the

current generation of telescopes. The distorted wavefront from a point-source is measured

with a wavefront sensor (WFS) and compensated by deformable mirrors (DM).

(22)

6 1. Motivation and Thesis Outline

However, the most basic principles of optical (i.e. visual and infrared) interferometry were already formulated in 1868 by A. Fizeau, who proposed to place a mask with two holes in front of a telescope aperture. He suggested measuring the diameter of stars by finding the hole separation at which the formed interference pattern vanished. This technique was also applied successfully from other scientists (such as Michelson (1891);

Michelson & Pease (1921)), but the first optical aperture synthesis images was obtained by Buscher et al. (1990), imaging the surface of Betelgeuse and Baldwin et al. (1996) imaging the binary star Capella.

Nowadays, long baseline stellar interferometers (> 100 m) such as the VLT interferom- eter or the Keck interferometer can achieve high spatial resolution in the NIR (few mas).

But since their optical designs do not support homothetic beam combination, their Field of View (FoV) is small. The Fizeau imaging interferometer LINC-NIRVANA at the Large Binocular Telescope will provide a better spatial resolution and sensitivity in comparison to the current interferometers 3 .

1.3 Outline of the current Thesis

The AGN dominates the brightness of a QSO host galaxy and therefore the studies on the parameters of the host galaxy is often a big query. The central few hundred parsec region of the host galaxy contains not only the AGN environment but may also contain massive circum nuclear starburst regions. During the last decade, great efforts have been made by astronomers to study the probable connection between the AGN and its host galaxy. For this reason, the high angular resolution is a key feature in order to separate possible starburst regions and the AGN components from the galaxy that hosts them.

With current AO systems we can achieve a resolution of 50 mas at 2 µm, which corresponds to 100 pc angular diameter distance. With the interferometric near-infrared imaging camera for the LBT, LINC-NIRVANA, we will achieve 10pc, which is the torus of an AGN. The torus provides the viewing angle-dependent obscuration which is necessary to explain the apparent difference between type 1 and type 2 AGN. In type 2 AGN, the line of sight from the AGN to the observer passes through the torus. Therefore, the torus obscures the central accretion disk and broad-line region (BLR). In type 1 objects, the accretion disk and BLR are directly visible to the observer. The torus seems to play a fundamental role in providing the fuel to feed the central accretion disk and the black hole. It connects the outer most part of the accretion disk in the influence of the black hole to the inner galactic region on scales of up to several hundred parcecs.

In the course of my PhD thesis, I have used optical spectroscopic observations to study a nearby Low Luminosity Quasi Stellar Objects (LLQSOs) sample, that were defined by the known Hamburg/ESO survey. The sources were observed with different spectroscopic techniques, therefore the attempt to taxonomy the sample faced differences in classifica- tion of some individual galaxies. Simulations have been applied to study that effect which is commonly known as ’aperture effect’.

As a second distinct part of this 3 year course, I have also worked on the construction

3 Traub (1986) set the golden rule of separated telescopes: ’As viewed from a point in the focal plane,

beams from separated telescopes must be recombined so that they appear to be coming directly from

a single large telescope which has been masked so as to reproduce exactly the ensemble of collecting

telescopes’

(23)

1.3. Outline of the current Thesis 7

of one fundamental part of the LINC NIRVANA instrument. In particular, I have tested a specific component which has to be moved with respect to an altitude - azimuth mounting under vacuum conditions. The tilting of the instrument under different elevations due to the mounting results in a flexure of the system that has to be corrected by an algorithm.

The following chapters of the thesis are structured as follows:

Chapter 2: The present knowledge about the AGN and the endeavors towards a unified model of AGN are sketched out. Techniques that are applied for spectroscopic observations and particularly focusing on the ones that our sample has been observed are described in detail. The significance of the emission lines of such objects is discussed in order to preface the following chapter.

Chapter 3: An overview of the sample that is used in the thesis is given as the first section, while the analysis is drawn in detail. The analysis was focused on some specific detectable optical spectral lines that have been used to clarify the excitation state of the sources, and their main characteristic spectral features.

Chapter 4: As a result of the investigation in chapter 3, strong differences in the optical spectra of some sources depending on the spectroscopic technique used, were found. The aperture effect due to the instruments is simulated and also compared to SDSS observations.

Chapter 5: The current knowledge about the great efforts on the interferometry and the approach to high spatial resolution is reported. The description of the Large Binocular Telescope, its LINC NIRVANA instrument, and the principle of operation of its components are specified as part of this chapter.

Chapter 6: This chapter is focused on the laboratory tests that have been designed

and came out during this course of the thesis. In particular, the working order of the

system under different elevations in vacuum conditions, and the characterization of some

components are discussed.

(24)

8 1. Motivation and Thesis Outline

(25)

2. AGN properties and Optical Spectroscopy

The current chapter aims to give a historical overview of the astronomical ob- jects studied in this thesis. Previous studies on the host galaxies along with their AGN and their physical properties (Binney & Merrifield 1998) are re- ported in the following sections. In particular, the discussion of AGN unifica- tion models (Padovani 1997; Antonucci 1993) comprises an important section of this chapter. One of the major scopes of this thesis is the study of the optical emission lines in extragalactic objects, therefore part of the present chapter is dedicated to the optical spectroscopic techniques in astronomy, as well as the properties of optical emission lines of extragalactic sources and their proper- ties.

2.1 Host galaxies and their Active Galactic Nuclei

In 1963, the discovery of quasi-stellar objects (QSOs or quasars) was a real milestone in the observational astronomy. Around 1960, in Jodrell Bank, a group of radio astronomers were interested in looking at the angular sizes of radio sources. Their first survey covered about 300 sources with average sizes of 30 arcsec. Statistically, most of the sources were in the range of 5 arcsec to a few arcmin. However, a small number of targets (around 10) were extremely small, with sizes of less than 1 arcsec. In particular, one of them (3C 48) was identified in the optical window of the spectrum and its shape was point- like. The strong emission lines in its spectrum seemed to be peculiar, and its light was variable (Matthews & Sandage 1963). The radio source structure appeared to have two components, one of them being a jet.

The jet strongly indicated that the source was not a simple star, but a much more violent system. After a symposium which took place in 1963 at Texas, this type of objects became known as ’quasi stellar objects’ (QSOs) or ’quasars’. In the early years of their discovery, the term ’quasars’ was linked to the ’radio-loud quasi-stellar’ objects and the category ’radio-quiet quasi-stellar’ sources was known for the QSOs. This distinction was related to the fact that the radio quiet QSOs were nearly invisible in the radio domain.

Nowadays, the meaning for both quasars and QSOs is the same, due to the similar optical

properties in both categories. The studies of Schmidt (1969) had driven the definition of

some properties of QSOs. In summary, the QSOs are star-like objects (identified with a

radio source, in the beginning) with variable light in large cosmological distances. They

show large ultra violet (UV) flux and their spectra is characterized by broad emission

(26)

10 2. AGN properties and Optical Spectroscopy

Figure 2.1: Microphotometer tracings of the emission lines λ 4860 Hβ, 4959 and 5007 [O iii ] in the nebula NGC 1068 from Carl Seyfert,1943, (Seyfert 1943).

lines, with absorption lines in some cases. The luminosity of their core can be thousand times more luminous than other galaxies.

QSOs are not the only objects that are part of the AGN family, they are the most luminous. AGNs are defined as compact regions in the centers of their host galaxies. They can be Seyfert, QSOs or Radio galaxies which differ in their luminosities and their spectral properties. AGN’s spectra seems to be unlike to that one of stars and other galaxies, since it cannot be described in terms of blackbody emission. A unification model combining AGN types is described in next subsection 2.1.1.

Historically, Seyfert galaxies obtained their name by Carl Seyfert in 1943 (see Figure 2.1), who realized that several similar galaxies can form a class on themselves. However, the first time that an active galaxy (NGC 1068) was detected with strong broad emission lines in the optical window, was in 1908 by E.A Fath (Fath 1909).

Comparing to QSOs, Seyfert galaxies are lower luminous AGNs, and their host galaxy is clearly detectable and not outshone by the core, as it happens in QSOs. Seyfert galaxies have high surface brightness, and in the optical images they mainly appear to have spiral structure. Judging from the emission lines that these galaxies show, either narrow or broad or even both, they can be distinguished into two subcategories, Seyfert 1, and 2.

Narrow emission lines are of the order of several hundred km/s. The spectrum of type 1 Seyfert includes both narrow and broad emission lines, in contrast to type 2 that they consist of only narrow emission lines. Intermediate classes such as Seyfert 1.5, 1.8 etc.

were introduced based on a line width by Osterbrock (1981).

Giant elliptical galaxies with an active nucleus appear to be very bright in the radio

domain. Radio galaxies are categorized in Broad Line Radio Galaxies (BLRGs) and in

Narrow Line Radio Galaxies (NLRGs). BLRGs are the Seyfert type 1 and the NLRGs

are Seyfert type 2, corresponding to the presence of broad emission lines and the absence

(27)

2.1. Host galaxies and their Active Galactic Nuclei 11

of them, respectively (Khachikian & Weedman 1974). Apart from the optical spectra classification, the radio sources are divided into two categories according to their radio morphology (Fanaroff & Riley 1974). Radio sources type Fanaroff-Riley Type I (FRI) have a very bright core and the surface brightness decreases outwards, in contrast to FR II that the surface brightness increases outwards.

Narrow lines profiles of AGN were identified by Heckman et al. (1980). This type of AGN show very low ionization nuclear emission-line region so called LINERs. LINERs are very common and they might be present in half of all the spiral galaxies. They can be distinguished from Seyfert galaxies and H ii regions using some emission line flux ratios which are discussed in detail in the section 2.3.

Another interesting class of AGN are the BL Lac objects and the Optically Violent Variables (OVV). The first one took their name from the prototype source BL Lacertae.

Both of them show short time-scale variations in contrast to other AGNs which are strong and rapid variable, but BL Lac objects miss the strong emission and absorption lines. The name blazars is commonly used for these two types of objects.

2.1.1 The Unification model

The name AGN includes a huge gamut of objects which have different appearance, but it is of high importance to indicate that there is not a real difference in their physical nature.

Strong non-thermal emission in the core of the host galaxy is the common characteristic of AGNs.

The luminosity of some objects significantly larger than that of others, the presence or not of jets, and the anisotropic effects (i.e. different appearance depending on the objects orientation relative to the line of sight), are the three factors that support the different classification of these sources (Binney & Merrifield 1998). Keeping as reference the common characteristics of AGN members and their orientation to the observer, unified models have been proposed by scientists such as Antonucci (1993) and Urry & Padovani (1995). In principle, the unification of AGNs is an attempt to explain the diversity of observational properties in terms of a simple model (see Figure 2.2).

The basis of most unification models is that AGNs are not spherically symmetric and thus what you see depends on from where you look at them. The discovery of superluminal motion and the interpretation in terms of bulk relativistic motion of the emitter was what first made people realize that orientation in AGN was important. Rowan-Robinson (1977) work was one of the first efforts to unify Seyfert galaxies and radio sources. The disadvantage of this project was the lack of beaming consideration, which is the effect due to the relativistic motion of the AGN components. Nevertheless, a step forward for the importance of dust and IR emission came out from this research. Another important suggestion came from Scheuer & Readhead (1979); they proposed that radio-quiet quasars and flat spectrum radio-loud quasars constitute a single population assuming isotropic (extended) radio emission. However, some later observations with VLA and MERLIN (Orr & Browne 1982) had shown that low surface brightness extended structures are associated with sources that appear to be compact in less sensitive observations.

Antonucci (1993) and later Urry & Padovani (1995) summarized the simplest scheme

(see Figure 2.2) that can be used to develop unifying models. The central engine is similar

for any type of AGN and is believed that is Super Massive Black Hole (SMBH) in the

center of the host galaxy, which is fed by an accretion disk. The Radio-quiet AGNs and

(28)

12 2. AGN properties and Optical Spectroscopy

Figure 2.2: Schematic View of the Unification model of AGNs (Urry & Padovani 1995). A central massive black hole is surrounded by an accretion disk obscured by a torus. Depending on the viewing angle the AGN can be categorized in two major classes, the Radio Loud and the Radio Quiet Quasars. In the Radio Loud Quasars there is a contribution to their luminosity from the jet, which can be neglected in the Radio Quiet Quasars.

quasars have regions close to the nucleus that produce broad emission lines and continuum

radiation. An opaque tori surrounds that region along the axis of which are located weak

radio jets. When the torus is face-on to an observer, so that the line of sight reaches

the nuclear region, the broad lines and the continuum are seen. Otherwise, only the

narrow lines outside of the torus are visible directly. However, when the signal to noise

ratio is high, radiation that is reflected into observer’s direction because of the scattering

by electrons producing polarization can be seen. In a few cases, twin jets of relativistic

particles are present. When the axis of a radio-loud object is close to the line of sight,

the observer can see a continuum with narrow and broad lines but also a one-sided jet. If

it is too close to the line of the sight, then a beamed emission dominates and the object

appears as a blazar.

(29)

2.2. Optical spectroscopy 13

2.2 Optical spectroscopy

Optical spectroscopy is a mean of studying the properties of physical objects based on measuring how an object emits and interacts with light. It can be used to measure at- tributes such as an object’s chemical composition, temperature, and velocity. Since the optics is defined as the part of the electromagnetic spectrum that passes through the at- mosphere, it involves visible, ultraviolet, or infrared light, alone or in combination, and is part of a larger group of spectroscopic techniques called electromagnetic spectroscopy. In the optical part of the spectrum the detectors operating are generally broad-band devices, sensitive to radiation over a wide range of wavelengths. Unlike to the shorter wavelengths, where the detectors response varies with the energy of the photon, the monochromatic signals cannot be observed directly (see Figure 2.3). A separate device called spectro- scope, is required to separate out the radiation into its wavelength component before it is detected.

Figure 2.3: Instrumental profiles for a perfect spectroscope (left) and an optically perfect but real spec- troscope (right). Figure from Kitchin (1996).

There are several processes whereby the radiation can be separated into its component wavelengths. The simplest is to use a range of filters placed before the detector to isolate particular regions of the spectrum. Traditionally, however, this method of studying the spectrum of an astronomical object is regarded as a separate subject from spectroscopy, and is called Photometry. A second method of obtaining a spectrum is based upon differential refraction and results in prism-based spectroscopes. The spectral resolution, R, is defined as

R = λ

∆λ (2.2.1)

where λ is the operating wavelength and ∆λ is the smallest wavelength interval that may be resolved.

However, most modern astronomical spectroscopes (see Figure 2.4) utilize interference

effects in some way to produce the spectrum. The resulting devices which have found

application in astronomy are Diffraction Gratings (Hadden 1895), Fabry-PCrot Etalons

(Babcock 1924; Hernandez 1986) and Fourier Transform Spectroscopes (Ridgway & Hinkle

2010).

(30)

14 2. AGN properties and Optical Spectroscopy

Figure 2.4: The basic components of a spectroscope. Polychromatic radiation (radiation of more than one wavelength) enters the monochromator through the entrance slit. The beam is collimated, and then strikes the dispersing element at an angle. The beam is split into its component wavelengths by the grating or prism. By moving the dispersing element or the exit slit, radiation of only a particular wavelength leaves the monochromator. Image credit : Kitchin (1996).

2.2.1 Techniques

The astronomical spectroscope must be as efficient as possible, because the sources are often very faint. The technique which aims to obtain spectroscopy of many of the objects within a telescope’s field of view in a single exposure called Multi - object spectroscopy.

A series of methods that are able to carry out such surveys are described in what follows.

Slitless spectroscopy. Instead of a spectrograph, a low dispersing element combined directly with the telescope can be used to collect the spectra of the brighter sources within a large field of view. For instance, an objective prism is placed in front of the telescope, which is often a Schmidt camera. The objective prism spectroscope (see Figure 2.5) is the simplest spectroscope in terms of design and its principle of operation, since it is just a large, low angle prism covering the whole aperture of the telescope. In this way every object on the image is represented by its spectrum. However, this method has serious disadvantages being the most important difficulty of finding radial velocities from the spectra because there is no comparison spectrum. The Crossley telescope is an 36-inch reflecting telescope located at Lick Observatory in California, USA and it utilizes a slitless spectrograph.

Slitlet masks. This method needs an initial image of the desirable sky region in

order to define the location of the observable objects. Once the position of the sources is

known small slits are milled in the corresponding locations in a metal plate. This plate

is then substituted for the slit in a conventional spectrograph. Care must be taken that

the spectra do not overlap; this usually limits the number of objects to 10 or so. Such

(31)

2.2. Optical spectroscopy 15

Figure 2.5: An objective prism spectroscope. Figure from Kitchin (1996).

systems have the advantage of good subtraction of the night sky, and very high efficiency.

A slitlet mask is used with the ESO Faint Object Spectrograph and Camera (EFOSC2) instrument operated by ESO.

Fiberfed spectroscopy. In comparison with milling slitlets in a plate, this technique uses holes plugged with optical fibers. A spectrograph which is mounted on an optical bench receives the light transported via the fibers. At the spectrograph, the fibers are arrayed in a line, and act as the spectrograph slit. The faintest object that can be usefully observed is dependent upon how well one can calibrate the fiber to fiber transmissions, as separate fibers must be used to observe the night sky. A powerful fiber-fed spectrograph is placed at the MMT (Multiple Mirror Telescope) Observatory in Arizona, USA, named Hectospec (Fabricant et al. 2005).

Echelle spectroscopy. Echelle spectroscopy (see Figure 2.6) is a method of diffrac- tion grating which is intended to be used in very high orders (n < 10), resulting in very high resolving power. Echelle grating consists of a number of slits with widths close to the wavelength of the diffracted light like other types of diffraction grating. Normal spec- trographs employ diffraction gratings that are intended to be used in low order (n =1, 2, or 3), with colored glass filters used to prevent overlap of adjacent orders. An echelle uses a second dispersal element, usually another grating but sometimes a prism, at right angles to the first, in order to separate the successive spectral strips from each other.

The VLT (Very Large Telescope) 8.2-m Unit Telescope utilizes an Ultraviolet and Visual Echelle Spectrograph (UVES), which is a high-resolution optical spectrograph located at the Nasmyth B focus of the telescope (Dekker et al. 2000).

Coud´ e spectroscopy. Coud´ e spectrographs are very stable, as they are located off

the telescope, and the optics and gratings can be quite large since they do not need to be

attached to the telescope. The use of echelles and fiberfed benchmounted spectrographs

have largely replaced the coud´ e spectrograph; most modern telescopes are now built with

altitude - azimuth mounts rather than equatorial mounts, leading to the further decline of

coud´ e systems. The image from the telescope can often be brought into an area separate

from the main observatory through an optical window. This area can then be temperature

controlled to suit either the operators or the spectroscope (or both), reducing the problems

due to temperature variations and improving observing conditions. Coud´ e and Nasmyth

(32)

16 2. AGN properties and Optical Spectroscopy

Figure 2.6: Schematic view of an echelle grating and a cross disperser. Figure from Kitchin (1996).

spectroscopes can thus be much larger, have higher dispersion and/or resolution, and be less robustly constructed than Cassegrain spectroscopes. The disadvantages of a Coud´ e or Nasmyth focus are that the image rotates as the telescope tracks the object across the sky, and that the focal ratio is usually very long.

Integral field spectroscopy. Integral field spectrographs are instruments which combine spectrographic and imaging capabilities, used to obtain spatially resolved spec- tra. The current technique allows to gather spectral information of the sky over a two- dimensional field of view. Hence the result is a a data-cube, with axes of x, y (or RA, Dec;

the two spatial axes) and wavelength (velocity). An integral field spectrograph consists of two components: the spectrograph and an integral field unit (IFU). The 2D spatial plane is divided into a continuous array by the IFU in three main ways, lenslet array, fibers, and imager slicer (see Figure 2.7).

The most common technique in use the fibers (with or without lenslets) (Allington-

Smith et al. 1997), where the light is transmitted via the fibers to a benchmounted spec-

trograph. Although the fibers are arrayed in a linear array at the spectrograph, their

locations in the focal plane are known, and sophisticated data reduction techniques al-

lows the astronomer to reconstruct a spectral image of the object. In the lenslet array

technique (Bacon et al. 1995), the input image is split up by a microlens array, where the

light from the observed object is concentrated into a small dot and dispersed by the spec-

trograph. When the input image is formed on a mirror that is segmented in thin horizontal

(33)

2.2. Optical spectroscopy 17

Figure 2.7: The main techniques for achieving integral field spectroscopy. Credit: M. Westmoquette, Figure from Allington-Smith & Content (1998).

sections, sending each ’slice’ in slightly different directions, the technique called ’imager slicer’ (Content 1997). A second segmented mirror is arranged to reformat the slices so that, to form the slit of the spectrograph. NIFS is Near-Infrared Integral Field Spec- trometer built by the Australian National University’s Research School of Astronomy and Astrophysics utilized by Gemini observatory. The 4.2 William Herschel Telescope (WHT) located in Isaac Newton Group of Telescopes (ING), La Palma, Spain is an example of a telescope that utilizes two integral field spectrographs, the WHT SAURON using a lenslet array and the WHT INTEGRAL using fibers.

Fourier transform spectroscopy. Fourier transform spectroscopy, used particu- larly in the near infrared, employs an entirely different concept from the spectrographs described above. Instead of being dispersed in a spectrograph, the light of a wide band of wavelengths is passed through a Michelson interferometer with variable spacing of its two apertures. The resulting interferogram, which is an electronic record of the interfer- ence signal produced by the interferometer as the separation of the apertures is varied, is converted into a record of intensity versus wavelength by a computer, and is of extremely high spectral resolution.

2.2.2 Emission Lines of extragalactic objects

Extra-galactic objects are moving away from us, this leads to one of the main methods of estimating their cosmological distances, z (redshift), where z is defined by the equation :

z = λ obsv − λ emit

λ emit

(2.2.2)

However, it also means that the observed spectra in the visual region wave was actually

originated at shorter wavelengths. Therefore, for distant extra-galactic objects we may

observe their rest - frame ultraviolet and far ultraviolet spectra via optical spectroscopy.

(34)

18 2. AGN properties and Optical Spectroscopy

The Lyman-α line is often strong in emission, especially for active galaxies, quasars and similar objects. An efficient search for such objects may thus be made by using an objective prism on a Schmidt camera. There will be many thousands of spectra on such a plate, but the distant quasars etc will be easily picked out from the rest through the presence of the strong Lyα emission (see Figure 2.8). Cool gas clouds and galactic haloes along the line of sight to a distant object will result in many narrow absorption lines at lesser redshifts, also due to Lyα. These may sometimes be so numerous that they are referred to as the Lyα forest.

Figure 2.8: (a) The spectrum shows a faint emission line detected at 6σ significance at a wavelength of 11,615.6 A, corresponding to a redshift z=8.5549±0.0020 for Lyα, (b) The sky-subtracted two dimen- ˙ sional spectrum shows the projection of the spectrum along the spectral and right-ascension axes of the data cube (Lehnert et al. 2010).

On the contrary, the normally visible spectrum is observed for the nearer objects.

Then, with many galaxies, the spectrum is just the total summary of the spectra of their

(35)

2.2. Optical spectroscopy 19

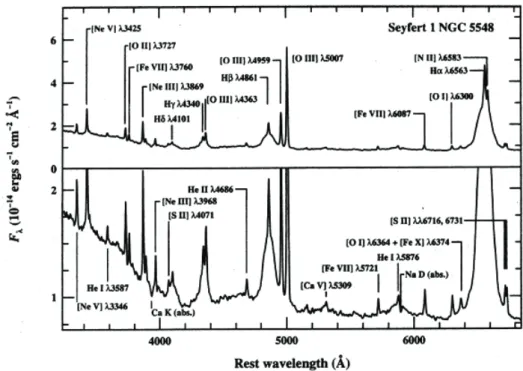
constituent stars and gas. Within the spectra of active galaxies, however, emission lines are frequently to be found, due to forbidden transitions. In quasars and Seyfert 1 galaxies, the allowed emission lines have velocity widths of l0000 km/s or so. The forbidden lines have widths of about 500 km/s and many of the lines arise from highly ionized states (see Figure 2.9). These kind of lines took their name due to their existence in the solar corona, therefore they are often called Coronal. In Seyfert 2 galaxies, all the lines are around 500 km/s in width, while in LINERS (Low Ionization Nuclear Emission Regions), the levels of ionization are much lower, as the acronym suggests.

Figure 2.9: The optical spectrum of the Seyfert 1 galaxy NGC 5548. The prominent broad and narrow emission lines are labeled, as are strong absorption features of the host galaxy spectrum. The vertical scale is expanded in the lower panel to show the weaker features. The Full Width at Half Maximum (FWHM) of the broad components is about 5900 km/s, and the width of the narrow components is about 400 km/s. The strong rise shortward of 4000 A ˙ is the long-wavelength end of the “small blue bump”

feature which is a blend of Balmer continuum and [Fe ii ] line emission. This spectrum is the mean of several observations made during 1993 with the 3-m Shane Telescope and Kast spectrograph at the Lick Observatory. Data courtesy of A. V. Filippenko. Figure from Peterson (1997).

The emission lines of many active galaxies, including quasars, Seyferts, BL Lacs etc, vary on time scales of years or less, and in some cases the total luminosity may change as well. The active galaxies are often very strong emitters in the short wave and radio regions of the spectrum, with synchrotron radiation dominating in the latter. The overall spectrum of active galaxies is roughly constant in terms of energy per frequency decade, from the radio region to gamma rays. The nuclei of more normal galaxies, including our own, may have similar emissions on a smaller scale. The outer regions of galaxies generally have a roughly blackbody spectrum, peaking in the visible or near ultraviolet. Forbidden iron lines are an indicator of a starburst galaxy, and probably arise from the numerous supernovae occurring within them.

With the best of current instrumentation and techniques, slit spectra down to a visual

magnitude of +23 are just about obtainable at a reasonable dispersion for emission line

(36)

20 2. AGN properties and Optical Spectroscopy

objects in an exposure lasting all night. Since galaxies are often found in clusters, the various multi-object spectroscopes are frequently used to obtain many spectra simulta- neously. In the nearer objects, H ii regions and other hot nebulae can be highlighted by observing through a narrow band filter centered on one of their emission lines.

2.3 Sorting out Active Galactic Nuclei

The categorization of AGNs seems to be a complicated topic. The AGN phenomenon is concealed due to the lack of understanding the physics behind them. The one and only criterion for classifying the AGNs is the way that we observe them and not the fundamental differences between the various types. Various studies, depending on the selection criteria, morphology and line widths, have produced a variety of classification schemes. Spectroscopic studies have been proven to be a valuable tool for determining the main power source in active galaxies. A special research on the information contained in the relative intensities of the emission lines has been done by Baldwin et al. (1981). The main idea behind their classification scheme was to discriminate between the different excitation mechanisms operating on the line emitting gas.

The Active Galactic Nuclei (AGN) are believed to be supported by the gas accreted on to black holes at the centers of galaxies (Shields 1978). Depending on the level of the intensity of such activity (AGN), the galaxies can be categorized, comprising of quasi stel- lar objects (QSOs) at the high end down to Seyferts and Low-Ionization Nuclear Emission line Region (LINERs) (Heckman et al. 1980) at the low end (see Figure 2.10). LINERs appear to be the lowest luminosity AGN. Since the properties of a galaxy that hosts an AGN rely on the central source, considerations on the characteristics of its emission lines are required. According to Koski (1978) AGNs are photoionized by nonthermal or power- law continua, where Dopita & Sutherland (1995) postulated that fast shocks (Heckman 1980; L´ıpari et al. 2004) may be responsible of some LINER activity. On the contrary Starburst galaxies are mainly ionized by hot stars (Huchra 1977; Filippenko & Terlevich 1992; Shields 1992; Maoz et al. 1998; Barth & Shields 2000). The line emitting gas in AGNs is photoionized by the central non-stellar continuum.

According to the standard unified model (Antonucci 1993), AGNs are divided into two main subcategories depending on the viewing angle of the central source and its continuum. Narrow permitted and forbidden emission lines (300-1000 km/s width) coming from the Narrow Line Region (NRL) and broad lines (2000-6000 km/s width) coming from the Broad Line Region (BLR) when it is viewed directly (Veilleux & Osterbrock 1987a).

Some objects such as QSOs and Seyfert 1 galaxies show both types of lines. Seyfert 2 and LINERs show only narrow line emission. Actually, this makes AGN spectra differ from the spectra of most stars and many galaxies where lines are relatively weak and predominantly in absorption. LINERs are generally thought to be either photoionized by power- law continua (Veilleux & Osterbrock 1987b) or shock excited (Dopita 1997; Lutz et al. 1999).

QSOs show strong optical continuum emission, X-ray continuum emission, and broad

and narrow optical emission lines. The spectra of LINER, Seyfert and star forming galax-

ies, where the emission is powered by early type stars, cannot be distinguished from one

other on the basis of any single flux ratio from any pair of lines (Peterson 1997), although

some efforts have been made in this direction i.e Stasi´ nska et al. (2006). The emission

(37)

2.3. Sorting out Active Galactic Nuclei 21

Figure 2.10: A diagnostic (or BPT) diagram for emission-line galaxies. The vertical axis is the [O iii ] 5007 / Hβ flux ratio and the horizontal axis is the [N ii ] 6583 / Hα flux ratio. Both ratios are based on lines close in wavelength and are therefore nearly reddening independent. The open circles are for H ii regions and similar sources that are clearly ionized by hot stars. The closed circles are narrow-line AGNs (Seyfert 2s and NLRGs) which are ionized by “harder” continua (i.e., with a greater fraction of high- energy photons, such as a power-law spectrum); the solid line is an empirical division between these two classes of object. The triangles represent LINERs, which can be distinguished from H ii regions by higher values of [N ii ] 6583 / Hα, and from Seyfert galaxies by lower values of [O iii ] 5007 / Hβ. Based on a similar diagram from Osterbrock (1989), p. 346. Figure courtesy of R. W. Pogge, based on data from (Veilleux & Osterbrock 1987a). Figure from Peterson (1997).

line flux ratios are sensitive to the shape of the ionizing continuum and the previous consideration can provide us a useful tool to investigate the ionizing source of LINERs, Seyferts and star forming galaxies associated with hot stars. Baldwin, Phillips and Ter- levich (Baldwin et al. 1981), hereafter BPT, have shown that various types of objects with similar emission line spectra can be distinguished by considering the intensity ratios of two pairs of lines.

That can be represented in a ’BPT’ diagram, which demonstrates how LINERs can

be distinguished from normal H ii regions and Seyferts/QSOs on the basis of the [O iii] λ

5006.843˚ A / Hβ λ 4861˚ A, [N ii ] λ 6583.41˚ A / Hα λ 6562˚ A, [S ii ] λ λ 6716,6731˚ A / Hα λ

6562˚ A, and [O i] λ 6300˚ A / Hα λ 6562˚ A flux ratios. This method was refined by Veilleux

and Osterbrock (Veilleux & Osterbrock 1987a) who used flux ratios computed from two

pairs lines which are close in wavelength, so that the systematic effects of reddening are

minimized. They derived a semi empirical boundary line used to separate starbursts from

(38)

22 2. AGN properties and Optical Spectroscopy

Seyferts with these diagrams. In their system the division between Seyferts and LINERs occurs at [O iii]/Hβ = 3.0. Ho et al. (2003) stress, however, that this boundary has no strict physical significance. The ionization level of the NLR in large, homogeneous samples of AGNs spans a wide and apparently continuous range and there is no evidence for any clear transition between Seyferts and LINERs.

Figure 2.11: The three BPT diagrams showing our new scheme for classifying galaxies using emission- line ratios. The Ke01 extreme starburst classification line (red solid line), the Ka03 pure star formation line (blue dashed line), and the SeyfertLINER line (blue solid line) are used to separate galaxies into H ii - region - like, Seyferts, LINERs, and composite H ii AGN types. Adapted from Kewley et al. (2006).

A theoretical upper limit (Ke01) was defined by Kewley et al. (2001) to show the de- marcation between starburst galaxies and AGN. They showed a new classification scheme, where a theoretical boundary lines which are used to classify Starbursts, Seyferts and LIN- ERs. They used a combination of photoionization and stellar population synthesis models to place the upper limit on the location of star-forming models in the ’BPT’ diagrams.

An empirical line (Ka03) dividing pure star-forming galaxies from Seyfert and H ii com- posite objects whose spectra contain significant contributions from both AGN and star formation added by Kauffmann et al. (2003). According to the new classification scheme (see Figure 2.11) the objects are defined as following:

Star forming galaxies lie below and to the left hand side of the Ka03 classification line in the [N ii ]/Hα and below and to the left hand side of the Ke01 in the [S ii ]/Hα diagrams:

log([O iii]/Hβ) < 0.61/[log([N ii]/Hα) − 0.05] + 1.3 (2.3.1)

log([O iii]/Hβ) < 0.72/[log([S ii]/Hα) − 0.32] + 1.30 (2.3.2) and

log([O iii]/Hβ) < 0.73/[log([O i]/Hα) + 0.59] + 1.33. (2.3.3)

Composite galaxies lie between the two lines (Ka3 and Ke01) in the [N ii]/Hα

Abbildung

Figure 1.1: Artistic representation of the center of an AGN. Credit: Sonoma State University, NASA E/PO, Aurore Simonnet, http://epo.sonoma.edu
Figure 1.2: Left Panels: Projected gas density of the merger of two galaxies shown in boxes of 140 kpc in side, color-coded by temperature (blue to red, upper panels)
Figure 1.3: The transparency of the atmosphere at different wavelengths. 100% transmission means that all radiation reaches the surface of the Earth
Figure 2.1: Microphotometer tracings of the emission lines λ 4860 Hβ, 4959 and 5007 [O iii ] in the nebula NGC 1068 from Carl Seyfert,1943, (Seyfert 1943).
+7

Referenzen

ÄHNLICHE DOKUMENTE

a) Reduction in the number of dental visits and treatment provided by the private sector, in an effort to reduce pri- vate spending leading to a sharp decline in the income of

3 Franklin Allen, Historical Background, (1999), ‘How Financial System Differ and How They Develop?’, Wharton School, working paper pp1.. 2) The provision of a mechanism for pooling

They also published a few literary and cultural writings from the Global South, mainly Latin American authors, like Gabriel García Marquez (Feltrinelli published the first

Photography and the artistic construction of the contemporary” (2022), the guest editor is interested in exploring the contemporary relations between photography and time, through

The results suggest that higher taxes indeed increase the share of low income earners' share in total gross income and reduce the respective share of top income earners..

In, for instance, the third Venician edition of the Babylonian Talmud (1550), tractates of Derekh 'Eretz were admitted. See also the survey of the rendering of the Derekh

The individual construction phases of the proposal for the construction of the cased step pyramids using steep ramps tangentially attached to the sides and conversions

Hathor is linked with desert animals much more than any other ancient Egyptian deity, probably because her conceptualisation as the star Sirius (invisible for part of the year)