Nuclei of Nearby Active Galaxies:
NIR and Sub-mm Views
and
Finalizing the LINC-NIRVANA Fringe and Flexure Tracking System:
Flexure and Temperature Behavior
Inaugural - Dissertation zur
Erlangung des Doktorgrades
der Mathematisch-Naturwissenschaftlichen Fakult¨at der Universit¨at zu K¨oln
vorgelegt von
Semir Smaji´c
aus Bijeljina, Bosnien und Herzegowina
K¨oln 2015
Berichterstatter: Professor Dr. Andreas Eckart Professor Dr. Anton Zensus
Tag der m¨undlichen Pr¨ufung: 29. Juni 2015
Abstract
The work presented in my thesis addresses the two cornerstones of modern as- tronomy: Observation and Instrumentation.
Part I deals with the observation of two nearby active galaxies, the Seyfert 2 galaxy NGC 1433 and the Seyfert 1 galaxy NGC 1566, both at a distance of
∼ 10 Mpc, which are part of the Nuclei of Galaxies (NUGA) sample. It is well established that every galaxy harbors a super massive black hole (SMBH) at its center. Furthermore, there seems to be a fundamental correlation between the stellar bulge and SMBH masses. Simulations show that massive feedback, e.g., powerful outflows, in Quasi Stellar Objects (QSOs) has an impact on the mutual growth of bulge and SMBH. Nearby galaxies follow this relation but accrete mass at much lower rates. This gives rise to the following questions:
Which mechanisms allow feeding of nearby Active Galactic Nuclei (AGN)? Is this feeding triggered by events, e.g., star formation, nuclear spirals, outflows, on ∼ 500 pc scales around the AGN? Does feedback on these scales play a role in quenching the feeding process? Does it have an effect on the star formation close to the nucleus?
To answer these questions I have carried out observations with the Spec- trograph for INtegral Field Observation in the Near Infrared (SINFONI) at the Very Large Telescope (VLT) situated on Cerro Paranal in Chile. I have reduced and analyzed the recorded data, which contain spatial and spectral informa- tion in the H-band (1.45 µm − 1.85 µm) and K-band (1.95 µm − 2.45 µm) on the central 10
00× 10
00of the observed galaxies. Additionally, Atacama Large Millimeter/Sub-millimeter Array (ALMA) data at 350 GHz ( ∼ 0.87 mm) as well as optical high resolution Hubble Space Telescope (HST) images are used for the analysis.
For NGC 1433 I deduce from comparison of the distributions of gas, dust, and intensity of highly ionized emission lines that the galaxy center lies ∼ 70 pc north-northwest of the prior estimate. A velocity gradient is observed at the new center, which I interpret as a bipolar outflow, a circum nuclear disk, or a combination of both. At least one dust and gas arm leads from a r ∼ 200 pc ring towards the nucleus and might feed the SMBH. Two bright warm H
2gas spots are detected that indicate hidden star formation or a spiral arm-arm interaction.
From the stellar velocity dispersion (SVD) I estimate a SMBH mass of ∼ 1 . 74 ×
10
7M .
Abstract
For NGC 1566 I observe a nuclear gas disk of ∼ 150 pc in radius with a spiral structure. I estimate the total mass of this disk to be ∼ 5.4 × 10
7M . What mechanisms excite the gas in the disk is not clear. Neither can the existence of outflows be proven nor is star formation detected over the whole disk. On one side of the spiral structure I detect a star forming region with an estimated star formation rate of ∼ 2.6 × 10
−3M yr
−1. From broad Brγ emission and SVD I estimate a mean SMBH mass of ∼ 5 . 3 × 10
6M with an Eddington ratio of
∼ 2 × 10
−3.
Part II deals with the final tests of the Fringe and Flexure Tracker (FFTS) for LBT INterferometric Camera and the NIR/Visible Adaptive iNterferometer for Astronomy (LINC-NIRVANA) at the Large Binocular Telescope (LBT) in Ari- zona, USA, which I conducted. The FFTS is the subsystem that combines the two separate beams of the LBT and enables near-infrared interferometry with a significantly large field of view. The FFTS has a cryogenic system and an am- bient temperature system which are separated by the baffle system. I redesigned this baffle to guarantee the functionality of the system after the final tests in the Cologne cryostat. The redesign did not affect any scientific performance of LINC-NIRVANA. I show in the final cooldown tests that the baffle fulfills the temperature requirement and stays < 110 K whereas the moving stages in the ambient system stay > 273 K, which was not given for the old baffle design.
Additionally, I test the tilting flexure of the whole FFTS and show that accurate
positioning of the detector and the tracking during observation can be guaran-
teed.
Zusammenfassung
Ich befasse mich in meiner Doktorarbeit mit den Grunds¨aulen moderner Astro- nomie: Beobachtung und Instrumentierung.
Teil I der Arbeit behandelt die Beobachtung zweier nahe gelegener aktiver Galaxien, die Seyfert 2 Galaxie NGC 1433 und die Seyfert 1 Galaxie NGC 1566, die sich in einer Entfernung von ∼ 10 Mpc befinden und Teil des “Nuclei of Ga- laxies” (NUGA) Projektes sind. Es ist allgemein anerkannt, dass jede Galaxie ein supermassives schwarzes Loch (SMSL) in ihrem Zentrum beherbergt. Des Weiteren scheint es eine Grundkorrelation zwischen den Massen des stellaren Bulges und der SMSL zu geben. Simulationen zeigen, dass intensives Feedback, z.B. durch intensive Materiefl¨usse, in quasi-stellaren Objekten (QSOs) dieses ge- meinsame Wachstum erkl¨aren kann. Nahe gelegene aktive Galaxiekerne (AGK) folgen dieser Relation, akkretieren jedoch Masse mit viel niedrigeren Raten. Da- her stellen sich folgende Fragen: Welche Mechanismen erm¨oglichen die Akkre- tion f¨ur nahe AGK? Wird der Akkretionsprozess angestoßen, z.B. durch Stern- entstehung, Spiralarme oder Materiefl¨usse auf ∼ 500 pc Skalen um die AGK?
Wirkt Feedback auf diesen Skalen d¨ampfend f¨ur den Akkretionsprozess und hat es einen Einfluss auf die Sternentstehung nahe am Kern?
Um mich mit diesen Fragen zu befassen habe ich Beobachtungen mit dem
“Spectrograph for INtegral-Field Observation in the Near Infrared” (SINFONI) durchgef¨uhrt am “Very Large Telescope” (VLT) auf dem Cerro Paranal in Chile.
Die aufgezeichneten Daten habe ich reduziert und analysiert. Die Daten umfas- sen r¨aumliche und spektrale Information im H-Band (1.45µm − 1.85µm) und K- Band (1.95µm − 2.45µm) f¨ur die zentralen 10
00× 10
00der beobachteten Galaxien.
Zus¨atzlich werden “Atacama Large Millimeter/Sub-millimeter Array” (ALMA) Daten bei 350 GHz ( ∼ 0.87 mm) sowie hoch aufgel¨oste optische “Hubble Space Telescope” (HST) Bilder f¨ur die Analyse verwendet.
F¨ur NGC 1433 finde ich, anhand eines Vergleiches der Gas- und Staubver-
teilungen und der Intensit¨atsverteilung hoch ionisierter Emissionslinien, heraus,
dass das Galaxiezentrum ∼ 70 pc nord-nordwestlich im Vergleich zu vorheri-
gen Bestimmungen liegt. Im neuen Zentrum wird ein Geschwindigkeitsgradient
beobachtet und f¨ur dessen Ursache ich einen bipolaren Materiefluss, eine cir-
cumnukleare Scheibe, oder eine Kombination dieser diskutiere. Mindestens ein
Spiralarm f¨uhrt von einem r ∼ 200 pc Ring in Richtung des Kerns und k¨onnte
so Gas zum SMSL bringen. Zwei stark strahlende Bereiche, welche aus war-
Zusammenfassung
mem H
2-Gas bestehen, sind detektiert worden. Diese deuten auf ein verborgenes Sternentstehungsgebiet oder zeigen die Interaktion der Spiralarme. Aus der stel- laren Geschwindigkeitsdispersion (SGD) bestimme ich eine Masse des SMSL zu ∼ 1.74 × 10
7M .
Im Zentrum von NGC 1566 habe ich eine Gasscheibe mit Radius r ∼ 150 pc und einer Spiralstruktur beobachtet. Die Gesamtmasse der Gasscheibe bestimme ich zu ∼ 5.4 × 10
7M . Welche Prozesse das Gas in dieser Scheibe anregen bleibt unklar. Es k¨onnen weder Beweise f¨ur einen Materiefluss gefunden werden noch wird Sternentstehung innerhalb der gesamten Scheibe beobachtet. Lediglich auf einer Seite der Spiralstruktur identifiziere ich ein Sternentstehungsgebiet, wel- ches eine gesch¨atzte Sternentstehungrate von ∼ 2.6 × 10
−3M yr
−1hat. Aus der Emission der breiten Br γ Linie und der SGD bestimme ich eine mittlere Masse des SMSL zu ∼ 5.3 × 10
6M mit einem Eddingtonverh¨altnis von ∼ 2 × 10
−3.
Teil II dieser Arbeit befasst sich mit den, von mir durchgef¨uhrten, fina- len Tests des “Fringe and Flexure Trackers” (FFTS) f¨ur “LBT INterferometric Camera and the NIR/Visible Adaptive iNterferometer for Astronomy” (LINC- NIRVANA) am “Large Binocular Telescope” (LBT) in Arizona, USA. Das FFTS ist das Teilsystem, das die beiden getrennten Strahlen des LBT vereint und da- durch Interferometrie im nahen Infrarot mit einem großen Gesichtsfeld erlaubt.
Das FFTS besteht aus einem kryogenen Teil und einem Teil was bei Umge- bungstemperatur arbeitet, welche durch ein Bafflesystem getrennt sind. Ich habe dieses Baffle neu konzipiert, um sicher zu stellen, dass dessen Funktionalit¨at be- reits in K¨oln durch finale Tests im Kryostaten gegeben ist. Die Neugestaltung hat keinen Einfluss auf die wissenschaftliche Leistung von LINC-NIRVANA.
Ich zeige in den finalen K¨uhltests, dass das Baffle die Temperaturanforderung
T < 110 K erf¨ullt, wohingegen die beweglichen Bauteile im warmen Systemteil
eine Temperatur von 273 K nicht unterschreiten. Zus¨atzlich habe ich die Verbie-
gung beim Verkippen des gesamten FFTS mit zufriedenstellenden Ergebnissen
getestet. Alle Anforderungen f¨ur die genaue Positionierung des Detektors und
das Nachf¨uhren w¨ahrend einer Beobachtung sind erf¨ullt.
Contents
I The Central Region in Seyfert Galaxies 1
1 Introduction 3
1.1 Astrophysical Spectra . . . . 4
1.1.1 Continuum Radiation . . . . 4
1.1.2 Line Emission . . . . 7
1.1.3 Absorption . . . . 10
1.2 AGN Taxonomy . . . . 10
1.2.1 Active Galaxies . . . . 11
1.2.2 The Unified Model . . . . 13
1.3 Black Hole Mass Estimators . . . . 17
1.3.1 Black Hole Mass to Host Galaxy Relations . . . . 18
1.3.2 Broad Line Region Relations . . . . 19
1.4 Star Formation in Galaxies . . . . 21
1.4.1 Diagnostic Diagram . . . . 21
1.4.2 Continuum Decomposition . . . . 23
1.4.3 Star Formation Strength . . . . 23
1.5 Rotation in Galaxies . . . . 25
2 Overview 27 2.1 The NUGA sample . . . . 27
2.2 Feeding and Feedback in AGNs . . . . 29
3 Data Reduction 33 3.1 Detector Specific Pattern . . . . 35
3.2 Atmospheric Emission Correction . . . . 36
4 The Seyfert 2 Galaxy NGC 1433 41 4.1 Observation and Data Reduction . . . . 43
4.2 Results and Discussion . . . . 44
4.2.1 Gas Distribution . . . . 45
4.2.2 Line diagnostics . . . . 52
4.2.3 Continuum Analysis and Black Hole Mass . . . . 56
Contents
4.2.4 The nucleus of NGC 1433 . . . . 60
4.2.5 The central arcsecond . . . . 61
4.2.6 The dusty nuclear spiral arms . . . . 69
4.2.7 Computation of the torques . . . . 70
4.3 Conclusion and summary . . . . 74
5 The Seyfert 1 Galaxy NGC 1566 77 5.1 Observation and Data Reduction . . . . 79
5.2 Results . . . . 81
5.2.1 Ionized Gas . . . . 82
5.2.2 Molecular Gas . . . . 86
5.2.3 Continuum . . . . 87
5.3 Discussion . . . . 92
5.3.1 The Active Nucleus . . . . 92
5.3.2 Continuum Emission . . . . 95
5.3.3 Kinematics . . . . 99
5.3.4 Emission Line Diagnostics . . . 101
5.3.5 Stellar Emission and Absorption . . . 108
5.4 Conclusion and Summary . . . 111
II A Fringe and Flexure Tracker for LINC-NIRVANA at the LBT 119 6 Introduction 123 6.1 The Large Binocular Telescope . . . 123
6.2 LINC-NIRVANA . . . 124
6.2.1 Homothetic Imaging . . . 125
6.2.2 Multi Conjugate Adaptive Optics . . . 125
6.2.3 Fringe Tracking . . . 128
6.3 The Fringe and Flexure Tracker . . . 129
6.3.1 General Design . . . 129
6.3.2 FFTS oddities . . . 131
7 The FFTS’s GFRP put to test 133 7.1 Glass fiber reinforced plastics . . . 133
7.2 Baffle motor and encoder . . . 134
7.3 Flexure of the FFTS . . . 136
7.3.1 Test setup . . . 136
7.3.2 Results and Discussion . . . 137
Contents
7.4 Summary . . . 142
8 The FFTS Ba ffl e System 143 8.1 The Disk-in-Disk System . . . 143
8.2 The Simplified Baffle System . . . 146
8.3 Final Cooldown in Cologne . . . 148
8.3.1 Test Setup . . . 148
8.3.2 Results and Discussion . . . 149
8.4 Summary . . . 153
Acronyms 157
Bibliography 172
List of Figures 175
List of Tables 177
Publications 181
Part I
The Central Region in Seyfert
Galaxies
CHAPTER 1
Introduction
This chapter introduces the main characteristics and methods that are used, de- scribed, and discussed later on in the analysis. It is based on astrophysical text- books, e.g., Dopita & Sutherland (2003); Osterbrock & Ferland (2006); Peterson (1997); Mihalas & Binney (1981), as well as review papers by Ho (2008); Ken- nicutt & Evans (2012); Sofue & Rubin (2001); Fabian (2012); Kormendy & Ho (2013), which I highly recommend as a source for a thorough overview on the topics mentioned here.
I will start with the description of astrophysical spectra focusing mainly on the optical
1, which is the best studied wavelength regime, and the Near-Infrared (NIR)
2, which is the wavelength regime that is mainly used in the analysis in this thesis. I will talk about the different emission mechanisms that are typical in observed spectra.
Thereafter, I will introduce the type of galaxies that are investigated in this thesis, active galaxies. These galaxies harbor an Active Galactic Nucleus (AGN) at their center. They contain ionized gas, e.g., H ii regions, whose ionization cannot be attributed clearly and directly to stars, in their nuclear regions. Hence, the existence of different energetic phenomena, e.g., the accretion disk around a Super Massive Black Hole (SMBH), has been claimed.
I will present the Unified Model (UM) which combines all observed charac- teristics of AGN and explains them as different phenomena that stem from the same model but are perceived differently due to orientation effects. This model can explain the perceived differences in AGN themselves, but not the different hosts in which they reside.
Afterwards, I will explain how the Black Hole (BH) mass can be estimated, then I will talk about the contribution of star formation to the nuclear region in different galaxies and how this can be disentangled and then I introduce rotation in galaxies.
1
Wavelength range of ∼ 4000 − 7500 Å.
2
Wavelength range of ∼ 7500 − 50000 Å or ∼ 0.75 − 5.0 µm.
1. Introduction
1.1 Astrophysical Spectra
The word “spectrum” describes the fact that there are different subgroups to a specific group. For example in politics there are parties that range from leftist parties over liberals and conservatives to rightist parties, this is called the polit- ical spectrum. In science, especially with regard to light, the word spectrum is used to describe dispersion of light. For example the different colors of a rain- bow which are created by dispersion of white light from the sun by water drops in the atmosphere. This is the effect used to analyze the light from distant stars and galaxies. The observed light is dispersed to gain information not only on the intensity but also on the energy distribution of the incoming photons.
I will describe the different emission mechanisms that are typical in astro- physics and explain the emission mechanisms which are discussed in this study.
A galaxy spectrum is a linear combination of radiation from different com- ponents, e.g., black body emission, electron continuum, hydrogen atoms and molecules, which are explained below, and other emission and absorption lines from a zoo of helium, metals, and molecules.
1.1.1 Continuum Radiation
The emission that is continuous over a wider wavelength range is termed con- tinuum radiation. There are several processes that create continuous emission which will be discussed in the following.
Black Body Emission
The rainbow colors, violet to red, are those that the human eye is sensitive to, which covers a wavelength range of ∼ 4000 − 7000 Å. But stellar light is not confined to only this range. Stellar emission can be very well described as black body emission which is characterized by the Planck function
B
λ( T ) = 2 hc
2λ
51 exp
hcλkT
− 1
with the Planck constant h = 6.626 × 10
−34J s, the speed of light c ≈ 3 × 10
10cm s
−1, the wavelength λ, the black body Temperature T in Kelvin, and the Boltzmann constant k = 1 . 38 × 10
−19cm
2kg s
−2K
−1. From the Planck function it becomes apparent that even a single star with a specific temperature radiates at every wavelength. The sun’s black body emission temperature
3is T
= 5778 K.
3
In the following effective temperature will be used for this term as is usual in other literature.
1.1. Astrophysical Spectra Following Wien’s displacement law
λ
maxT = 0 . 29 cm K
the peak intensity for the sun is found at a wavelength of ∼ 5019 Å λ
max= 0.29 cm K
T
⇒ λ
max= 0.29 cm K
5778 K = 5.019 × 10
−5cm.
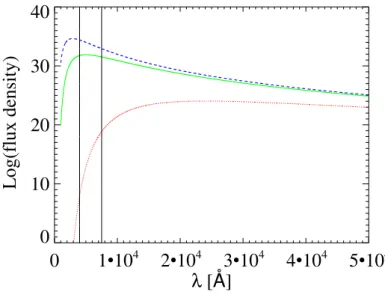
Figure 1.1 shows the black body emission of the sun and the black body emission of bodies at temperatures of T = 1200 K and T = 10000 K.
0 1 • 10
42 • 10
43 • 10
44 • 10
45 • 10
4λ [ Å ]
0 10 20 30 40
Log(flux density)
Figure 1.1: Black body emission of the sun T = 5778 K (green - solid line) and black body emission at effective temperatures of T = 10000 K (blue - dashed line) and T = 1200 K (red - dotted line). The vertical lines mark the visible wavelength range. Note that the flux density scales with the temperature at every wavelength.
The black body emission is a very important contributor of emission over a large wavelength range. Young hot stars with effective temperatures > 10000 K peak in the UltraViolet (UV). These are bright stars that have lifetimes of a few Mega years and are only seen in very young star forming regions. Stars with effective temperatures of 5000 − 10000 K and lifetimes of > 10
9yr peak in the optical. These stars are mostly main sequence stars
4. Stars at temperatures below
4
The term dwarf will be used from now on when referring to main sequence stars.
1. Introduction
5000 K peak in the NIR. These stars make up most of the dwarf population.
However, giants and supergiants can show the same effective temperature as the aforementioned dwarfs. For longer wavelengths down to the sub-mm black body emission from dust is observed.
The main contribution to the continuum in the later discussed NIR stems from an already evolved stellar population or from very hot dust. However, for hot dust to become prominent in a galaxy spectrum, a strong ionizing source is needed to heat up a lot of dust (e.g., the torus structure around an AGN, see Sect.
1.2). This is explained by the black body emission where at a higher tempera- ture the flux density is higher over the whole wavelength range. This becomes apparent from Fig. 1.1, where the T = 1200 K black body is several magnitudes weaker compared to the hotter black body plots although the black body peak emission follows Wien’s displacement law and peaks with lower temperature at a higher wavelength. Another reason is that dust is not as good a black body as a star and its black body emission has to be multiplied by an emissivity factor < 1, which weakens the dust intensity.
Electron Continuum
A charged particle, e.g., an electron, will radiate if it is accelerated. This happens for example when an electron interacts with the Coulomb potential of a positive ion, e.g., H ii. This interaction produces a continuum from free-free radiation.
The electron before and after the interaction is free but its energy level changes due to the de- or acceleration
5with the Coulomb potential. The change in energy is not quantized hence the radiated spectrum is continuous.
The free-bound interaction, where the electron is free and is then captured by the ion, also creates continuous radiation due to the dependence of the emission coefficient on the velocity of the captured electron.
Synchrotron radiation is another form of accelerated electron radiation. It occurs when electrons spiral around magnetic fields. Due to the spiral move- ment the velocity vector changes its direction hence an acceleration occurs. The radiation depends on the electron energy and can occur throughout the spectrum.
When synchrotron emission becomes important there is not a single electron at a specific energy creating a synchrotron spectrum but several electrons with dif- ferent energies which combined create a power-law shape described by
F
ν= Cν
−αF
λ= C
0λ
α−2.
5
In the case of deceleration the effect is called bremsstrahlung.
1.1. Astrophysical Spectra Where C and C
0are constants and α is the power-law index typically in the range of 0 ≤ α ≤ 1 for quasar spectra.
In the galaxies studied in this thesis electron continuum radiation is weak compared to the black body emission from background stars and is therefore not important for this study. However, the electron continuum becomes important for the study of isolated nebulae or for the study of galaxies with strong jets.
1.1.2 Line Emission
In addition to the continuum radiation, atoms and molecules, which are found in clouds and nebulae throughout the InterStellar Medium (ISM), emit photons at specific wavelengths. This emission is added to the underlying continuum and results in local emission maxima at wavelengths and energies corresponding to the transitions energy. However, absorption minima can occur as well when photons from the underlying continuum are absorbed by the nebulae. Very im- portant and well studied emission lines are the hydrogen recombination lines, e.g., Balmer series in the optical or Brackett series in the NIR, and molecular rotational-vibrational emission, e.g., molecular hydrogen, H
2, in the NIR or car- bonmonoxide, CO, in the Millimeter to sub-mm wavelength regime. Important absorption lines are found in mentioned recombination lines from nebulae and optically thick clouds or in stellar atmospheres, e.g., CaT λ 8500 Å or CO(2- 0) λ2.29 µm.
I will describe emission lines of atomic and molecular hydrogen that are impor- tant for this work. However, the spectrum of galaxies is populated by several other species which are briefly mentioned here.
Recombination Lines
Recombination lines are mainly observed in atomic gas, i.e., from atomic gas clouds, which are found throughout the ISM. Hydrogen is the most abundant element in the universe therefore these clouds consist mainly of hydrogen, ∼ 90%, followed by helium, ∼ 10%, and metals, e.g., oxygen (O), carbon (C), iron (Fe), with numbers of 10
−4− 10
−3relative to hydrogen.
Photoionization
Photoionization describes the effect that photons with an energy above a given threshold, e.g., E ∼ 13 . 6 eV or λ ∼ 912 Å for a hydrogen atom, can remove electrons from the atom they are interacting with, thereby ionizing the atom.
This interaction is called bound-free photon absorption. The easiest and most
illustrative example in astrophysics is a hydrogen cloud close to a young hot
1. Introduction
star that emits strong UV radiation. All photons above the energy threshold of E ∼ 13 . 6 eV and directed towards the cloud can ionize hydrogen atoms in the nearby cloud. However, not every photon will interact with a hydrogen atom.
The photoionization cross section is highest around the threshold frequency of ν
0∼ 3.29 × 10
15s
−1and drops off with approximately ν
−3above this threshold.
The free electrons follow a Maxwell-Boltzmann velocity distribution f ( u ) = 4
√ π m
2 kT
32u
2exp − mu
2kT
! ,
with the velocity u , mass m , and temperature T of the electrons, because the cross section for elastic scattering collisions between electrons is much larger than any other involved cross section, e.g., recombination cross section. Hence, the recombination coefficient to a specific hydrogen level α
n2L(H
0, T ) is the integral over the velocities d u of the Maxwell-Boltzmann energy distribution f ( u ), the recombination cross section σ
n2L(H
0, u ) of this specified level, and the velocity of the electrons u
α
n2L(H
0, T ) =
∞
Z
0
u σ
n2L(H
0, u) f (u) du.
The recaptured electrons emit radiation depending on their velocities and create continuum emission (see Sect. 1.1.1). The electrons then cascade down- wards to the ground level emitting photons with specific energies that equal the gaps between the levels. These photons create the observed line emission of hydrogen recombination lines, e.g the Brackett Series in the NIR. For a single hydrogen atom the lifetime of an excited state is of the order of 10
−4s − 10
−8s whereas the lifetime of a hydrogen atom against ionization is of the order of 10
8s. Therefore a recombined electron in an excited hydrogen atom will cascade down to the ground level before the hydrogen atom is going to be photoionized.
Molecular Emission Lines
It is deemed wise to study the H
2molecule, the most abundant molecular species.
Emission lines can be observed in the NIR, e.g., H
2(1-0)S(1) λ2.12 µm. The excitation energy of H
2corresponds to a temperature ≥ 500 K, hence H
2can be detected in a direct way only in hot gas, e.g., around star forming regions.
Therefore, CO (monoxide) transitions with an excitation temperature ≥ 5.6 K
are used instead of H
2to measure the H
2distribution in cooler regions, e.g.,
spiral arms. This is possible since H
2plays an important role in the production
1.1. Astrophysical Spectra of CO. The most important and fastest way is the radiative association of C
+with H
2forming CH or CH
2and neutral exchange reaction of CH and O (oxygen) to CO and H. The lowest rotational transition has a wavelength of λ 2 . 59 mm due to the low excitation energy of CO. Therefore, it is easier to excite CO collisionally to much higher rotational levels than H
2, e.g., CO(3-2).
Collisional Excitation
In the case of weak radiation fields molecular rotational-vibrational excitation is due to collisions. The very important case for this work is the hydrogen molecule which can be excited by collisions with other molecules or electrically neutral atoms. The density has to be low enough to allow radiative processes to de-excite these ro-vibrational levels instead of being de-excited collisionally. Furthermore, the emission line flux of these transitions is then proportional to the temperature T in the medium because the probability depends on the collisional excitation cross section integrated over the energy distribution of the colliding species. In thermal equilibrium the energy follows the Maxwell-Boltzmann distribution and the levels are populated according to the Boltzmann equilibrium
N
2N
1= g
2g
1exp −E
12kT
with levels N
i, where N
1is the ground state, statistical weights g
iand the energy difference between the two states, here E
12. Afterwards, the molecule will ra- diate a photon corresponding to its rotational-vibrational spectrum and return to the ground state.
UV-flourescence of Molecular Hydrogen
This process occurs in PhotoDissociation Regions (PDRs), i.e. the region that is adjacent to H ii regions. The ionization of the gas in the PDR is due to transmitted stellar continuum and the emission produced in the H ii region, e.g., free-bound and free-free emission. The Lyman-Werner bands of molecular hydrogen lie between the Lyman limit ∼ 912 Å and ∼ 1500 Å in the UV and are therefore populated in this process. Furthermore, the Lyα emission falls into this region which additionally can excite molecular hydrogen. The H
2molecule has to be already in a vibrationally and rotationally excited state, i.e. at temperatures &
1000 K by collisional excitation, to achieve a good resonance with the Lyα line.
Most of the hydrogen ( ∼ 90%) decays into excited bound rotational-vibrational
levels whereas the rest decays into unbound continuum levels.
1. Introduction
1.1.3 Absorption
The intensity I received from the observed source is usually not the initial in- tensity I
0of this source as defined by the mechanisms described above. The absorption of photons with a specific energy was mentioned in Sect. 1.1.2 lead- ing to absorption lines. The photons also encounter and interact with dust clouds on their way to the observer. This interaction leads to absorption of high en- ergetic photons from UV and optical bands and reemission in infrared bands, e.g., at ≈ 60 µm. As a simplification these clouds can be seen as a dust screen with constant density n
dof the dust grains and a constant path length x
d. When it is assumed that scattering of photons is negligible the observed intensity I is defined as
I = I
0exp( −τ)
where τ is the optical depth, which depends on the effective cross section of the dust grains and the column density N = n
dx
dof the dust cloud. The extinction in the visual, A
v= 1.086τ, is usually used to give a measure for the absorbed light.
However, the extinction varies with wavelength; Cardelli et al. (1989) give a solution A
λfor the extinction curve at wavelength λ in the optical and NIR. The UV and optical bands are much more prone to extinction than the NIR bands.
Hence, dark dust lanes in the optical tend to disappear when the same region is viewed in the NIR.
1.2 AGN Taxonomy
It is widely believed that all galaxies harbor a SMBH at their center. However, only a fraction of these are in an active accretion phase which marks them as an AGN. The closest SMBH is the black hole at the center of the Milky Way, also known as Sagittarius A* (SgrA*). It is usually observable in radio and in X-ray but very faint in other wavelength regimes when it is not flaring, i.e. no accre- tion event is taking place. The mass of SgrA* is calculated to ∼ 10
6M from observed stellar orbits (Eckart & Genzel 1996; Genzel et al. 1997; Eckart et al.
2002; Sch¨odel et al. 2009). It is these orbits that constrain the space in which the central mass has to be confined and lead to the only possible assumption that the central mass has to be a SMBH.
SgrA* is so low in activity that the associated radiation would not be de-
tectable if it were in another galaxy. The topic of this thesis, however, is extra-
galactic AGNs of which there are several types distinguished mainly by lumi-
nosity but also in spectral features (e.g., strong or faint radio emission) that will
1.2. AGN Taxonomy be introduced in the following. The main difference of AGNs and H ii regions, which are ionized by young, bright, and hot stars, is the wide range and strength in ionization, e.g., the ionization of the coronal line [Si vi] λ 1 . 963 µ m with an ionization potential of 167 eV which cannot be achieved by stars. An impor- tant attribute is the emission line ratio of the emission lines [O iii] λ5007 Å over H β λ 4861 Å and [S ii] λλ 6716 Å, 6731 Å over H α λ 6563 Å with typical values for AGNs of [O iii]/Hβ > 3 and/or [S ii]/Hα > 0.4.
1.2.1 Active Galaxies Seyfert galaxies
Seyfert galaxies are named after Carl Seyfert who observed a sample of galax- ies with stellar-appearing cores (high central surface brightness) using optical spectroscopy in 1948. He found that several of these galaxies show strong high-excitation nuclear emission lines and that the hydrogen lines are sometimes broader than others. The definition of a Seyfert galaxy is that its absolute B- band magnitude M
B> − 21.5 + 5 log h
0(Schmidt & Green 1983) and that strong, high-ionization lines are present. In general, a Seyfert host galaxy is clearly de- tectable but the nucleus is very bright and has the appearance of a superimposed star. Because the host is resolved stellar absorption features, e.g., Si i λ1.59 µm, CO(2-0) λ 2 . 29 µ m, created mainly by evolved bulge populations, can be de- tected.
There are two types of Seyfert galaxies, Seyfert 1 and Seyfert 2 galaxies.
Their main difference is the appearance or non-appearance of broad permitted lines in the nuclear spectrum, e.g., Hα line emission with a Full Width at Half Maximum (FWHM) > 1000 km s
−1. These broad lines are seen in Seyfert 1 nuclei. Since exclusively permitted lines are observed the electron density n
ein the emitting region has to be of the order of n
e≥ 10
9cm
−3. At these densities the non-electric-dipole transitions are suppressed by collisions. Broad lines are detected in several atoms, e.g., H i, He i, He ii, Fe ii.
Narrow emission lines are seen in both types, Seyfert 1 and Seyfert 2 nuclei.
They have widths of several hundred km s
−1and are broader than emission lines originating in planetary nebulae or classical H ii regions. Narrow emission lines in nuclear spectra are observed in all kinds of atoms and in both permitted and forbidden transitions. Hence, the electron density in this region cannot be as high as in the broad line emitting region and corresponds to n
e= (10
3− 10
6) cm
−3. Forbidden lines are for example [O iii] λλ4595 Å, 5007 Å or [Fe ii] λ1.644 µmand permitted lines are H αλ 6563 Å, He ii λ 4686 Å, or Br γλ 2 . 166 µ m.
Other differences are a usually strong absorption component in the X-ray
regime ( N
H> 10
22cm
−2) in Seyfert 2 nuclei and weak AGN continuum in the
1. Introduction
optical and UV. Hence, Seyfert 1 nuclei show stronger X-ray emission and a prominent power-law continuum from the AGN in the optical and UV.
Quasars
Quasi Stellar Radio sources (Quasars) or Quasi Stellar Objects (QSOs) are de- fined as having an absolute magnitude M
B< − 21 . 5 + 5 log h
0. They are the most luminous subclass of AGNs. In contrast to Seyfert galaxies QSOs outshine their host galaxies by more than a factor 100 hence the host is either not detected or only a faint stellar emission halo can be perceived. Due to their brightness QSOs can be observed at very high redshifts z > 7 which can be used to re- trieve information about the galactic and cosmological environment in the early universe.
Radio Galaxies
There are radio loud galaxies that exhibit similar optical spectra to Seyfert galax- ies. These are called the Narrow-Line Radio Galaxy (NLRG) as the counterpart to Seyfert 2 galaxies and the Broad-Line Radio Galaxy (BLRG) as the counter- part to Seyfert 1 galaxies. The BLRGs usually show a composite nuclear spec- trum, indicating strong star formation in the center whereas the NLRGs show almost no difference to Seyfert 2 galaxies except that they are usually ellipticals.
Low-Ionization Narrow Emission Region Galaxies
Low Ionization Nuclear Emission Region (LINER) galaxies are those AGNs that exhibit an [O iii]/Hβ < 3 ionization but with an [S ii]/Hα > 0.4 ratio. The latter ratio distinguishes these galaxies from H ii galaxies whereas the first one distin- guishes them from other AGNs, e.g., Seyfert galaxies, that show [O iii]/Hβ > 3 ratios (see also Sect. 1.4 and Fig. 1.3). There are other ratios that can distinguish H ii galaxies and LINERs but these can be affected by strong extinction effects.
From Surveys it seems that the youngest galaxies of Hubble type Sc are predominantly (> 80%) H ii galaxies whereas this trend turns for Sb and Sa galaxies toward an ∼ 80% LINER fraction. For ellipticals the fraction of nuclear LINER spectra is at about 46%.
Although LINERs are usually compared to Seyfert 2 galaxies, which might have historical reasons, there are type 1 and type 2 LINERs similar to Seyfert galaxies.
Blazars
Blazars show almost no signs of emission or absorption lines, although with high
signal-to-noise ratios weak nebular emission or stellar absorption features can be
1.2. AGN Taxonomy detected. These sources show large polarization of a few percent whereas usual AGN show less than one percent polarization. The variability is strong with sometimes more than 0.1 magnitudes on time scales as short as a day. These effects probably stem from very strong relativistically beamed components close to the line-of-sight. It seems that all blazars also show strong radio emission.
1.2.2 The Unified Model
All the above mentioned characteristics describe one phenomenon, the AGN.
The question arises: Are all these AGNs different or do they only appear to be different? The thing that all AGNs have in common is the very bright nu- clear region. This bright continuum emission is responsible for the ionization of the Broad-Line Region (BLR) and Nroad-Line Region (NLR). In Seyfert 1s the broad emission is highly correlated with continuum fluxes which is why it is used for reverberation mapping
6calculations. In Seyfert 2s the AGN featureless continuum at 4800Å and the narrow Hα emission are logarithmically correlated with a slope of ∼ 1 (Shuder 1981). These observations imply that both, NLR and BLR, are ionized by the AGN continuum.
Another intriguing observation was first made by Antonucci & Miller (1985), who observed the Seyfert 2 galaxy NGC 1068 in polarized light. In other obser- vations NGC 1068 did not show any sign of broad emission lines hence its clas- sification as a Seyfert 2 galaxy. However, in polarized light broad emission lines did become apparent. This detection was not the only one of a BLR in polarized light and implied strongly that Seyfert 1 and 2 nuclei are intrinsically the same.
The UM tries to explain the characteristics mentioned in Sect. 1.2.1 by ori- entation effects. This is possible since AGNs show rather an axial than a spher- ical symmetry. An example from which this can be inferred are observations of nearby AGNs and their NLRs which show a cone-like structure. Other examples are radio jets in radio loud AGN. One effect of this axial symmetry would be the unobservable BLR in Seyfert 2 galaxies (except for polarized straylight) and the high column densities from X-ray observations in Seyfert 2 galaxies in contrast to low column densities in Seyfert 1 galaxies.
The sketch in Fig. 1.2 shows an example of how the composition of the central few parsec
7of an AGN might look and how the viewing angle changes the observed characteristics. I will describe these different components in detail in the following.
6
Reverberation mapping measures the light travel-time delay between an intensity changing continuum source and the responding BLR clouds. From this time delay the size of the BLR can be inferred and further on an estimate can be given for the mass of the SMBH.
7
1 pc≈ 3.1 × 10
18cm
1. Introduction
Seyfert 2 Seyfert 1,
QSO
NLR
BLR Torus
Disk Jet
Blasar
edge-on, 90°
face-on, 0°
BH
Figure 1.2: A sketch of the different components of an active galactic nucleus. Note that the scales are adapted to be able to show all components. For more detail see text.
The Super Massive Black Hole
Direct proof for SMBHs is lacking but the evidence, e.g., very high continuum luminosities, points toward gravitational accretion of matter by a central mass, the SMBH. Typical values for the mass of these black holes are 10
6M in nearby AGN and more than 10
9M in more distant and massive galaxies. The mass can be inferred assuming isotropy and a stability of the source. When assuming spherical accretion onto the SMBH the highest possible luminosity depends on the mass of the SMBH and is called the Eddington luminosity
L
E≤ 4 πGm
pc σ
eM,
with the gravitational constant G , proton mass m
p, the speed of light c , and
the Thomson scattering cross-section σ
e. This is derived by considering that
the radiation pressure force cannot be higher than the gravitational force of the
SMBH for material to be accreted onto it. Analogue the Eddington mass M
Eis
1.2. AGN Taxonomy
defined which gives the lowest possible mass to an observed luminosity M
E= 8 × 10
5L
44M
with L
44as the bolometric luminosity of the central source in units of 10
44erg s
−1. The fueling of the SMBH can be approximated from the energy available in a mass M, E = ηMc
2, where η is a scaling factor for the efficiency of mass to energy conversion.
8The time derivative of this energy gives L = η Mc ˙
2and an Eddington accretion rate of
M ˙
E= L
Eηc
2using the Eddington luminosity L
E.
The Accretion Disk
The accretion disk is of the size of ∼ 10
15cm and its structure depends on several parameters, e.g., magnetic field strength, accretion rate, disk corona, and jets.
The energy of a given particle is supposed to be dissipated locally at a radius r to the black hole. The medium of the accretion disk is supposed to be optically thick. Then local black body emission at radius r in the disk can be assumed. For black holes with a mass of 10
8M and accretion rates close to their Eddington accretion the temperature peaks at about 5 × 10
5K in the innermost parts of the accretion disk. It is assumed that the big blue bump, seen in the optical and UV is thermal emission at temperatures of 10
5±1K. From these estimations the peak luminosity of the black body emission is situated at about 100 Å, the extreme UV. For Low-Luminosity AGNs (LLAGNs) with a mass of 5 × 10
6M
and accretion rates of 10
−4with respect to their Eddington accretion the peak is at slightly longer wavelengths ∼ 200 Å. For these typical accretion rates the disk can be seen as thin and the efficiency at which it radiates is high (η ≈ 0.1).
The spectrum is then a composite of black body emission at the temperatures that exist in the disk.
9At low accretion rates the disk can become optically thin which allows for an ion-torus to develop. These ion-tori and its magnetic field properties are regarded as important tools towards the creation of jets.
8
A typical value for η is 0.1, which implies an efficiency of 10% for the conversion rate.
Compared conversion efficiency of nuclear fusion, which is less than 1%, accretion is 10 times more efficient.
9
The temperature dependency on the disk radius, distance r from the BH, is T (r) ∼ (r/R
S)
−3/4for an optically thick disk.
1. Introduction
The Broad Line Region
The broad line region are clouds of temperature T ∼ 10
4K and an electron den- sity of 10
8cm
−3< n
e< 10
11cm
−3. They are at a distance of lightdays, in Seyferts, and can be at a distance of lightyears, for QSOs, to the SMBH.
10These clouds absorb the ionizing UV continuum emission of the central source, e.g., the accretion disk, and show characteristic line emission and variability in accor- dance to the continuum variability. The spectral lines observed originate mostly from allowed transitions. This fact is used to derive the mentioned lower and upper limits for the electron density in the BLR clouds. The name ’broad line’
stems from the emission lines’ FWHM which is typically ∼ 5000 km s
−1. The width of the lines is usually associated with differential Doppler shifts of the bulk motion of individual clouds. The bulk motion is assumed to be determined by the SMBH, e.g., Keplarian orbits, but the specific structure, e.g., a BLR disk, is unknown.
From reverberation mapping
11the actual size of the BLR can be deduced.
Since the BLR is thought to be very close to the center its motion can be seen as virialized hence the black hole mass can be estimated using the virial theo- rem when velocity v and distance r are known. The velocity can be measured from the broad-line widths. This estimate gives a much better and usually about one magnitude higher mass of the SMBH than the estimated Eddington mass.
Kaspi et al. (2000) showed empirically that the featureless continuum luminos- ity at 5100 Å correlates with the radius of the BLR. Inferring further Greene
& Ho (2005) show that the broad H α correlates with the featureless continuum luminosity at 5100 Å. This allows the use of broad-line characteristics only to determine the black hole mass, for more detail see Sect. 1.3.2.
The Obscuring Torus
Beyond the BLR the optically thick torus awaits. The torus consists of dust and gas which means that it has a lower limit for its distance to the ionizing central source of r & 10
17cm where the dust sublimation temperature T ≈ 1300 K is reached. How far the torus extends is not clear but observations of Seyfert galaxies using infrared interferometry (e.g., Burtscher et al. 2013; Tristram et al.
2014, and references therein) show dust emission on parsec to few parsec scales.
The structure of the gas and dust is believed to be toroidal around the central source, hence introducing a rather axial than spherical structure to the AGN en-
10
One lightyear corresponds to ≈ 9.5 × 10
17cm or 0.3 pc.
11
Reverberation mapping is the time resolution of luminosity change in the BLR with respect
to continuum variation.
1.3. Black Hole Mass Estimators vironment. The torus is supposed to be responsible for the observed differences in Seyfert 1 and Seyfert 2 nuclei by blocking the emission of the inner sources, e.g., continuum emission from the accretion disk and broad emission lines from the BLR.
The Narrow Line Region
The narrow line region is located at the polar regions of the toroidal structure and extends from a few lightyears (& 10
18cm) distance to the central source up to several hundred pc. These clouds show line emission of allowed and for- bidden line transitions. The observed transitions imply an electron density of n
e∼ 10
4cm
−3and temperatures of T ∼ 10
4K. The NLR is the only part of this AGN environment described here that can be resolved in optical and NIR wavelengths, simply due to its strong emission and large spatial scale. The line emission from this region is used to discriminate AGNs from star forming re- gions and galaxies by emission line ratios and simply by the ionization potential of some transitions, e.g., [Si vi] λ1.96 µm with an ionization potential of 167 eV.
Jets
Jets are powerful energy outflows which are usually highly collimated and are directed towards the polar openings left by the torus. These energy outflows are best studied with interferometers in the radio regime where high spatial resolu- tion can be achieved, e.g., the Very Long Baseline Interferometer (VLBI) at a few 10 µas angular resolution. Jets directed almost along the line of sight of the observer are the probable explanation to the occurrence of Blazars. They can cause the observed effects of high luminosity, strong polarization, and variability.
1.3 Black Hole Mass Estimators
The best estimator for a BH mass is a star orbiting undisturbed in the potential of the SMBH. To observe this is impossible, since there are always a lot more stars that will have an influence on the orbit due to their potential. Nevertheless, in the Milky Way single stars can be observed and the BH mass is estimated from their orbital properties (e.g., Eckart & Genzel 1996; Genzel et al. 1997; Eckart et al.
2002; Sch¨odel et al. 2009) with corrections taken into account.
12This method
12
The first fully observed orbit was of the star S0-2 which will have its next periapse in the end
of 2017. The only other star for which all orbital elements are known is S0-102, however, this
star 16 times dimmer than S0-2 and is more challenging to observe due to confusion with other
sources.
1. Introduction
cannot be used for other galaxies hence other properties, e.g., BH mass - host galaxy relations and BLR characteristics, have to be invoked.
1.3.1 Black Hole Mass to Host Galaxy Relations
The SMBHs studied here are of the order of 10
6− 10
7M . Their sphere of influence
13ranges from 0.5 to 5.0 pc according to R
BH= GM
BH/σ
2?with the gravitational constant G, the black hole mass M
BH, and the stellar velocity dis- persion of the bulge σ
?and is therefore not resolved in the observed data. This means that a BH mass estimate from dynamical means, e.g., stellar orbits, can- not be determined. Furthermore, the SMBH is directly influencing only a very small fraction of the host galaxy. Nevertheless, several empirical relations have been found that connect the BH mass and the bulge properties of the host.
The M − σ
?Relation
The relation that nonetheless is relying on dynamics is the M − σ
?relation.
It was first found by Ferrarese & Merritt (2000); Gebhardt et al. (2000) which found different slopes of M ∼ σ
4.8?and M ∼ σ
3.75?respectively. It was later improved by Tremaine et al. (2002). Ferrarese & Merritt (2000) argue that this correlation might stem from a fundamental connection between BH mass and bulge mass with the stellar dispersion σ
?being a good predictor of the bulge mass with the idea that early-type
14galaxy masses scale with their luminosities M ∼ L
5/4and the luminosity scales with L ∼ σ
4. Another idea is that the dispersion represents a measure of the potential well depth in which the BH formed. This is supported by simple BH-host galaxy growth models (e.g., Silk
& Rees 1998). Both explanations lead to a dependency of M ∼ σ
5?.
The latest relation found by G¨ultekin et al. (2009) from a sample of 49 galax- ies is
M
•= 10
8.12±0.08× σ
?200 kms
−1!
4.24±0.41M
where they notice a significantly lower scatter in a subpopulation of ellipticals.
This difference is not clear but might arise from systematic errors in BH mass measurements of late type galaxies or because ellipticals lie closer to the ridge line of the M
•− σ
?relation.
13
The sphere of influence of a BH is the region where the gravitational potential of the BH dominates over the stellar gravitational potential.
14
Early-type galaxies are elliptical and lenticular galaxies after the Hubble classification.
1.3. Black Hole Mass Estimators Recently Graham & Scott (2013) found that a significant fraction of barred galaxies show a factor of two different relation from non-barred galaxies. How- ever, they do not find if barred galaxies harbor undermassive BHs or if they tend to towards brighter luminosities.
Other M
•– Bulge Relations
The BH mass seems to be related not just to the velocity dispersion of the bulge but also to the luminosity L
bulge(e.g., Marconi & Hunt 2003), mass M
bulge(e.g., H¨aring & Rix 2004), and the S´ersic index n (e.g., Graham & Driver 2007). Af- ter first empirical investigations it was believed that only the M
•− σ
?relation showed a scatter that was tight enough to be acceptable as a correlation between M
•and the σ
?.
Marconi & Hunt (2003) had the idea to correlate the L
bulgein the NIR to the BH mass. Earlier works (Magorrian et al. 1998) have concentrated, probably out of historical reasons, on the B-band luminosity. The NIR is far less affected by extinction effects and traces much better the mass dominating stellar population, e.g., due to a lower variation of the M/L ratio (Gavazzi 1993). Additionally, they introduced two-dimensional bulge-disk decomposition to determine the needed parameters. Furthermore, they find that the M
•- M
bulgeshows a tight relation with the simple assumption that the virial bulge mass M
bulge= R
eσ
e, with the effective bulge radius R
eand effective Stellar Velocity Dispersion (SVD) σ
e. H¨aring & Rix (2004) tightened the M
•-M
bulgerelation by modeling of the bulge parameters, e.g., the SVD.
The M
•- n relation is based on the concentration of stars where the S´ersic index n is the parameter from an R
1/nlight profile fit (Graham & Driver 2005, and references therein). The idea behind this approach is that it is presumably easy to obtain, i.e., only images are needed to derive the S´ersic index n , and that it is less affected by kinematical effects, e.g., from substructures in the bulge and the underlying disk.
1.3.2 Broad Line Region Relations
Extragalactic sources, i.e., other galaxies than the Milky Way, are too far away
to resolve single stars. However, in AGN properties of regions that are within
the sphere of influence of the BH, e.g., the BLR, can be observed due to their
high luminosity. From the characteristics of these regions a mass of the SMBH
can be inferred. As mentioned in Sect. 1.2.2 the exact structure of the BLR is
not known therefore an assumption which has to be made is that the BLR clouds
are virialized and on Keplerian orbits around the SMBH. This assumption gives
1. Introduction
a mass estimate depending on the velocity of the clouds v and the distance r to the SMBH.
M
•= r v
2G .
Keplerian orbits are assumed for the BLR clouds hence the FWHM of the broad lines is supposed to be created by Doppler shift. The velocity can then be obtained from the measured FWHM of an observed broad line. To account for using half the FWHM and for velocities in three dimensions the velocity derived from the FWHM is corrected by a factor of √
3 / 2.
The radius can be obtained by reverberation mapping for some AGN. Rever- beration mapping (Blandford & McKee 1982; Wandel et al. 1999; Kaspi et al.
2000) analyzes the time response of the ionization lines in the BLR to the vari- able ionizing continuum, i.e., emission from the accretion disk, assuming an expansion of the continuum photons at the speed of light, and a free path way between continuum source and BLR. This method is limited only by time, i.e., time needed for an adequate signal-to-noise
15and an appropriate time resolution of the variability and response.
Wandel et al. (1999) and Kaspi et al. (2000) investigate the BLR radius to continuum luminosity λ5100 Å relation empirically and find differing slopes for their correlations ( R ∼ L
0.5and R ∼ L
0.7respectively). The problem with the continuum luminosity at λ5100 Å is that it can be contaminated, e.g., star forma- tion in the host. Bentz et al. (2006, 2009) revisit this relation and find that with proper host starlight correction the relation is R ∼ L
0.52similar to Wandel et al.
(1999) and similar to simple photoionization models.
To omit the contamination issue Greene & Ho (2005) analyze the relation of the Hα and Hβ broad emission lines to the λ5100 Å continuum and to each other respectively regarding luminosity and width. Their empirical approach proves the single epoch mass estimates by Dibai (1977) who used a basic photoion-
15
The signal-to-noise ratio can be improved by adding up several observations taken one after the other if the observed signal can be assumed constant. The idea behind this is that the random noise will cancel out whereas the signal grows by summation. This is inferred from simple error propagation
S N = nS
√ nσ
2= √ n S
σ
with S the signal, N the noise in one measurement, n the number of summed observations, and
σ the standard deviation of a single measurement. However, not all noise in a system is random,
e.g., noise introduced by vibrations at specific frequencies, therefore this method has limits to
improving the signal-to-noise ratio.
1.4. Star Formation in Galaxies ization model
16. Kim et al. (2010) update the relations found in Greene & Ho (2005) by using the radius-continuum relation by Bentz et al. (2009), which is recalibrated using proper continuum decomposition. They find a relation of
M
•= 10
6.88±0.57L
Hβ10
42erg s
−1!
0.46±0.05FW H M
Hβ10
3km s
−1!
2M
with the H β luminosity and FWHM L
Hβand FW H M
Hβ. They go on and derive new mass estimators from the NIR Paα and Paβ lines to avoid contamination by dust obscuration and imperfect extinction correction.
1.4 Star Formation in Galaxies
Star formation is the process that turns hydrogen into metals therefore changing the composition of the gas in a galaxy. Hence, star formation is the important process in galaxy evolution, e.g., young galaxies show bluer colors due to hot young stars than old galaxies which are red in color due to old cool stars. This process is usually a local phenomenon in a galaxy where out of molecular gas clouds several millions of stars can form. For a molecular cloud to collapse and fragment into dense cores it needs to be cooled and the angular momentum of the cloud has to be lowered sufficiently. The gas is cooled by collisions with dust particles or metals which then emit photons hence taking away kinetic energy and transforming it into emission which then can leave the molecular cloud. The angular momentum problem is still unsolved but on large scales density waves, i.e., spirals or bars, can induce transport of angular momentum and allow for a collapse of molecular clouds.
1.4.1 Diagnostic Diagram
There are also cases where across the whole galaxy star formation is taking place almost simultaneously, on galactic scales. These are called Starburst galaxies
16
The ionization parameter U is defined as:
U = Q
4πr
2cn
ewith the Q the number of ionizing photons, r the distance to the ionizing source, c the speed of light, and n
ethe electron density. The average energy of an ionizing photon can be written as E ¯ = L
ion/Q with the ionizing luminosity L
ion. Hence, the equation above can be written as
U = L
ion4πr
2Ecn ¯
eand distance to the ionizing source and luminosity should be related as r ∼ L
0.5.
1. Introduction
and they are very bright in the UV regime, i.e., direct light from young stars, e.g., OB type stars, is seen, or in the Far-Infrared (FIR) regimes due to high emission from dust by reemitted UV photons. Since it is not easy for star for- mation to occur even locally, it must be drastic events that trigger star forma- tion all over the galaxy at the same timescales, e.g., galaxy-galaxy encounters, where huge tidal forces act on the gas distribution in the participating galaxies.
Due to the strong UV and optical emission it is not easy to distinguish starburst from Seyfert galaxies by their color. As mentioned above Starburst galaxies show strong emission in UV but also in spectral emission lines. To distinguish between Starburst and Seyfert galaxies emission line ratios in diagnostic dia- grams, also Baldwin, Phillips & Terlevich (BPT) diagrams, are used. The most famous BPT diagram (see Fig. 1.3) is the ([N ii] λ 6583 Å)/(H α λ 6563 Å) vs.
([O iii] λ5007 Å)/(Hβ λ4861 Å). The line ratios are chosen from nearby lines to minimize the effect of extinction. The solid line marks the demarcation between
Figure 1.3: The BPT diagram showing ([N ii] λ6583 Å)/(Hα λ6563 Å) vs.
([O iii] λ5007 Å)/(Hβ λ4861 Å). Open circles represent H ii region galaxies, filled circles represent Seyfert 2 like AGN and the filled triangle represent LINERs. The figure was taken from Peterson (1997).
galaxies dominated by star formation and galaxies dominated by nuclear AGN emission. In the NIR the line ratio (H
2(1-0)S(1) λ2.122 µm)/(Brγ λ2.166 µm) vs. ([Fe ii] λ 1 . 257 µ m)/(Pa β λ 1 . 282 µ m) or modifications of it are used (see Fig.
4.6). These diagrams are not only to be used on apertures as big as the galaxy it-
self but also on subregions, e.g., nucleus, star forming regions, or shock regions,
to determine the excitation mechanism in this part of the galaxy.
1.4. Star Formation in Galaxies
1.4.2 Continuum Decomposition
Normal galaxies show a variety of stellar populations from newly formed to old stars. These form the Spectral Energy Distribution (SED) of normal galaxies together with gas and dust emission at different temperatures. To estimate the fractions of these different components of the spectrum a decomposition of the SED is needed, which is a complicated task. Different stellar populations can be traced by imprints in the spectrum, e.g., occurrence of hydrogen recombination lines in absorption or other absorption lines like CO(2-0) λ 2 . 29 µ m. Bumps in the spectrum resulting from the black body emission peaks can be used to iden- tify dust emission, e.g., hot dust at its sublimation temperature of T ∼ 1300 K peaks at a wavelength of λ ∼ 2 . 23 µ m. But for a sophisticated approach data from several wavelength regimes are required to disentangle the composition of an observed galaxy spectrum properly. For example, different compositions of star forming ages and metallicities can create similar absorption features. A good approach is a linear combination of several template stars, dust black body emis- sion, and a power-law together with a dust screen component. Based on Smaji´c et al. (2012) following expression will be used
con
obs= exp ( −τ) ×
X
i
![Figure 4.3: Shown are the flux [10 − 20 W m − 2 ], FWHM [km s − 1 ] and LOSV [km s − 1 ] maps (left to right) of the [Fe ii ], Brγ, and H 2 λ(1-0)S(1) lines (top to bottom)](https://thumb-eu.123doks.com/thumbv2/1library_info/3697112.1505842/57.892.202.676.323.812/figure-shown-flux-fwhm-losv-right-brγ-lines.webp)
![Figure 4.4: ALMA cycle 0 molecular 12 CO(3-2) maps. (a) shows the emission map of 12 CO(3-2) [Jy beam − 1 km s − 1 ] overlayed with H 2 (1-0)S(1) emission contours](https://thumb-eu.123doks.com/thumbv2/1library_info/3697112.1505842/60.892.211.682.388.875/figure-alma-cycle-molecular-emission-overlayed-emission-contours.webp)
![Figure 4.5: EW maps of narrow Brγ, [Fe ii ], and H 2 λ(1-0)S(1) emission lines in Å. For details, see Sect](https://thumb-eu.123doks.com/thumbv2/1library_info/3697112.1505842/61.892.202.676.243.725/figure-maps-narrow-brγ-emission-lines-details-sect.webp)
![Figure 4.6: Diagnostic diagram for the classification of the nuclear emission. The [Fe ii]](https://thumb-eu.123doks.com/thumbv2/1library_info/3697112.1505842/63.892.258.624.700.970/figure-diagnostic-diagram-classification-nuclear-emission-fe-ii.webp)
