Andreas Wagner, Stefan Altherr, Bodo Eckert and Hans J ¨org Jodl Department of Physics, Technical University of Kaiserslautern, Erwin-Schr¨odinger-Straße, 67663 Kaiserslautern, Germany
E-mail:eckert@physik.uni-kl.de
Received 20 June 2006, in final form 13 September 2006 Published 27 September 2006
Online atstacks.iop.org/EJP/27/L31
Abstract
In a series of letters we present teaching videos on topics where the learners of physics used to have problems. The first video presents an experimental set-up by which the absorption lines (D1, D2) of sodium can be resolved simultaneous with the emission lines. The second video allows us to determine their wavelengths in comparison with calibrated spectral lines of mercury. This type of multimedia should not replace the real demonstration experiment, but is of good support for a long distant learner or for simply reading a textbook.
S This article has associated online supplementary data files
(Some figures in this article are in colour only in the electronic version)
Introduction
In a series of papers we present new multimedia for teaching physics at school and university level. We selected topics where students used to have deeper understanding problems and/or where demonstration experiments used to produce problems (e.g. about Reynolds number, Coriolis force, diffraction limited resolution, Navier–Stokes equation [1,2]).
The transition from classical physics to modern physics (end of 19th century) is mostly demonstrated by quantum mechanics. Traditional experiments to support such an introduction into quantum physics are Franck–Hertz experiment, Compton effect, spectral lines, photoelectric effect etc. At school level this topic is generally taught as anx-hours course about atomic models (x∼5–10 depending on curriculum); at university level students follow a lecture on modern physics (e.g. according to text books like that of Alonso and Finn [3]) and/or perform lab experiments. Nowadays self-learning units for long distant teaching offer e-learning materials but without providing real experiments.
To teach that topic there exist many good textbooks (e.g. [3–5]) and many publications in journals can be found1. In general, various atomic models previous to Bohr are presented,
1 e.g. inEur. J. Phys.andAm. J. Phys.
0143-0807/06/060031+05$30.00 c 2006 IOP Publishing Ltd Printed in the UK L31
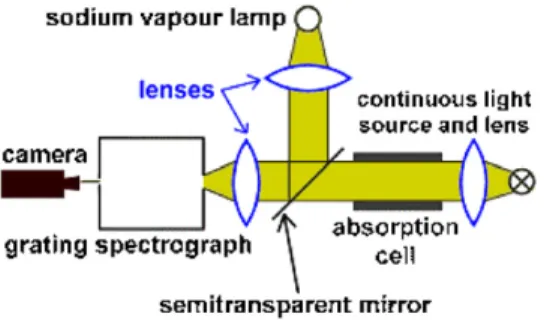
Figure 1.Schematic sketch of the experiment on absorption and emission spectrum of sodium.
followed by the treatment of the models of Bohr and Sommerfeld (and of more recent models in terms of probability and orbital theory later on). The main result is that—opposite to classical physics—energies in atoms are discrete; then this hypothesis is proven by suited experiments such as Franck–Hertz experiment and/or demonstration of spectral lines. A key demonstration experiment among others (spectral lines of discharge lamps, Fraunhofer lines in the spectrum of the sun) is the demonstration of absorption and emission of the D lines of sodium. Concerning the experimental realization the real problem is not the spectral separation of the two lines by a suitable tool (appropriate gratings [6]) but the preparation of the sodium vapour for an absorption cell. In addition, sometimes the preparation of the optical path to resolve both D lines (λ∼0.6 nm) in absorption is the ‘standard’ problem.
Therefore, we offer a teaching video to demonstrate absorption/emission of visible light by atoms as a phenomenon (video 1) and to determine the wavelengths of D1and D2lines of Na (video 2). We present the video in such a way that the viewer can perform a quantitative measure looking at the videos. In case the learner has access to the real experiment then, of course, this is the best solution. In case not and in case the learner can view only static figures or photos in textbooks then we are convinced that these teaching videos are a much better approach. The aim of these videos (and of this letter) is not to teach atomic physics with all ingredients but only to focus on the demonstration experiment.
Video 1: absorption and emission spectrum of sodium
All components of the experimental set-up are introduced step by step and their function is explained (real set-up, schematic sketch figure1). The light of a continuous light source is collimated by a lens and sent through an absorption cell filled with a small piece of solid sodium. A second lens focuses the beam on the entrance slit of a grating spectrograph.
The spectrum is recorded by a digital camera (and can be observed on a monitor screen in the demonstration experiment). The temperature in the absorption cell rises slowly from room temperature up to about 240◦C (reading the thermometer in the video); via camera we observe first only the continuous spectrum of the light source. Above about 190◦ C when most of the sodium is vaporized we identify two dark lines, the so-called D1and D2lines of Na (transitions 32S1/2→32P1/2and 32P3/2). In order to observe simultaneously the related transition in emission (32P3/2and 32P1/2→32S1/2) we extend the set-up by a sodium discharge lamp2and a semitransparent mirror (figure1). This refinement allows us to ‘switch’ between
2 Although the sodium atoms in the absorption cell, after absorbing light, emit light of the same wavelength during relaxation, the intensity is much low to yield an observable spectrum by the experimental set-up applied here.
Therefore, a discharge lamp is used delivering light of reasonable high intensity.
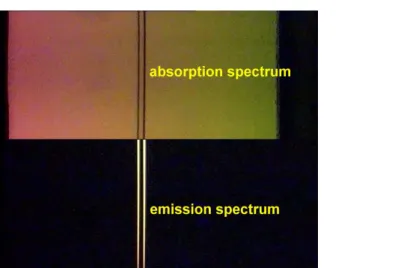
Figure 2.Superimposed section of absorption and emission spectrum of sodium vapour.
Figure 3.Schematic sketch of the experimental set-up to determine the wavelengths of the emission D lines of sodium.
both spectra by alternatly covering the light sources. For the video we used the advantage of digital editing to combine both spectra which have been recorded separately: we observe the absorption spectrum in the upper part and the emission spectrum in the lower part of the screen (figure2).3
Video 2: wavelength determination in the sodium spectrum
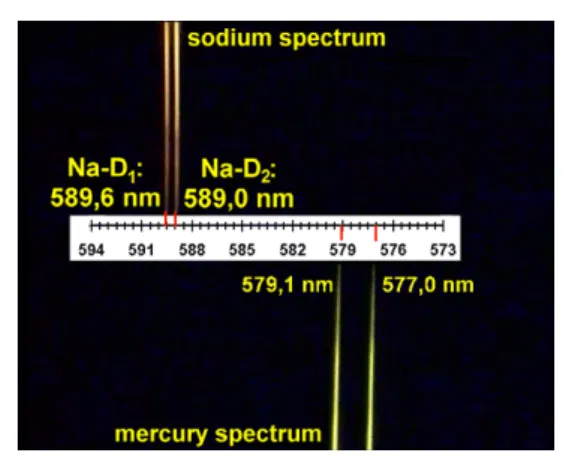
Again the components of the real set-up and the schematic sketch of the set-up are presented (figure3). As a wavelength calibration we take the spectral lines of a mercury discharge lamp, which are lying close to the D1and D2lines of sodium (figure4). Both emission spectra can be superimposed by means of the beam splitter. This gives us an approximate linear scale for a small wavelength range from which we can now read the wavelengths: λ(Na-D1)∼
3 The alignment of both optical paths, e.g. the angle of incidence with respect to the entrance slit of the spectrograph, plays an important role. Since it is very difficult, if not impossible, to align both optical paths perfectly, in particular if using typical demonstration apparatuses, the absorption and the emission D lines of sodium in the video seem to be shifted horizontally with respect to each other. On the other hand, the degree of misalignment should be regarded as relatively small since the deviation of the position of the D lines in absorption and emission is of the order of the resolution of the optical system (ca. 0.1–0.2 nm against 0.6 nm line separation).
Figure 4.Simultaneous observation of a section of the sodium spectrum and the mercury spectrum.
589.6 nm and λ(Na-D2) ∼ 589.0 nm in comparison with the literature (589.593 nm and 588.996 nm [7]). However, the absolute position of the wavelengths has an error of about
±0.1 nm (see footnote 3). Since the fine structure splitting (P3/2and P1/2) is about 0.6 nm a sufficient wavelength resolution is mandatory.
Both videos should be integrated in a learning environment. The viewer may answer following questions or look up literature:
• how is the resolution of a grating spectrograph defined;
• estimate the resolution of the spectrograph in this video recorded experiment;
• what is the meaning of the symbols describing the transitions 32S1/2
−−−→abs
←−−−em 32P1/2and 32P3/2;
• the critical temperature of the absorption cell, above which absorption lines are detected, is about 190◦C, what can be deduced about the density of sodium vapour (vapour pressure)?
Further information
Both videos can be downloaded for free with average resolution4 or can be ordered from the authors on CD-ROM with higher quality5. (Most of our teaching videos are in English language; these ones here are only in German language available, but we provide a translation of the spoken German text in English language for better understanding6.)
References
[1] Wagner A, Altherr S, Eckert B and Jodl H J 2003 Multimedia in physics education: a video for the quantitative analysis of the Reynolds numberEur. J. Phys.24297–300
[2] Wagner A, Altherr S, Eckert B and Jodl H J 2006 Multimedia in physics education: a video for the quantitative analysis of the centrifugal and the Coriolis forceEur. J. Phys.27L27–30
4 The videos (size 10 MB and 7 MB in RealMedia format) can be downloaded at http://pen.physik.uni- kl.de/videos.html—see there under ‘Download’
5 The videos in avi format have a file size of 158 MB and 29 MB, respectively, and need DivX-Codec which will be provided on CD-ROM.
6 The German transcript and the English translation can be downloaded from the web address given in footnote 4 and is attached to this letter as additional material available online by the publisher.