Active Galactic Nuclei throughout the Active Galactic Nuclei throughout the Spectrum: M 87, PKS 2052−47, and the Spectrum: M 87, PKS 2052−47, and the
MOJAVE sample MOJAVE sample
Inaugural-Dissertation
zur
Erlangung des Doktorgrades
der Mathematisch-Naturwissenschaftlichen Fakultät der Universität Köln
vorgelegt von
Chin-Shin Chang
aus Taipei, Taiwan, ROC
Berichterstatter: Prof. Dr. Andreas Eckart
Prof. Dr. Anton Zensus
Tag der mündlichen Prüfung: 25. Oktober 2010
獻給我最親愛的父親母親與妹妹
To my beloved father, mother, and sister
Contents
Summary 7
Zusammenfassung 9
Summary (Chinese) 11
1 Introduction 13
1.1 AGN Classification and the Unified Model . . . 14
1.1.1 AGN Class . . . 14
1.1.2 The Unified Model . . . 16
1.2 Radiation Processes . . . 17
1.2.1 Thermal Emission . . . 17
1.2.2 Synchrotron Emission . . . 18
1.2.3 Inverse Compton Scattering . . . 20
1.2.4 X-ray Emission of AGN . . . 22
1.3 Very Long Baseline Interferometry . . . 23
1.3.1 Fundamentals of Radio Interferometry . . . 23
1.3.2 Synthesis Imaging . . . 26
1.4 The Study of Blazars . . . 26
1.4.1 The Emission of Blazars . . . 26
1.4.2 The Spectral Energy Distribution of Blazars . . . 28
1.4.3 Parsec-scale Jets: Intrinsic and Observed Properties . . . 29
1.4.4 The AGN Study in This Thesis . . . 30
2 A multi-band flare of the HST-1 feature in the M 87 jet 33 2.1 Introduction . . . 33
2.2 VLBI Observations and Data Analysis . . . 35
2.2.1 Very Long Baseline Array . . . 35
2.2.2 Observations and Data Analysis . . . 36
2.3 Results . . . 38
2.3.1 Imaging of the inner jet of M 87 . . . 41
2.3.2 Imaging of the HST-1 region . . . 42
2.3.3 Spectral properties of HST-1 . . . 42
2.3.4 HST-1 kinematics . . . 44
2.4 Discussion . . . 47
2.4.1 Variability timescale and HST-1 flaring region at parsec-scales . . 47
Contents
2.4.2 Speeds of HST-1 . . . 49
2.4.3 Detection limits . . . 49
2.4.4 HST-1 parsec-scale spectrum . . . 49
2.4.5 A blazar nature of HST-1 . . . 51
2.5 Summary and Future Work . . . 51
3 Blazar Flare: a Multiwavelength Study of the Flat Spectrum Radio Quasar PKS 2052−47 53 3.1 Introduction . . . 53
3.2 Data Acquisition . . . 56
3.2.1 The Multiwavelength Campaign . . . 58
3.3 Data Analysis . . . 59
3.4 Results . . . 60
3.4.1 The Multiband Properties of PKS 2052 − 47 . . . 60
3.4.2 The Broadband SED of PKS 2052 − 47 . . . 62
3.5 Discussion . . . 62
3.6 Summary . . . 64
4 The Broadband Spectral Energy Distribution of the MOJAVE Sample 67 4.1 The MOJAVE Sample . . . 67
4.1.1 Parsec-scale Jet Properties and High Energy Emission . . . 69
4.2 The Project . . . 70
4.3 Data Acquisition . . . 70
4.3.1 University of Michigan Radio Astronomy Observatory . . . 71
4.3.2 Fermi-GST AGN Multi-frequency Monitoring Alliance . . . 72
4.3.3 The Swift Gamma-Ray Burst Mission . . . 73
4.3.4 Fermi Gamma-ray Space Telescope . . . 76
4.4 Data Analysis . . . 78
4.4.1 Swift/XRT Data Reduction . . . 82
4.4.2 Swift/UVOT Data Reduction . . . 91
4.4.3 Extinction Correction . . . 92
4.4.4 Fermi/LAT data . . . 94
4.5 The Broadband SED of the MOJAVE sources . . . 95
4.6 Statistical Properties of the MOJAVE Sample . . . 133
4.6.1 Histograms . . . 133
4.6.2 Dispersion Relation . . . 138
4.7 Summary . . . 141
A The X-ray Spectra of the MOJAVE Sample 147
B The Broadband SED of the MOJAVE Sample 171
C Previously Published Broadband SED of the MOJAVE Sources 189
D Glossary of Acronyms 221
Contents
Acknowledgements 273
Acknowledgements (Chinese) 275
Erkl¨arung 277
Curriculum Vitae 279
Summary
Active galactic nuclei (AGN) are one of the many mysteries in the Universe. AGN hosts a super massive black hole (SMBH) in its center surrounded by a rotating accretion disk, and a powerful jet is ejected along the pole directions of the accretion disk. The powerful jet is definitely the highlight of AGN. Those extragalactic jets appears to have superlumi- nal motions up to 60 c, and they are very luminous and variable across the electromag- netic spectrum. The jets can be highly polarized, which indicates the existence of strong magnetic fields; they can have a highly bended morphology due to reasons we do not completely understand. Astronomers have been studying AGN jets for the past decades by performing observations from the radio to the γ-ray band, applying physical jet models to the observed properties, and trying to put the pieces into the whole picture. We now understand many aspects of the AGN phenomena, but a significant part is still missing.
The aim of this thesis is to study the extragalactic jets by using different approaches.
We investigate: (i) a bright feature in the jet of the radio galaxy M 87 as observed us- ing high-resolution VLBI technique; (ii) a multiband flare of the blazar PKS 2052 − 47 by conducting a multifrequency campaign; (iii) the broadband spectral energy distribu- tion (SED) of a radio-selected, statistically-complete sample of the most conspicuous AGN in the Northern sky: the Monitoring Of Jets in Active galactic nuclei with VLBA Experiments (MOJAVE) sample.
Very long baseline interferometry (VLBI) is a powerful technique that can resolve distant AGN to parsec-scales by combining global radio antennas to perform together as a giant telescope with a radius of the earth. With the VLBI technique, we are able to trace bright features being ejected from the center moving along the jet. In this thesis, we use the VLBI technique to detect a bright knot 80 pc from the center of the radio galaxy M 87.
It was suggested that the HST-1 knot was the site where a TeV flare of M 87 was generated from. By analyzing the VLBI data at 15 GHz from 2000 to 2009, we detected HST-1 during 2003 and 2007. We studied the apparent speed, the flux variability, and the spectral properties of HST-1. Although we found that the light curve of the compact HST-1 region at VLBA 15 GHz peaked in 2005, we saw that the HST-1 region was very extended and had a steep spectrum; the projected apparent speed of HST-1 was subluminal. Therefore, our results do not completely support the hypothesis.
Studying multiband flares is one of the best ways to distinguish different mechanisms
taken place in AGN. Current jet models suggest that time delays between multiband flares
have different features while the emission mechanism differs. In this thesis, we studied
the flat spectrum radio quasar PKS 2052−47, which experienced an optical flare followed
by a γ-ray flare in July 2009. We arranged a multiwavelength campaign from radio to
γ-ray after the blazar’s flare. In the campaign, VLBI observations by the Tracking Active
Galactic Nuclei with Austral Milliarcsecond Interferometry (TANAMI) program are in-
Summary
cluded in order to trace any change of jet morphology, if any; the millimeter radio flux density was measured by the Atacama Pathfinder EXperiment (APEX); the optical and the X-ray band observations were obtained by the Swift UV/Optical telescope (UVOT) and X-ray telescope (XRT); the γ-ray observations were obtained by the Fermi Large Area Telescope (LAT). We do not see significant change in the X-ray photon indices and fluxes during the 5-day Swift monitoring of the source.
The broadband spectral energy distribution reflects the emission properties of AGN, and it shows the energy output in different wavebands. By simulating physical jet models and reconstructing the broadband SED, one can probe the emission mechanism, the jet composition, the magnetic field, the bulk velocity in jet, and the structure of AGN. In this thesis, we study the broadband SED from the radio to the γ-ray band of a radio-selected sample. The MOJAVE program has been monitoring 135 radio-bright, statistically-complete sample of AGN using the Very Long Baseline Array (VLBA) at 15 GHz for a decade, and the MOJAVE sample is consisted of mostly blazars, which are AGN as seen jet-on. The typical broadband SED of a blazar has a double-hump profile. It is believed that the lower-energy hump is caused by the synchrotron emission from the AGN jet, and the higher-energy hump is produced by the inverse-Compton (IC) up-scattering of the seed photons from the jet or other external sources. We constructed a broadband SED catalog of the MOJAVE sample, and we applied polynomial fits to the observed data at the low and the high energy humps of the SED as a first approach to understand the properties of the sources. The peak positions of the two humps can be derived from the polynomial fit for many of the MOJAVE sources except for some sources having deviated SED profiles.
In this thesis, we try to understand the AGN puzzles by using different approaches.
We contributed in understanding the emission nature of AGN with novel techniques and instruments, and our efforts help to make a step forward to reveal the whole picture.
Keywords: VLBI, radio, X-ray, γ-ray, SED, broadband, multifrequency, M 87, PKS 2052−47,
MOJAVE.
Zusammenfassung
Aktive Galaktische Kerne sind eines der Mysterien des Universums. AGN beherber- gen eine supermassives schwarzes Loch, werden von einer rotierenden Akkretionsscheibe umkreist und stossen energiereiche Jets entlang der Polachse der Akkretionsscheibe aus.
Die Jets sind zweifellos das Highlight der AGNs. Diese extragalaktischen Jets weisen
¨Uberlichtgeschwindigkeiten bis zum 60-fachen der Lichtgeschwindigkeit auf, sind sehr leuchtstark und ver¨anderlich entlang des elektromagnetischen Spektrum. Die Jets k¨onnen stark polarisiert sein, was auf die Existenz von starken Magnetfeldern schliessen l¨asst.
Aus noch nicht verstandenen Gr¨unden k¨onnen sie ein stark gekr¨ummte Struktur (Erschei- nungsbild) aufweisen. Seit Jahrzehnten studieren Astronomen AGNs mittels Beobachtun- gen vom Radio- bis zum Gammastrahlenbreich, wenden physikalische Jetmodel auf die beobachten Eigenschaften an und versuchen die einzelnen Fragmente zu einem Ganzen zusammen zusetzen. Heute verstehen wir einige Aspekte des AGN Ph¨anomens, aber ein erheblicher Teil ist noch nicht bekannt.
Das Ziel dieser Arbeit ist es, extragalaktischen Jets aus unterschiedlichen Betrach- tungsweisen zu studieren. Wir erforschen: i) einen hellen Bereich im Jet der Radiogalaxie M 87 beobachtet mit hochaufl¨osender VLBI-Technik; ii) einen Anstieg der Helligkeit
¨uber mehrere Frequenzbereiche im Blazar PKS 2052 − 47 mittels einer dirigierten multi- frequenz Beobachtungskampagne; iii) die spektrale Energieverteilung (SED) eines mittels Radiobeobachtungen ausgew¨ahlten, statistisch vollst¨andigen Stichprobe der auff¨alligsten AGN in der n¨ordlichen Hemisph¨are: die MOJAVE Durchmusterung (Beobachtung der Jets in Aktiven Galaktischen Kernen mittels VLBA Experimenten, engl. Monitoring Of Jets in Active Galactic Nuclei with VLBA Experiments).
Interferometrie mit langen Basislinien (engl. Very Long Baseline Interferometry, VLBI) ist eine leistungsf¨ahige Technologie, die entfernte AGN bis auf Parsec-Skala aufl¨osen kann, mittels der Kombination von weltweiten Radioteleskopen zu einem riesigen Teleskop mit dem Durchmesser der Erde. Mittels der VLBI-Technik konnten wir einen helle Kom- ponente, die vom Zentrum ausgestossen wurde und sich entlang des Jets bewegt, verfol- gen. In dieser Arbeit verwenden wir die VLBI-Technik um einen hellen Knoten, der sich 80 pc vom Zentrum der Radiogalaxie M 87 entfernt befindet, zu detektieren. Es wurde vermutet, dass der HST-1 Knoten der Ursprung eines TeV Flares (Ausbruches) von M 87 war. W¨ahrend der Auswertung der 15 GHz VLBI Daten zwischen 2000 und 2009 kon- nten wir HST-1 zwischen 2003 und 2007 detektieren. Obgleich wir feststellten, dass die 15 GHz VLBI Lichtkurve der kompakten HST-1 Region ihren Maximalwert in 2005 hatte, sahen wir dass die HST-1 Region sehr ausgedehnt war, eine steiles Spektrum besitzt und die projezierte scheinbare Geschwindigkeit ist nicht relativistisch. Folglich bef¨urworten unsere Ergebnisse diese Vermutung nicht vollst¨andig.
Das Studium von Helligkeitsausbr¨uchen in unterschiedlichen Frequenzbereichen ist
Zusammenfassung
eine der besten Methoden um versichiedenen, in AGN stattfindenden Vorg¨ange, zu un- terscheiden. Die gegenw¨artigen Jetmodelle legen nahe, dass die Zeitverz¨ogerungen zwis- chen den Ausbr¨uchen unterschiedlicher Frequenz unterschiedliche Merkmale haben, w¨ahrend sich die Strahlungsprozesse ¨andern. In der vorliegenden Arbeit untersuchen wir den Radioquasar PKS 2052 − 47, der ein flaches Spektrum aufweist und in welchem sich an einem Helligkeitsausbruch im optischen im Juli 2005 ein Ausbruch im Gammastrahlen- bereich anreihte. Wir leiteten eine multi-frequenz Beobachtungskampagne vom Radio- bis zum Gammastrahlenbereich nach dem Ausbruch des Blazars ein. Innerhalb der Kam- pagne wurden VLBI Beobachtungen mit dem TANAMI (Tracking Active Galactic Nuclei with Austral Milliarcsecond Interferometry) Programm verwendet um, falls vorhanden
¨Anderungen im Jeterscheinungsbild zu verfolgen, die Radioflussdichte im Millimeter- bereich wurde vom APEX (Atacama Pathfinder EXperiment) gemessen, die Beobachtun- gen R¨ontgenstrahlenbereich wurden vom Swift UV/Optical Teleskop (UVOT) und vom X-ray Teleskop (XRT) und die Gammastrahlenbeobachtung vom Fermi Large Area Tele- scope (LAT) durchgef¨uhrt. Wir sehen keine wesentlichen ¨Anderungen im Photonenindex und Flussdichte der R¨ontgenstrahlen w¨ahrend der 5-Tage Beobachtung mit Swift.
Die spektrale Energieverteilung spiegelt die Strahlungseigenschaften der AGN wieder und zeigt den Energieausstoss in unterschiedlichen Wellenl¨angenbereichen. Durch die Simulation von physikalischen Jetmodellen und der Rekonstruktion der SED kann man die Strahlungsprozesse, die Jetzusammensetzung, das Magnetfeld, Flussgeschwindigkeit im Jet und die Struktur des Jets untersuchen. In der vorliegenden Arbeit untersuchen wir die SED vom Radio bis zum Gammastrahlenbereich eines mittels Radiobeobachtungen ausgew¨ahlten Ensemble. Das MOJAVE Programm beobachtet seit 15 Jahren eine statis- tisch vollst¨andige Auswahl von 135 radiolauten AGN bei 15 GHz mittels dem Very Long Baseline Array (VLBA). Die MOJAVE Auswahl besteht zum gr¨ossten Teil aus Blazaren, AGN deren Jet zum Beobachter zeigt. Die typische SED eines Blazars besitzt zwei H¨ocker. Man nimmt an, das der niederenergetische H¨ocker durch Synchrotronstrahlung des AGN Jets und hochenergetische durch inverse Comptonstreuung der Keimphotonen des Jets oder externer Quellen erzeugt wird. Wir erstellten einen SED Katalog des MO- JAVE Ensembles und passten Polynome, als erste N¨aherung an den nieder- und hoch- energetischen Buckel der SED an, um die Eigenschaften der Quellen zu verstehen. Die Position des Scheitelpunkts der beiden H¨ugel kann f¨ur viele Quellen des MOJAVE Pro- gramms aus den Polynomanpassungen abgeleitet werden, ausser f¨ur einige Quellen die ein abweichendes Profil aufweisen.
In dieser Arbeit versuchen wir das AGN Puzzle zu verstehen indem wir unterschiedliche
Ans¨atze verwenden. Zum Verst¨andnis der Strahlungsmechanismen in AGN mit neuarti-
gen Techniken und Instrumenten trugen wir bei und unser Anstrengungen helfen eine
Schritt in Richtung der Enth¨ullung des ganzen Bildes zu machen.
1 Introduction
Active galactic nuclei (AGN) are the most energetic objects in the Universe. AGN domi- nate the high-energy sky in the extragalactic regime, and since its first discovery (Seyfert 1943), different types of AGN are observed with various behaviors (see Section 1.1.1).
After decades of study, we believe that we are able to unify the AGN phenomenon in a common scheme (see Section 1.1.2). A super-massive black hole (SMBH) located in the center of an AGN is fueling the whole system with matter accreting around the central engine. Strong magnetic fields are dragged along by the rotating accretion disk, adopting a cone-shaped morphology with a warped structure (see Figure 1.1). An energetic plasma jet is launched in the vicinity of the SMBH following the magnetic field lines along the pole direction of the accretion disk. There is an enormous amount of energy released from AGN and observed by us across the whole electromagnetic spectrum from the radio to the TeV band.
To find out the exact mechanisms at work in AGN systems is one of the main ef- forts for astronomers. After decades of effort, we have a better understanding in different branches of AGN research (accretion disk, jet, broad/narrow line region, etc.) from var- ious studies at different wavelengths. However, most of the major problems still remain open: How is the jet launched from the central engine? What is its composition? Where does the very-high-energy (VHE) emission come from? How does emission of different wavebands relate to each other? Why are there emitting components from the central engine transmitting outwards? How do they work?
Right now, it is probably the best time to have a chance to peek at the mystery of AGN. Current astronomical facilities span from radio to TeV bands, providing the best wavelength coverage ever. Also, much improved networking connects teams of different wavelengths to collaborate and react to a single activity of a given AGN, enables us to dig deeper to different states of the object.
In this chapter, I will give a brief overview of the AGN picture. In Section 1.1, I
will describe AGN classes and the unified scheme. In Section 1.2, I will introduce the
emission mechanisms involved in AGN. I especially discuss about the X-ray emission
processes in Section 1.2.4. In Section 1.4.1, I summarize current understandings of the
location of AGN emission at different wavelength. In Section 1.3, I will introduce the
very long baseline interferometry (VLBI) technique, which is an important tool to study
AGN outflows. Finally, I attach a table of current major astronomical facilities at different
wavelengths that are contributing to AGN studies in Section 1.4.4.
1 Introduction
Figure 1.1: Artistic illustration of an AGN system. White curves represent magnetic field lines warped in a cone shape. In the center of the galaxy, there is a super massive black hole (image credit: NASA and Ann Field, Space Telescope Science Institute).
1.1 AGN Classification and the Unified Model
1.1.1 AGN Class
AGN are categorized into various classes based on the properties as observed in different wavebands. Figure 1.2 illustrates the relations between different types of AGN based on the characteristics of radio emission, nuclear luminosity, and optical line properties. Here I briefly introduce the AGN classification, for more details about this topic, please see Krolik (1999).
Quasar When quasars were discovered (Hazard et al. 1963), the term “quasi-stellar
object” was used to refer to these strange objects which appeared to be stellar-like but were
indeed very distant and luminous, as it was seen from their strongly redshifted optical
spectra. Quasars have strong optical and X-ray continuum emission, as well as broad
1.1 AGN Classification and the Unified Model
Figure 1.2: Relations between different types of AGN (Image credit: C. Tadhunter). For abbreviations: BLRG - broad line radio galaxies, RLQ - radio loud quasars, OVV - opti- cally violent variable quasar, WLRG - weak emission-line radio galaxy, narrow emission- line radio galaxy, RQQ - radio quiet quasars, NLXG - narrow line X-ray galaxy, FIR galaxy - far infrared radio galaxy, BL - broad line, NL - narrow line.
whole electromagnetic spectrum. Quasars with a strong nuclear and jet radio emission are categorized as radio-loud quasars, otherwise they belong to radio-quiet quasars. Radio- loud quasars showing strong optical variability are called optically violent variable (OVV) quasars; quasars with flat radio spectrum and strong broad emission lines are called flat- spectrum radio quasars (FSRQ).
BL Lac Object BL Lac objects are categorized by their rapid and large amplitude flux variability and significant optical polarization. As for the spectral properties, they have a featureless non-thermal continuum. Very often we use the term blazars
1to refer to BL Lac objects and FSRQ. Blazars have high radio brightness and flat radio spectra; in the optical band, they have high optical polarization, as well as strong optical variability.
Padovani and Giommi (1995) divide BL Lac objects into three categories by the peak frequency of the synchrotron bump (ν
s) in their spectral energy distribution (SED; see Section 1.4.2): sources with ν
s< 10
14.5Hz are low energy peaked BL Lac objects (LBL), those with 10
14.5< ν
s< 10
16.5Hz are intermediate BL Lac objects (IBL), and those with ν
s< 10
16.5Hz are classified as high energy peaked BL Lac objects (HBL).
Radio Galaxy This type of AGN shows strong radio emission in the core and extended jet, and sometimes they display narrow and broad emission lines. Fanaroff and Riley (1974) discovered that there is a transition of radio luminosity occurring at P
178 MHz≈
1The term blazar (blazing quasi-stellar object) was firstly used by Edward Spiegel in 1978 to refer to
OVV quasars and BL Lac objects.
1 Introduction
10
25W Hz
−1sr
−1, and they divided radio sources into two classes, which were later called Fanaroff and Riley Class I (FRI) and Class II (FRII). FRIs have smooth jets emanating from the nucleus and lobes, where the surface brightness decreases toward the edges.
FRIIs are more powerful radio galaxies having faint jets and edge-brightened lobes. There are two approaches of models that explains the FRI/FRII transition. The morphological difference can be explained by deceleration of jets caused by the environment, and the dichotomy of transition can be modeled by differences in fundamental parameters such as black hole spin, accretion mode, and jet composition (see Gopal-Krishna and Wiita 2000 for a summary).
Seyfert galaxies This class of AGN was identified by Seyfert (1943). They have lu- minous nuclei and bright emission lines. The Seyfert galaxies are divided into Type 1 and Type 2 based on their spectroscopic properties at the optical band. Type 1 Seyfert galaxies show both narrow and broad emission lines, and Type 2 show only narrow lines.
The spectral line emission from the Seyfert galaxies is produced from highly ionized gas, which contains hydrogen, helium, nitrogen, and oxygen, and the emission lines display Doppler broadening. The Seyfert galaxies are quite luminous across the broadband spec- trum, and only ∼5% of Seyfert galaxies are found to be radio-loud. As indicated in Figure 1.3, the Seyfert galaxies are mostly radio quiet quasars, which are seen edge-on. For this reason, they are ideal objects for us to study the dusty torus, the accretion disk, and the broad line region.
1.1.2 The Unified Model
It is widely accepted that the discrepant properties we observed in AGN are caused by orientation effects (Antonucci 1993, Urry and Padovani 1995). Figure 1.3 illustrates the unified scheme of AGN. The SMBH is located in the center and is surrounded by an accretion disk, further out there is a donut-shape, dusty torus. Close to the SMBH, there is a broad line region, which is a very compact region o gas where broad emission lines are formed (Popovic 2006, Osterbrock 1989). Farther away from the central engine, there is an extended region of interstellar gas ionized and heated by the AGN (Groves 2007), which is denoted as the narrow line region. A relativistic jet is launched from the vicinity of the SMBH and travels in the space passing through those regions mentioned previously and interact with each other.
Based on this model, if an AGN is seen edge-on, the broad line region is blocked by
the dusty torus along the line-of-sight, and only the narrow line region can be seen from
the observer, thus it would appear to be a narrow line radio galaxy (radio-loud) or a Type 2
Seyfert galaxy (radio-quiet). When an observer sees an AGN with an angle between edge-
on and pole-on, the broad line region starts to become visible along the line of sight, and
this is the case for broad-line radio galaxies (radio-loud) and Type 1 Seyfert galaxies
(radio-quiet). If an AGN is seen pole-on, the source would appear to be highly variable
and luminous, because the jet is emitting towards us, this is the case of blazars (radio-
loud) and radio-quiet quasars. The unified scheme is supported by many observational
evidences (Antonucci and Miller 1985, Miller and Goodrich 1990, Kl¨ockner et al. 2003,
1.2 Radiation Processes
Figure 1.3: The unified model of AGN (Urry and Padovani 1995). The green arrows illustrate the viewing angles responsible for different categories of AGN. The upper part shows the unification for radio-loud sources, whereas the lower part describes the radio- quiet ones.
1.2 Radiation Processes
1.2.1 Thermal Emission
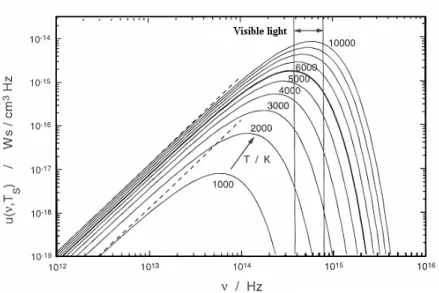
Thermal emission is the black-body emission. A system emits blackbody radiation when it reaches thermal equilibrium, and its emission can be described by the Planck law:
B
ν(T ) = 2hν
3c
21 e
kThν− 1 ,
where B
ν(T) is the intensity function, k is the Boltzmann’s constant, h is the Planck
constant, T is the temperature of the system, ν is the frequency of emission, and c denotes
the speed of light. A very good example in astronomical schemes of thermal emission is
1 Introduction
Figure 1.4: Planck radiation (image credit: H. F¨oll). As the equilibrium temperature gets higher, the peak of the emission intensity shifts to higher frequency.
the cosmic microwave background radiation (Penzias and Wilson 1965), which shows a black body spectrum of 2.725 K. Also, the optical emission of stars are dominated by the black body radiation, and non-thermal spectral lines are observed as well.
1.2.2 Synchrotron Emission
The dominant mechanism for radio emission in blazars is the synchrotron radiation. When charged particles move in a region with a magnetic field, they encounter a Lorentz force that leads them travel along a curved path. The observed spectrum is clearly diverges from Planck’s spectrum, and therefore is called “non-thermal”. In AGN systems, charged particles moving in the relativistic jets are the main source of synchrotron radiation.
When a charged particle moves in a magnetic field, it experiences a Lorentz force F
L= q (E + β × B),
where β = v/c is the velocity of the moving particle in units of the speed of light, q denotes the charge of the particle, and E and B are the electric and magnetic fields. For the case that the magnetic field dominates, and the magnetic field has only one direction, it results in a helical motion of the charged particle with the frequency
ω
L= qB γmc , where ω
Lis the Larmor frequency, γ = 1/ �
1 − β
2, and m is the mass of the particle. It can be shown that the synchrotron spectrum of a single electron can be described as:
P
ν= 4
3 sinθγ
2σ
Tc ν
cB
28π F
s� ν ν
c� ,
where is the angle between the direction of the charged particle and the magnetic field
1.2 Radiation Processes
Figure 1.5: Relativistic beaming transforms the dipole pattern of Larmor radiation (dotted curve) into a narrow beam in the observer’s frame. The solid curve illustrates the effect when γ = 5 (image credit: NRAO).
ν
c= 3
2 γ
2sinθ eB 2π m
ec , and σ
Tis the Thomson cross section (Billings 1966):
σ
T≡ 8π 3
� e
2m
ec
2�
≈ 6.65 × 10
−25cm
2.
When a charged particle moves with a relativistic speed, the emission is beamed sharply in the direction of motion as v approaches c. It can be shown that:
sinθ = sinθ
�γ(1 + βcosθ
�) ,
where θ denotes the viewing angle of the observer’s frame, and θ
�denotes the local frame of the moving electron. The Doppler factor is defined by
δ = 1
γ(1 − β
�cosθ) ,
where β
�is the longitudinal velocity component relative to the observer. The observed flux density S
νthen has a relation with the flux density in the co-moving frame S
ν�:
S
ν= δ
3S
ν�.
This is called the relativistic Doppler effect. Figure 1.5 illustrates the relativistic beaming effect.
In general, what we observe from astronomical sources is the synchrotron radiation emitted by a group of charged particles. Assuming a group of electrons with power law energy distribution
N (E)dE = KE
−adE,
where N (E)dE is the number of electrons per unit volume in the range of E and E+dE, and a is a parameter describing the distribution. Approximately each electron radiates the power of
P = − dE dt = 4
3 σ
Tβ
2γ
2cU
B,
where U
Bis the magnetic field density. It can be shown that
1 Introduction
Figure 1.6: A photon of wavelength λ incidents and collide with a particle, producing a photon of wavelength λ
�. Compton scattering: λ > λ
�; inverse-Compton scattering:
λ < λ
�(image credit: J. Wok).
S ∝ ν
+α, where α =
1−2adenotes the spectral index.
1.2.3 Inverse Compton Scattering
Compton scattering is important in astronomical processes. Seed photons with wave- length λ interact with electrons, and photons with wavelength λ
�are produced (see Figure 1.6). If λ
�> λ, photons are scattered to higher energy, this is so-called inverse Compton (IC) scattering. IC scattering is believed to be a major mechanism taken place in relativis- tic flows. High-energy emission of AGN are non-thermal, and IC is a major mechanism to generate X-ray, γ-ray, and TeV photons.
For a single electron, the Poynting flux of a plane wave incident on the electron is S = c
4π | E |
2, and the scattered radiation of the electron has a power of
P = | S | σ
T= σ
TcU
rad,
where U
rad= |S| /c, the energy density of the incident wave. Now if we consider scatter- ing by a relativistic electron, the equation in the local frame of the electron is
P
�= σ
TcU
rad.
It can be shown that the total power in the radiation field after IC scattering is P = 4
3 σ
TcU
rad(γ
2− 1
4 ),
thus the net power added due to IC scattering is
1.2 Radiation Processes The power of synchrotron field is
P
sync= 4
3 σ
Tcβ
2γ
2U
B. The relation of the power of IC and synchrotron is
P
ICP
sync= U
radU
B.
Therefore, the power of IC scattering depends only on the photon field of the synchrotron region U
rad, and the magnetic field energy density U
B. It can be shown that, when β → 1, the maximum frequency of the IC scattering radiation is
ν
ν
0≈ 4γ
2.
According to different sources of seed photons, there are several typical processes at work in AGN systems. Synchrotron self-Compton (SSC) emission refers to that syn- chrotron photons are up-scattered by the group of relativistic electrons which produce them. Usually this happens in relativistic jets, where strong synchrotron radiation is ob- served, and relativistic electrons move along jets. In the case of SSC, the IC mechanism cools relativistic electrons efficiently when the brightness temperature exceeds 10
12K, which is the upper-limit indicator of the SSC mechanism. Readhead (1994) derived a lower-limit of brightness temperature T
b∼ 10
11using the equipartition method. In the case of external radiation Compton (ERC), seed photons can come from various sources, such as a molecular torus, an accretion disk, and emission-line clouds.
Figure 1.7: X-ray spectrum of a type-1 AGN (M¨uller and Camenzind 2004).
1 Introduction
Figure 1.8: Different schemes of coronal distribution in the nucleus region of AGN. The red path represents the trajectory of seed photons from blackbody accretion disk, and the blue path represents the IC photons which are observed in X-ray spectra. (Image source:
http://www.wissenschaft-online.de/astrowissen/lexdt k05.html)
1.2.4 X-ray Emission of AGN
The observed X-ray properties of AGN are different based on their viewing angles. For radio-quiet AGN, we can see the X-ray emission coming from the accretion disk and the dusty torus. For radio-loud AGN, the IC up-scattered X-ray emission from relativistic jets dominates the spectrum. In the following paragraphs, I will discuss about the X-ray emission mechanisms observed in AGN.
Radio-quiet AGN
Figure 1.7 illustrates the X-ray spectrum of a radio-quiet AGN (M¨uller and Camenzind
2004), in which one peers directly into the central region of the AGN nucleus. As shown,
the spectrum is dominated by a continuum emission produced by the IC process. Below
1 keV, there is a soft excess emission. Around 1 keV, there is an absorption dip originated
from warm absorbers surrounding the black hole. We see the reflection component from
the accretion disk at higher energy. The origin of the power-law profile of the spectrum
is believed to be the IC of seed photons from blackbody accretion disk by hot electrons
(in corona, temperature ∼ 200 keV) above the surface of the accretion disk. Figure 1.8
illustrates different models of this scheme. The corona could be distributed above the
accretion disk (sandwich) or around the black hole (sphere+disk); it can be torus-like
next to the black hole (torus+disk), or spread unevenly above the black hole (patchy); its
morphology can appear as clumps above the black hole (lamp-post). Usually one sees
those features of X-ray spectra in objects like Seyfert 1 galaxies, broadline radio galaxies,
and type-1 quasars. The X-ray studies of radio-quiet AGN can probe the structure in the
1.3 Very Long Baseline Interferometry Radio-loud AGN
Unlike radio-quiet AGN, the X-ray emission in radio-loud AGN is dominated by syn- chrotron/IC processes from relativistic jets, especially for blazars. If an AGN is highly energetic, the X-ray emission can be generated from solely the synchrotron process in relativistic outflows (e.g., HBLs). The X-ray emission can also be generated by SSC or ERC mechanisms (see Section 1.2.3), depending on the surrounding environment of jets (see Section 1.4.2 for further discussions).
1.3 Very Long Baseline Interferometry
Very long baseline interferometry (VLBI) is one of the best techniques for studying extra- galactic jets. With its parsec-scale resolution at cosmological distances, VLBI enables us to trace the ejection of bright features from the jet base. In this section, I will give a brief summary of the VLBI technique. For detailed information about radio interferometry and VLBI, please see Thompson (1999).
1.3.1 Fundamentals of Radio Interferometry
The resolving power of a telescope r is determined by the wavelength of incoming elec- tromagnetic wave and the diameter of the telescope r ∝ λ/D. The idea of VLBI is based on the principle of the Michelson interferometer, that is, to use two or multiple telescopes to observe a source, correlate the data collected by each telescope, and reconstruct the image of the source region by Fourier deconvolution. Figure 1.9 shows the principle of a double-slit interference and the VLBI technique. We learn from the Young’s double slit experiment that the wavefront passing through the two slits generates Huygens waves that produce interference fringes. When the path difference is an integer number of the wavelength, we see constructive interference. By analogy, VLBI works with the same principle. As seen in Figure 1.9, the two radio telescopes work as two slits, and if we imagine the sky as the screen in the double slit experiment, regions which would cause constructive and destructive interference can be considered as stripes in the sky. If the source is bigger than the smallest spacing of the stripes, the source is unresolved, other- wise it is resolved. This can be seen as a contrast of the fringes, or “visibility”. The larger the distance between two telescopes, the higher resolution the interferometer has.
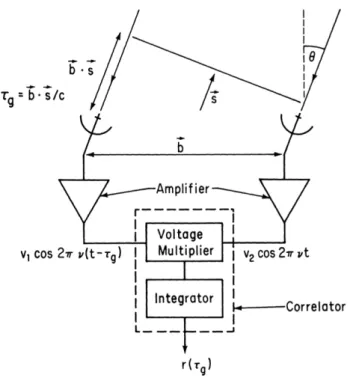
The incoming wavefront from the source is collected by radio antennas, and the sig- nals are transmitted through waveguides to the amplifier. The signals are then amplified and the intensities are detected by the receiver, producing voltage signals V
1(t) and V
2(t) at the backend of two antennas. The voltage signal is sent to a correlator for data corre- lation (see Figure 1.10). Before obtaining the voltage signal, one needs to correct for the geometrical delay τ
g, which is caused by the arrival time difference of the wavefront due to the geometric distribution of the two telescopes:
τ
g= b · s c ,
where b is the baseline vector, s is the unit vector towards the source, and c is the speed
of light. Note that τ
gchanges slightly with time as the Earth rotates. When the corrected
1 Introduction
Figure 1.9: Analogy of double-slit interferometer and VLBI technique. The left panel shows the Young’s double slit experiment, and the right panel is the global VLBI illus- tration. Image credit: left – M. J. Parry-Hill and M. W. Davidson; right – taken from
http://www.haystack.mit.edu/tech/vlbi/evlbi/index.html.
voltage signal enters the correlator, where the signals are combined, it has a form like this V
1= v
1cos2πν(t − τ
g)
V
2= v
2cos2πν (t).
The output of the correlator is
r(τ
g) = � V
1(t)V
2(t) � = v
1v
2cos2πντ
g.
The correlator output is an oscillating signal representing the motion of the source through the interferometer fringe pattern on the sky. Next, we want to express the output by the integrated brightness over the sky. We use I(s) to denote the brightness in the direction s at frequency ν. The power of the signal from a small area of the source dΩ received in bandwidth � ν can be expressed as A(s)I(s) � νdΩ, where A(s) represents the sampling function of the antenna in the direction of s. Combining those, one could express the correlator output as
dr = A(s)I(s) � νcos2πντ
gdΩ, which leads to
r = � ν
�
S
A(s)I (s)cos
� 2πν b · s c
� dΩ
for an extended source. Note that this relation is only valid when the source locates in the far field, from where the signal becomes a plane wave when it reaches the Earth.
If a source is extended and resolved, the contributed incoming signal would be from a
composition of slightly different directions, instead of one direction s. To represent this
scenario, we choose a direction towards the source as phase center s , and we define s =
1.3 Very Long Baseline Interferometry
Figure 1.10: A simplified diagram of a two-antenna interferometer, image taken from Thompson (1999).
r = � νcos
� 2πν b · s
0c
� �
S
A(σ)I(σ)cos
� 2πν b · σ c
� dΩ
−� νsin
� 2πνb · s
0c
� �
S
A(σ)I (σ)sin
� 2πν b · σ c
� dΩ.
Next, we introduce the term visibility V : V = | V | e
iφV=
�
S
A
n(σ)I(σ)e
−2πνb·c σ,
where A
nis the normalized antenna reception pattern. As shown, visibility is a function of the source structure, the baseline length and the orientation of the interferometer. Each observation with two telescopes at a given time in an array measures one value of the visibility. Combining all measured visibilities, we could know the source brightness and reconstruct its structure. To express the exponential function of the visibility as a complex term:
e
−i(
2πνb·c σ) = cos � 2πνb · σ c
�
− i sin
� 2πν b · σ c
� . If we separate the real and imaginary parts of visibility, we obtain
A
0| V | cosφ
V=
�
S
A(σ)I(σ)cos
� 2πνb · σ c
� dΩ
A
0| V | sinφ
V= −
�
S
A(σ)I(σ)sin
� 2πνb · σ c
�
dΩ.
1 Introduction
Substituting these equations into previous one, we get r = A
0� ν | V | cos
� 2πνb · s
0c − φ
V� .
As shown, one can obtain the amplitude and phase of the visibility after data calibration.
Once this is known, we apply synthesis imaging method to reconstruct the sky brightness of the source region (see Briggs et al. 1999).
1.3.2 Synthesis Imaging
To reconstruct the image of the source region, we need to measure | V | and φ
Vwith dif- ferent baselines. We express the distribution of baseline coverage in terms of a two- dimensional (u, v) plane, which has a east-west/north-south coordinate. The measured visibility is a function of u and v, because different positions on the (u, v) plane measures different part of the sources with different orientations. To obtain a good image, the sam- pling of the (u, v) plane has to be frequent enough to be able to perform Fourier transform between the visibility plane V (u, v) and the image plane I(l, m) taking into account the primary beam pattern A(l, m), where l and m denotes the coordinates of the observed projected sky. The relation of the visibility plane and the sky plane can be expressed as:
A(l, m)I(l, m) =
��
∞−∞
V (u, v) e
2πi(ul+vm)du dv,
which is a two-dimensional Fourier transform. Using Fourier deconvolution methods, one could produce maps of sky brightness.
1.4 The Study of Blazars
In this section, we will introduce the emission properties and parsec-scale jet study of blazars, as well as the current astronomy facilities that are often used in AGN research.
1.4.1 The Emission of Blazars
So far we have introduced the unified model and emission mechanisms involved in AGN.
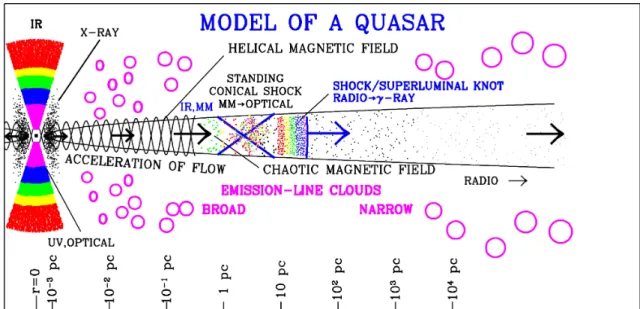
To relate observational properties and the actual structures of AGN, I will discuss the emitting regions at different bands in this section. Based on current knowledge, we can illustrate the structure of AGN and the emitting regions at different wavebands in Figure 1.11, which shows the scales of structures like SMBH, accretion disk, dusty torus, rel- ativistic jet (confined by a helical magnetic field), as well as the broad and narrow line regions.
Radio Radio emission mainly generates from the relativistic outflows originated nearby
the SMBH. Hot plasma flows along the jet, in which charged particle interacts with mag-
netic field and produce synchrotron radiation. Typically, the scale of radio jets in AGN
are observed at scales from pc to kpc. Usually we see one-sided radio jets due to Doppler
1.4 The Study of Blazars
Figure 1.11: Illustration of the structure of AGN and the locations correspond to different bands of emission (Image credit: A. Marscher).
observations (see Section 1.3), even superluminal knots along radio jets with apparent speed up to 50 c are detected (Lister et al. 2009b).
Infrared In radio-loud AGN, such as blazars, infrared emission is mainly dominated by non-thermal synchrotron process. For radio-quiet AGN, the emission from the near- infrared through sub-millimeter bands correspond to thermal dust emission close to the nucleus region (Sanders 1999).
Optical and Ultra Violet The jet synchrotron process extends to the optical and UV bands. The accretion disk surrounding the nucleus is also expected to peak at the UV- optical band, and this corresponds to thermal emission. Optical and UV thermal photons from accretion disk might serve as seed photons and be upscattered to higher-energy photons, such as X-rays (see Section 1.2.4)
X-rays In blazars, X-rays can be generated in shocks and superluminal knots in jets by the IC process. As mentioned in previous paragraph, X-ray photons can be produced by ERC process, in which the seed photons are from the accretion disk and upscattered by obscuring torus in surrounding environment.
γ-rays through TeV Due to the resolution limitation in very-high-energy (VHE) obser-
vatories, it is not possible to locate γ-ray and TeV emission in AGN. In current theoretical
models, it is believed that VHE photons can be generated from shocks in relativistic jets
(Dermer and Schlickeiser 1993, 1994), and one of the mechanisms is through synchrotron
process (leptonic). Other possible scenarios include proton-proton process (hadronic),
and leptonic-hadronic, etc.
1 Introduction
Figure 1.12: The broadband SED of the broad-line FRII radio galaxy 3C 111 (see Chapter 4; Chang et al. in preparation). At the bottom of the figure, red bars mark the range of different band of emission in Hz.
1.4.2 The Spectral Energy Distribution of Blazars
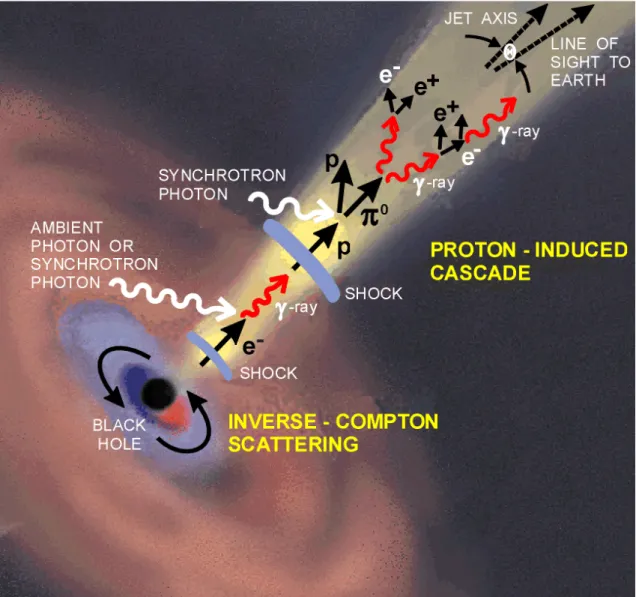
Typically, the broadband SED of blazars have a double-hump profile spanning from radio to VHE band (e.g., Dermer and Schlickeiser 1993), as shown in Figure 1.12. The double- peak shape of blazar broadband SED can be explained by current models of non-thermal emission. As illustrated in Figure 1.13, the lower energy hump can be modeled by syn- chrotron emission from blazar jets, and depending on the energy output of the jet, the emission could cover from radio to UV/X-rays. As for the higher energy hump, there are several possible mechanisms which can generate high energy photons: SSC (Jones et al.
1974, Ghisellini and Maraschi 1989), ERC (Sikora et al. 1994, Dermer and Schlickeiser 2002). In the SSC scheme, IC seed photons are produced locally as the same group of syn- chrotron photons in blazar jets. In the ERC scheme, seed photons can come from several sources such as a molecular torus (Bła˙zejowski et al. 2000), an accretion disk (Dermer and Schlickeiser 1993), and emission-line clouds (Sikora et al. 1994). Moreover, the seed photons produced by local synchrotron emission may be scattered by nearby clouds sur- rounding the jet and enter the IC region again (mirror Compton; Ghisellini and Madau 1996).
The physical processes involved in the SED study are complex, and the fact that we cannot distinguish different emission regions from a target source makes broadband SED modeling challenging. For example, the SED study of 48 Fermi bright blazars (Abdo et al.
2010a) shows that a homogeneous one-zone model with SSC mechanism cannot explain
most of their results, and more complex models involving external Compton radiation or
multiple SSC components are needed to model the blazar SEDs. One of the main prob-
lems of modeling broadband SED is to reproduce the radio emission. Current available
1.4 The Study of Blazars
Figure 1.13: Artistic illustration of the emission mechanisms in AGN jet (image source:
http://www.mpifr-bonn.mpg.de/bonn04/).
sion from the radio jet in AGN is usually underestimated (e.g., Finke and Dermer 2010, and Abdo et al. 2010d). The radio emission is believed to be generated via synchrotron process in the extended jet region, yet in the SED models, the high energy emission is reconstructed from a rather compact region, which cannot reproduce the radio emission well.
1.4.3 Parsec-scale Jets: Intrinsic and Observed Properties
In AGN studies, it is important to be aware of what are the intrinsic parameters of AGN
and what are the observed ones. The main indicators of jet flow are the intrinsic Lorentz
factor (γ = (1 − β
2)
1/2, where β is the speed of relativistic flow in the unit of c), the
intrinsic luminosity L
0, and the intrinsic brightness temperature T
0. However, in real life
we can only observe the apparent jet speeds β
app, luminosities L
app, and brightness tem-
peratures T
appwhich are dependent on parameters like the Doppler factor δ, the Lorentz
1 Introduction
factor γ, and the jet viewing angle θ w.r.t observer. β
app, L
app, T
appand δ can be derived from γ, θ, and L
0. Here I list the relations between the parameters:
β
app= βsinθ 1 − βcosθ , L
app= L
0δ
n, δ = γ
−1(1 − βcosθ)
−1,
T
app= δ T
0, γ = (1 − β
2)
−1/2,
where n depends on the geometry and spectral index. Typically, mathematical n needed is in the range between 2 and 3, depending on the geometry and spectral index of jet. Very often the apparent speeds of AGN jet β
appcan appear to be superluminal, which is due to the illusion caused by viewing effect (Rees 1966). Currently, the observed apparent projected speeds of AGN can be up to ∼ 60 c (e.g., Lister et al. 2009b).
1.4.4 The AGN Study in This Thesis
In the following Chapters, we will present our studies of AGN with different approaches.
In Chapter 2, we study a bright feature in the powerful jet of the radio galaxy M 87 with
the VBI technique. In Chapter 3, we study a multiband flare of the Southern blazar
PKS 2052−47 by performing multiwavelength observations. In Chapter 4, we study the
emission properties of a statistically-complete radio-selected blazar sample by construct-
ing a broadband SED catalog of the 135 sources. The study of AGN in this thesis covers
the whole electromagnetic spectrum, and we used ground base telescopes, radio interfer-
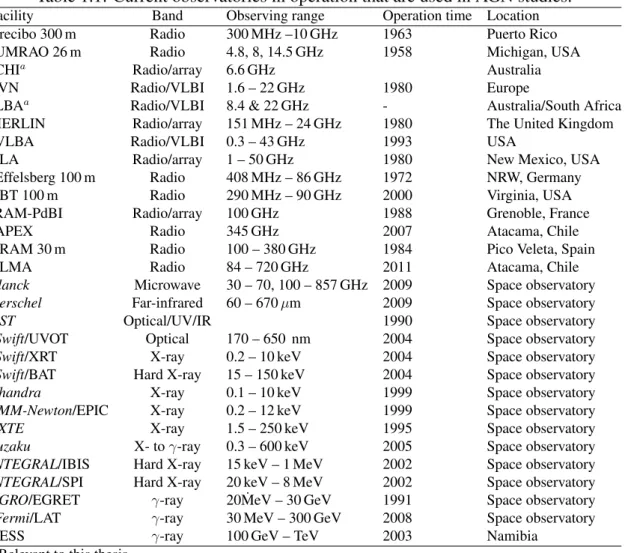
ometric arrays, as well as space observatories to perform our study. Table 1.1 lists current
astronomical facilities that are in operation which are often used in AGN studies, and we
marked the facilities that were used to perform the study in this thesis. We hope our efforts
will push us a step forward in understanding the physical mechanisms of AGN jets.
1.4 The Study of Blazars
Table 1.1: Current observatories in operation that are used in AGN studies.
Facility Band Observing range Operation time Location
Arecibo 300 m Radio 300 MHz –10 GHz 1963 Puerto Rico
∗UMRAO 26 m Radio 4.8, 8, 14.5 GHz 1958 Michigan, USA
∗CHIa Radio/array 6.6 GHz Australia
EVN Radio/VLBI 1.6 – 22 GHz 1980 Europe
∗LBAa Radio/VLBI 8.4 & 22 GHz - Australia/South Africa
MERLIN Radio/array 151 MHz – 24 GHz 1980 The United Kingdom
∗VLBA Radio/VLBI 0.3 – 43 GHz 1993 USA
VLA Radio/array 1 – 50 GHz 1980 New Mexico, USA
∗Effelsberg 100 m Radio 408 MHz – 86 GHz 1972 NRW, Germany
GBT 100 m Radio 290 MHz – 90 GHz 2000 Virginia, USA
IRAM-PdBI Radio/array 100 GHz 1988 Grenoble, France
∗APEX Radio 345 GHz 2007 Atacama, Chile
∗IRAM 30 m Radio 100 – 380 GHz 1984 Pico Veleta, Spain
ALMA Radio 84 – 720 GHz 2011 Atacama, Chile
Planck Microwave 30 – 70, 100 – 857 GHz 2009 Space observatory
Herschel Far-infrared 60 – 670µm 2009 Space observatory
HST Optical/UV/IR 1990 Space observatory
∗Swift/UVOT Optical 170 – 650 nm 2004 Space observatory
∗Swift/XRT X-ray 0.2 – 10 keV 2004 Space observatory
∗Swift/BAT Hard X-ray 15 – 150 keV 2004 Space observatory
Chandra X-ray 0.1 – 10 keV 1999 Space observatory
XMM-Newton/EPIC X-ray 0.2 – 12 keV 1999 Space observatory
RXTE X-ray 1.5 – 250 keV 1995 Space observatory
Suzaku X- toγ-ray 0.3 – 600 keV 2005 Space observatory
INTEGRAL/IBIS Hard X-ray 15 keV – 1 MeV 2002 Space observatory
INTEGRAL/SPI Hard X-ray 20 keV – 8 MeV 2002 Space observatory
CGRO/EGRET γ-ray 20 ˙MeV – 30 GeV 1991 Space observatory
∗Fermi/LAT γ-ray 30 MeV – 300 GeV 2008 Space observatory
HESS γ-ray 100 GeV – TeV 2003 Namibia
∗Relevant to this thesis.
aThe TANAMI project; see Section 3.2.
2 A multi-band flare of the HST-1 feature in the M 87 jet
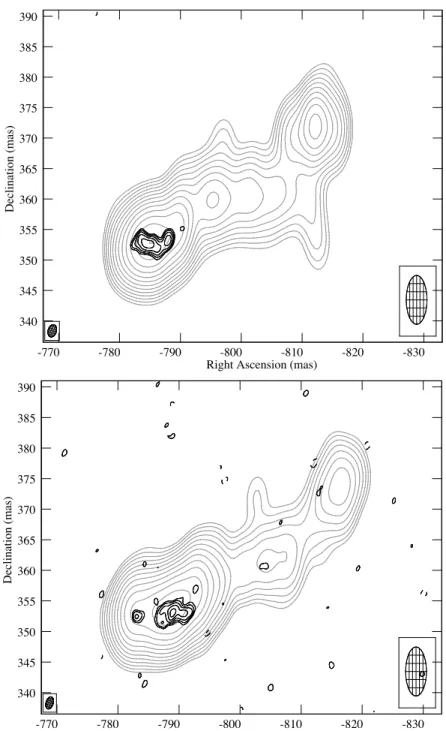
As mentioned in the previous chapter, the VLBI technique allows us to trace motions in AGN outflows with very high resolution. Thus, it becomes a powerful tool that can be used for probing outburst events in parsec scale jets of AGN. In this chapter, we use the VLBI wide-field imaging technique to investigate a bright flaring feature HST-1 in the jet of the radio galaxy M 87. This multi-band flare in 2005 caught the attention of the community mainly for its possible relation with a TeV flare from M 87 observed around the same time. By applying wide-field imaging to the VLBA 2 cm Survey/MOJAVE data from 2000 to 2009, we imaged the HST-1 region with the highest resolution ever obtained. We examined the VLBI properties of HST-1, and compared with other bands.
This chapter describes the details of this work, which has been published in A&A 515, 328 (2010).
2.1 Introduction
One of the most studied AGN is M 87 (also known as Virgo A), a nearby elliptical galaxy located in the Virgo cluster. It hosts a very powerful one-sided jet emerging from the central region, and was also the first extragalactic jet to be discovered (Curtis 1918). The synchrotron-emitting nature of the M 87 jet was suggested by Baade (1956). Observations show that M 87 contains 2.4 × 10
9M
⊙within a 0.25
��radius (Sargent et al. 1978, Young et al. 1978), which suggests the presence of a SMBH in its nucleus (Harms et al. 1994).
Due to its proximity (16.4 Mpc, z=0.00436, 1 mas = 0.08 pc, 1 mas yr
−1= 0.26 c, Jord´an et al. 2005), M 87 is an ideal candidate for studying AGN phenomena, and has been monitored at many different wavelengths over the last several decades. In the observed one-sided jet of M 87 (Shklovsky 1964), superluminal motion was reported from Hubble Space Telescope (HST ) observations within the innermost 6
��of the jet with apparent speeds of 4 c to 6 c (Biretta et al. 1999). Discrepant speeds were reported from VLBA observations at 7 mm with values between 0.25 c to 0.4 c (Ly et al. 2007), and a value of 2 c or even larger (Acciari et al. 2009). VLBA λ2 cm observations showed apparent speeds < 0.05 c from 1994 to 2007 (Kovalev et al. 2007, Lister et al. 2009b). Therefore, the kinematical properties of the jet in M 87 remain an important topic of discussion.
In 1999 HST observations revealed a bright knot in the jet located 1
��(projected dis-
tance of 0.08 kpc) away from the core. This feature, named HST-1, is active in the radio,
optical, and X-ray regimes. VLBA λ20 cm observations showed that HST-1 has sub-
structure and appears to contain superluminal components moving at speeds up to 4 c
2 A multi-band flare of the HST-1 feature in the M 87 jet
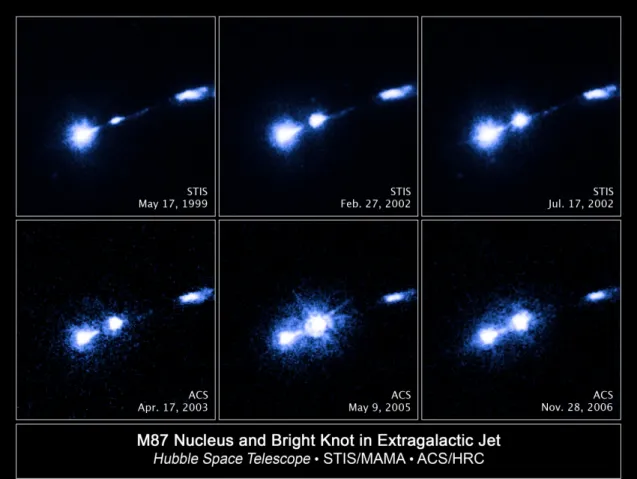
Figure 2.1: The 2005 outburst of HST-1 observed by HST in the near-UV band. Image credit: NASA, ESA, and J. Madrid (McMaster University).
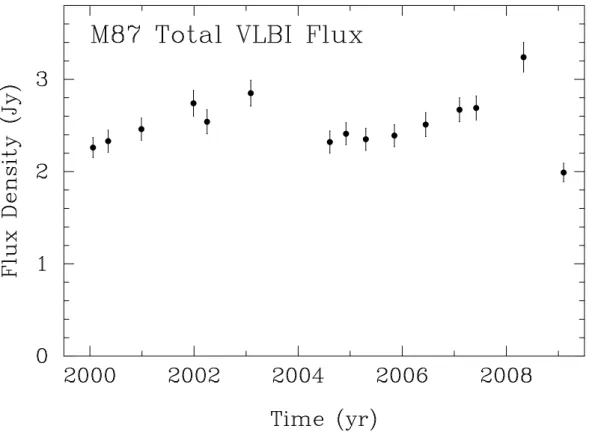
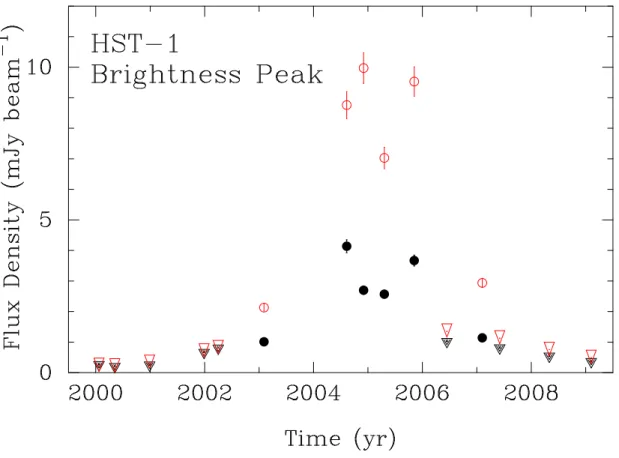
(Cheung et al. 2007). These observations suggest that HST-1 is a collimated shock in the AGN jet. Furthermore, recent multi-wavelength observations were used to show that HST-1 could be related to the origin of the TeV emission observed in M 87 in 2005 by the HESS telescope (Aharonian et al. 2006). Comparing data taken in the soft X-rays (Chandra), near ultraviolet by Madrid (2009), and VLA λ2 cm observations (Cheung et al. 2007, Harris et al. 2006), the light curves of HST-1 reached a maximum in 2005, while the resolved core showed no correlation with the TeV flare (see Figure 2.1 and 2.2). Therefore, the TeV emission from M 87 was suggested to originate in HST-1 (Harris et al. 2008). Based on those findings, Harris et al. (2008) suggest that HST-1 has a blazar nature. However, Acciari et al. (2009) reported rapid TeV flares from M 87 in February 2008, which may have originated in the core, instead of HST-1, which remained in a low state during the flares in 2008. Recently, the Fermi Large Area Telescope (LAT) team reported the detection of M 87 at gamma-ray energies (Abdo et al. 2009c).
The AGN standard model considers the blazar behavior to originate at the vicinity of
the SMBH. However, HST-1 is 80 pc away from the core. If the HST-1 blazar hypothesis
is true, this would pose a challenge to current AGN models. In this chapter, we examine
this hypothesis with λ2 cm VLBI wide-field imaging of the HST-1 feature. In Section 2.2,
2.2 VLBI Observations and Data Analysis
Figure 2.2: The light curves of HST-1 and M 87 core. Left: NUV light curves of HST-1 and the M 87 nucleus, center: NUV and X-ray light curves of HST-1 (Madrid 2009), and right: light curves of the TeV emission from M 87 (Aharonian et al. 2006) and the X-ray and radio emission from HST-1 (Cheung et al. 2007).
observations and the corresponding data reduction. Next, I will present the results in Section 2.3, followed by a discussion in Section 2.4. Finally, I will give a short summary in Section 2.5. Throughout this chapter, we use the term “core” as the apparent origin of AGN jets that commonly appears as the brightest feature in VLBI radio images of blazars (Lobanov 1998, Marscher 2008). We use a cosmology with Ω
m= 0.27, Ω
Λ= 0.73, and H
0= 71km s
−1Mpc
−1(Komatsu et al. 2009).
2.2 VLBI Observations and Data Analysis
2.2.1 Very Long Baseline Array
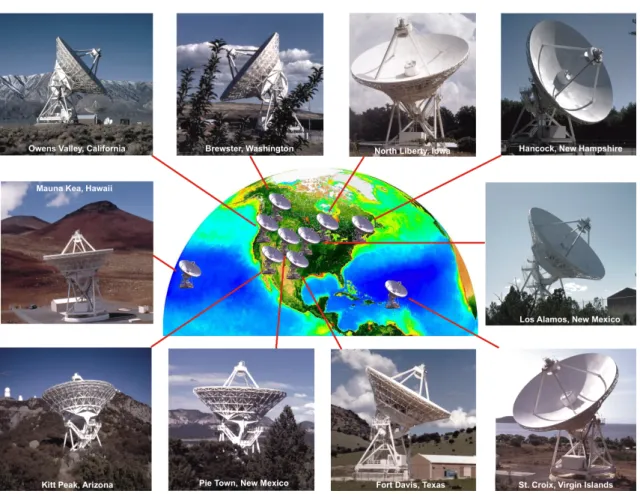
The Very Long Baseline Array (VLBA) consist of 10 stations, and each is a 25 m antenna of the same design. The construction began in February 1986, and finished in May 1993.
The first light of the array was taken in May 29, 1993. In Figure 2.3, one can see the geometrical distribution of VLBA. The baseline lengths range from 236 km to 8611 km,
Table 2.1: List of VLBA stations and High-Sensitivity Array.
Antenna Location Latitude Longitude
MK Mauna Kea, Hawaii 19◦48�04.97��N 155◦27�19.81��W
BR Brewster, Washington 48◦07�52.42��N 119◦40�59.80��W
OV Owens Valley 37◦13�53.95��N 118◦16�37.37��W
KP Kitt Peak 31◦57�22.70��N 111◦36�44.72��W
PT Pie Town, New Mexico 34◦18�03.61��N 108◦07�09.06��W
VLA∗ New Mexico 34◦04�43.75��N 107◦37�05.91��W
LA Los Alamos, New Mexico 35◦46�30.45��N 106◦14�44.15��W
FD Fort Davis, Texas 30◦38�06.11��N 103◦56�41.34��W
NL North Liberty, Iowa 41◦46�17.13��N 91◦34�26.88��W
GBT∗ Green Bank, West Virginia 38◦25�59.24��N 79◦50�23.41��W
HN Hancock, New Hampshire 42◦56�00.99��N 71◦59�11.69��W
Arecibo∗ Puerto Rico 18◦20�36.60��N 66◦45�11.10��W
SC St. Croix, United States Virgin Islands 17◦45�23.68��N 64◦35�01.07��W
Effelsberg∗ NRW, Germany 50◦31�30.00��N 6◦53�00.30��W
∗Antenna added to VLBA to form the High-Sensitivity Array