Multi-wavelength Studies of
Active Galactic Nuclei: The Link between Black Hole Accretion and Galaxy Evolution
INAUGURAL-DISSERTATION
zur
Erlangung des Doktorgrades
der Mathematisch-Naturwissenschaftlichen Fakult¨ at der Universit¨ at zu K¨ oln
vorgelegt von
Mariangela Vitale aus Taranto, Italien
K¨ oln 2014
Berichterstatter: Prof. Dr. Andreas Eckart Prof. Dr. J. Anton Zensus Tag der m¨undlichen Pr¨ufung: 9 April 2014
To Tina and Giorgio
.
Zusammenfassung
Die Entdeckung, daß die Eigenschaften von Schwarzen L¨ochern mit denen der sie beherbergenden Galaxien (sogenannte Host-Galaxien) korrelieren, f¨uhrte zur Hypothese einer gemeinsamen Evolution beider. Die Koevolu- tion des schwarzen Loches mit der Host-Galaxie kann durch Akkretion des Schwarzen Loches und durch den Aufbau stellarer Maße erkl¨art werden.
Beide Mechanismen werden durch das selbe Gas vorangetrieben. Das Gas wird f¨ur beides verf¨ugbar nachdem die Galaxie entstanden ist oder nach Wechselwirkungen mit anderen Galaxien.
Die Schwarzloch-Host Koevolution ist eines der meistdiskutierten Themen der modernen Astrophysik, dennoch wurden noch keine eindeutigen Hin- weise daf¨ur beobachtet. Insbesondere scheinen aktive Galaxienkerne (AGN) - die hellen und akkretierenden schwarzen L¨ocher im Zentrum maßiver Galaxien - einen großen Einfluß auf die physikalischen Eigenschaften der sie beherbergenden Galaxien zu haben. Die meisten Galaxien sind en- tweder aktiv (sie produzieren neue Sterne) und blau sowie spiralf¨ormig, oder paßiv, rot und elliptisch. Galaxien mit Eigenschaften zwischen diesen Extremen haben h¨aufig einen aktiven Galaxienkern in ihrem Zentrum. Es wird angenommen, daß dies in Verbindung zu AGN steht, die Jets und Gasausfl¨uße haben, welche mit dem interstellaren Medium der Galaxien in- teragieren und so die Bedingungen f¨ur die Entstehung von Sternen schaffen oder zerst¨oren.
Eine mehrere Wellenl¨angen umfaßende Studie von AGN und Host Galax- ien bei mittleren Rotverschiebungen kann uns dabei helfen den Grad der Koevolution und die Art und Weise, wie das sogenannte AGN feedback die Sternentstehung reguliert, zu untersuchen. Das Feedback w¨urde dann zur morphologischen und farblichen Ver¨anderung der Host Galaxie f¨uhren. Um
dieses Ziel zu erreichen habe ich eine große Anzahl normaler Galaxien und Host Galaxien in optischen und Radiowellenl¨angen untersucht, da optis- che Spektren die Eigenschaften der Galaxien beinhalten, w¨ahrend die AGN Aktivit¨at im Radiobereich sichtbar ist. Dar¨uberhinaus erlaubt es auch die Untersuchung der Verbindung zwischen optischer und Radioemißion und deren m¨oglicher gemeinsamer Ursprung.
Diese Doktorarbeit erforscht die M¨oglichkeit des Bestehens einer evolu- tion¨aren Sequenz f¨ur Galaxien einer bestimmten Maße. Diese Sequenz w¨urde mit pl¨otzlichen, durch Galaxieninteraktion/-verschmelzung ausgel¨oste Sternentstehung beginnen, gefolgt durch den Aufbau von stellarer maße und der Akkretion auf das schwarze Loch. Ist das schwarze Loch im Zen- trum der Galaxie ein mal aktiv, k¨onnte es einmalig oder mehrmalig ein AGN feedback induzieren, daß letztendlich den Sternentstehungsprozeß in der Host Galaxie beendet. Von diesem Zeitpunkt an entwickelt sich die Galaxie paßiv. Die aufeinander folgenden Stadien der Galaxienevolution werden durch optische Emißionslinien definierte Spektralklaßen repr¨asen- tiert; die Emißionslinien basieren auf niederenergetischen Ionisierungen des Gases. Die Klaßen sind: im Sternentstehungsprozeß, gemischt (Galaxien mit Beitr¨agen zu den Emißionslinien sowohl durch Sternentstehung als auch durch AGN Aktivit¨at), Seyfert und LINER Galaxien.
Abstract
The discovery of general correlations between black hole and properties of the host galaxy has led to the hypothesis of a co-evolution between the two. The black hole-host co-evolution might be explained by black hole accretion and stellar mass build-up of the galaxy being fueled by the same gas. Gas is made available once a galaxy is created, or is gained in successive interactions with neighboring galaxies.
The black hole-host co-evolution is one of the most debated topics of modern extragalactic astrophysics. However, strong observational evidence of it is still missing. Active Galactic Nuclei (AGN) - the bright, accreting black holes at the center of massive galaxies - can play an important role in shaping the physical properties of the galaxies they occupy. Most of galaxies are found to be either active (they form new stars) and blue spirals, or passive and red ellipticals. Galaxies having intermediate properties are often found to harbor an AGN at their centers. This fact has been related to some AGN showing jets and gas outflows, which might interact with the interstellar medium of the galaxies, creating or destroying the conditions for star formation.
A combined multi-wavelength study of AGN and hosting galaxies at inter- mediate redshifts can help us probing the degree of co-evolution, and the way the so-called AGN feedback may regulate star formation in galaxies.
Feedback might lead to the morphological and color transformation of the host. To observe the transformation, I have studied large samples of normal galaxies and AGN hosts in the optical and radio domains. This approach is particularly useful, since optical spectral information can trace host galaxy properties, while AGN activity is visible in the radio. Moreover, this study
allows investigating the connection between optical and radio emission from galaxies, and their possible common origin.
This PhD work explores the chance of an evolutionary sequence for galaxies of a given mass. The sequence would start with merger/interaction triggered bursts of star formation, followed by stellar mass build-up and accretion onto black hole. Once the black hole at the center of the galaxy is active, it might induce once-in-a-time or recurrent AGN feedback, eventually stop- ping the star-formation process in the hosting galaxy. From this point on, galaxies evolve passively. The stages of galaxy evolution can be represented by spectral classes as defined by optical emission-line diagnostic diagrams.
The latter are based on the strength of low-ionization optical lines. The classes are: star-forming, composites (galaxies with mixed contribution to line emission, coming from both star formation and AGN activity), Seyfert, and LINER galaxies.
Contents
List of Figures xiii
List of Tables xv
Glossary xvii
1 Introduction 1
1.1 Galaxies . . . 2
1.2 Active Galactic Nuclei and Active Galaxies . . . 6
1.3 Line emission in galaxies and AGN . . . 11
1.4 Current understanding of galaxy evolution . . . 15
1.4.1 Galaxy bimodality . . . 16
2 Thesis aims 21 2.1 Open questions . . . 21
2.2 Aims and Methods . . . 24
3 Data 27 3.1 COSMOS and zCOSMOS surveys . . . 27
3.1.1 Analyzed galaxy sample . . . 28
3.1.2 Spectral analysis . . . 30
3.2 SDSS . . . 32
3.3 FIRST . . . 34
3.4 Cross-matched SDSS-FIRST sample . . . 34
3.4.1 Selection of SDSS galaxies from the DR7 . . . 35
3.4.2 Optical-radio cross-matching . . . 37
3.4.3 Completeness of the sample . . . 38
CONTENTS
3.5 Effelsberg survey . . . 38
3.5.1 Observations . . . 40
3.5.2 Selection and completeness of the Effelsberg sample . . . 42
3.6 Aperture effect . . . 42
4 Stellar mass-AGN relation in intermediate redshift galaxies 45 4.1 Introduction . . . 45
4.2 Emission-line diagnostic diagrams . . . 48
4.2.1 Low-redshift diagnostic diagrams . . . 48
4.2.2 High-redshift diagnostic diagram . . . 50
4.2.3 Mass-Excitation diagnostic diagram . . . 52
4.3 Mass evolution . . . 54
4.4 Quenching of the star formation . . . 55
4.4.1 AGN identification . . . 56
4.5 Conclusions . . . 57
5 Radio emitters and their optical counterparts 59 5.1 Introduction . . . 59
5.2 Analysis . . . 61
5.2.1 Diagnostics of the SDSS and the cross-matched samples . . . 61
5.2.2 Trend withL20cm/LHα. . . 64
5.2.3 Trend with redshift . . . 70
5.2.4 The WHAN diagram . . . 70
5.2.5 Comparison with models . . . 77
5.3 Discussion . . . 79
5.3.1 Classical diagnostic diagrams . . . 79
5.3.1.1 General trend of the full optical and optical-radio samples 79 5.3.1.2 Explaining the trend withL20cm/LHα . . . 79
5.3.1.3 Explaining the trend with redshift . . . 82
5.3.2 Recent diagnostics . . . 82
5.3.3 Photoionization and shock models for the [Sii]/Hαvs. [Nii]/Hα and [Oi]/Hαvs. [Nii]/Hαdiagrams . . . 83
5.4 Conclusions . . . 84
CONTENTS
6 Galaxy evolution across optical emission-line diagnostic diagrams 87
6.1 Introduction . . . 87
6.2 Low-ionization emission-line diagnostic diagrams of the Effelsberg sample 92 6.3 Results . . . 93
6.3.1 Radio loudness . . . 93
6.3.2 Radio spectra . . . 97
6.3.3 Spectral index and spectral curvature . . . 97
6.3.4 Black hole mass . . . 109
6.3.5 Optical and radio morphologies . . . 112
6.4 Discussion . . . 116
6.4.1 Optical and radio emission in galaxies . . . 116
6.4.2 MBH−Mbulgecorrelation . . . 117
6.4.3 An evolutionary sequence in the BPT diagram? . . . 118
6.4.4 Evolutionary scenarios . . . 120
6.5 Conclusions . . . 122
7 Final discussion and conclusions 125 7.1 Advantages of combined multi-wawelength studies . . . 125
7.2 Optical and radio emission in intermediate-redshift galaxies . . . 126
7.3 AGN feedback . . . 128
7.4 A unified galaxy-evolutionary sequence . . . 129
7.5 Outlook . . . 130
References 133 8 Appendix 145 8.1 Reddening correction . . . 145
8.2 Stellar templates and extinction . . . 146
CONTENTS
List of Figures
1.1 Optical image of the starburst galaxy NGC 1313. . . 2
1.2 Hubble fork composed of optical SDSS images. . . 3
1.3 SED of the starburst galaxy NGC 7714. . . 5
1.4 Multicolor image of Centaurus A. . . 8
1.5 Artist’s view of an Active Galactic Nucleus. . . 9
1.6 Example of optical emission-line diagnostic diagram. . . 12
1.7 Emission-line galaxy classes. . . 14
1.8 Galaxy color bimodality. . . 16
1.9 Color-stellar mass relation for early-type galaxies. . . 19
2.1 Cygnus A active galaxy. . . 22
3.1 zCOSMOS 20k sample. . . 29
3.2 Examples of stellar continuum subtraction. . . 31
3.3 Example of SDSS galaxy spectrum. . . 33
3.4 Radio galaxies observed with VLA. . . 35
3.5 Effelsberg 100m radio telescope. . . 39
3.6 Receivers at the secondary focus of the Effelsberg telescope. . . 40
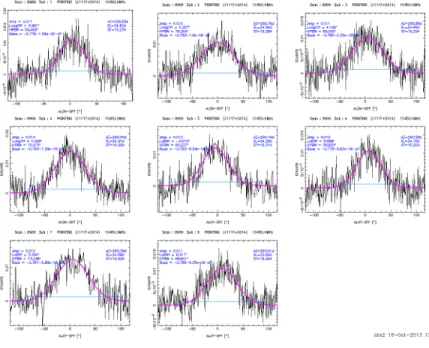
3.7 Cross-scans observing mode at Effelsberg. . . 41
4.1 Emission-line diagnostic diagrams of SDSS galaxies. . . 46
4.2 Classical low-redshift (or BPT) diagnostic diagram of zCOSMOS galaxies. 49 4.3 High-redshift or OII-based diagnostic diagram of zCOSMOS galaxies. . 51
4.4 MEx diagnostic diagram. . . 53
LIST OF FIGURES
5.1 Radio emitters classified according to optical emission-line diagnostic
diagrams. . . 62
5.2 Luminosity trend in diagnostic diagrams. . . 65
5.3 Redshift trend in diagnostic diagrams. . . 68
5.4 Histograms of the luminosity and redshift distributions. . . 71
5.5 WHAN diagnostic diagrams. . . 72
5.6 WHAN diagnostic diagrams: AGN distribution. . . 74
5.7 Data comparison with models. . . 76
5.8 Histograms of radio luminosity and luminosity of Hαline. . . 80
6.1 Effelsberg sample classified according to emission-line diagnostic diagrams. 91 6.2 Radio-loudness of the Effelsberg sample. . . 93
6.3 Radio spectra. . . 96
6.4 Spectral index distribution per galaxy spectral class. . . 98
6.5 Cumulative histograms of spectral indexes and spectral curvatures. . . . 99
6.6 Spectral index distribution represented in the diagnostic diagram. . . 100
6.7 Radio quiet and radio loud galaxies. . . 101
6.8 Spectral curvature distribution represented in the diagnostic diagram. . 103
6.9 Spectral indexes compared with spectral curvature. . . 104
6.10 Additional emission-line diagnostic diagrams. . . 109
6.11 Black hole masses as a function of spectral classes. . . 110
6.12 Black hole mass-radio loudness plane. . . 111
6.13 Optical SDSS images of the star-forming galaxies. . . 112
6.14 Optical SDSS images of the composite galaxies. . . 113
6.15 Optical SDSS images of some Seyfert galaxies. . . 114
6.16 Optical SDSS images of some LINER galaxies. . . 115
6.17 Stellar-black hole mass relation. . . 117
6.18 Sketch of galaxy evolution in the emission-line diagnostic diagram. . . . 118
7.1 Galaxy stellar mass distribution of the complete optical-radio sample. . 127
7.2 Sketch on galaxy evolution. . . 130
List of Tables
3.1 Datasets summary. . . 27
3.2 Line EW statistics on the SDSS DR7. . . 37
5.1 Statistics on SDSS DR7 and optical-radio samples . . . 63
5.2 Statistics on theL20cm/LHαbins. . . 67
5.3 Statistics on the redshift bins. . . 69
6.1 Statistics on the radio loudness. . . 93
6.2 List of sources observed with the Effelsberg telescope at 10.45 and 4.85 GHz. . . 106 8.1 Information on the stacked galaxies of the zCOSMOS mass-redshift bins. 147
GLOSSARY
Glossary
ADAF Advection-Dominated Accretion Flows; flows which are character- ized by very low radiative efficiency.
They might happen during the last stages of gas accretion in massive and passive galaxies.
ADIOS Adiabatic Inflow-Outflow Solutions;
outflows at the galaxy polar region due to energy liberated by the accre- tion onto the black hole.
AGB Asymptotic-Giant-Branch; sequence of stellar evolution identified in the H-R diagram. Massive stars reach the AGB while their most outer lay- ers expand. AGB stars show red colors and luminosities thousands of times the solar one.
AGN Active Galactic Nucleus; accreting and bright black hole located at the center of massive galaxies BPT Baldwin-Philliphs-Terlevich; it refers
to the first and still most used optical emission-line diagnostic dia- gram. The diagram is used to clas- sified galaxies in star-forming galax- ies, Seyferts, LINERs and compos- ites, basing on the relative strength of their emission lines.
ETG Early-Type Galaxies; elliptical and lenticular galaxies.
FR I Fanaroff-Riley Class I; radio sources which have their low brightness re-
gions further from the nucleus than their high brightness regions.
FR II Fanaroff-Riley Class II; luminous ra- dio sources with hotspots in their lobes at great distances from the cen- tre.
IMF Initial Mass Function; empirical function that describes the distribu- tion of initial masses for a population of stars.
ISM InterStellar Medium; matter that ex- ists in the space between the star sys- tems in a galaxy.
LINERs Low Ionization Narrow Emission- Line Regions; class of extragalactic sources mostly addressed as AGN.
They might be partly excited by shocks.
LLF Local Luminosity Function; local space density of sources as a function of luminosity.
LTG Late-Type Galaxies; spiral galaxies.
QSO Quasi Stellar Object; powerful AGN, mostly found at high redshifts. Due to the extremely bright nucleus, the optical spectrum of the galaxy is stellar-like.
SED Spectral Energy Distribution; bright- ness or flux density versus frequency or wavelength of light. It is used to characterize astronomical sources.
Seyfert I Type I Seyferts galaxies; they are very bright sources of optical-UV light and X-rays. They have two sets of emission lines on their spectra:
narrow lines with widths (measured in velocity units) of several hundred km/s, and broad lines with widths up to 104km/s.
GLOSSARY
Seyfert II Type II Seyfert galaxies; they ap- pear bright when viewed at infrared wavelengths. Their spectra contain narrow lines associated with forbid- den transitions. Spectroscopy of po- larized light component reveals ob- scured type I regions.
SFGs Star-Forming Galaxies; class of galaxies that are actively forming stars and are therefore rather blue and luminous at optical-UV wave- lengths. They occupy a well-defined
branch in the optical emission-line di- agnostic diagrams.
SMBH Super Massive Black Hole; black hole whose mass exceedes 106M⊙.
SN Super Nova; massive star in the last stage of stellar evolution. It explodes releasing metals in the interstellar medium, and provoking shocks in the latter. The explosion is source of syn- chrotron radiation.
1
Introduction
Astronomy is one of the oldest and still most fascinating among natural sciences. Orig- inally meant as the study of positions and motions of celestial objects, and based on naked-eye observations, astronomy has then become a brand new science, called astro- physics. Astrophysics began when the first spectra of celestial objects were taken, as this was established to be an accurate method to investigate chemical composition and physical properties of celestial sources.
Galaxies are among the most studied objects. Galaxy emission is examined across the entire electromagnetic spectrum to seek for information on properties such as mass, lu- minosity, gas density, morphology, temperature, and chemical composition. Since the first galaxies were observed with rudimentary telescopes, much about these complex astronomical objects has been discovered. However, galaxy formation, evolution, and properties, still need to be investigated and fully understood. Our knowledge of galax- ies has been increasing in the last decades thanks to the development of modern and more sensitive observing instruments, which allow deep sky investigations. Data have been collected, analyzed, and interpreted, allowing us to add pieces to the big puzzle of the story of galaxies. The estimated number of galaxies in our universe is extremely high, about 1011. A galaxy contains an average amount of 1011stars and, in most cases, it hosts a super-massive black hole in its center. When studied in detail, each galaxy appears to have a unique set of features. However, an extensive study of each object is hardly possible. A good way to study global galaxy properties is to divide galaxies into sub-classes which have similar physical properties.
1. INTRODUCTION
Figure 1.1:Optical image of the starburst galaxy NGC 1313. Bright regions in the spiral arms correspond to sites of intense star-formation. Credit: Henri Boffin (ESO), FORS1, 8.2-meter VLT, ESO.
1.1 Galaxies
Galaxies contain mainly stars, gas and dust. Galaxies can be found isolated, or can be gravitationally bound in groups (a few galaxies) or clusters (hundreds to thousands of galaxies). These conditions determine the so-calledenvironment, which has been proven to have an influence on galaxy properties as mass, morphology, and color. The influence of environment on galaxy morphology was first noted by Edwin Hubble and Milton Humason in 1931 (see 1, for a review). In groups and clusters, galaxy interactions like mergers, fly-by, or gas stripping, are more frequent and can lead to exchange of gas and dust. Fig. 1.1 shows a spectacularstarburst galaxy, a luminous blue galaxy containing a large amount of ionized gas, where the star formation rate (SFR, the stellar mass produced per year in the star-formation process) is particularly high (more than 100 M⊙ yr−1). A starburst is therefore a galaxy that is “very active”, in the sense that it undergoes large burst(s) of star-formation. This is probably due to the above-mentioned galaxy-galaxy interactions, which have brought new gas that becomes available for fueling star-formation.
1.1Galaxies Figure 1.2: Hubble fork composed of optical Sloan Digital Sky Survey (SDSS) images. Galaxies come in two main flavors:
Ellipticals (E) and Spirals (S). Spiral galaxies can be divided in barred (B) and unbarred, depending on the presence of an elongated narrow structure in their center (called bar). Numbers 0-7 represent the increasing ellipticity of the galaxy. The ellipticity is the ratio between major and minor axis. Letters a-c indicate how tight around the bulge the spiral arms are (“a” meaning loose and
“c” very tight). Lenticular galaxies (S0) have intermediate properties between E and S.
3
1. INTRODUCTION
Galaxies can be classified and studied according to different physical properties, like mass, size, morphology, color, age of the stellar populations, nuclear activity. Ac- cording to the classification proposed by Hubble in the 30’s and still in use nowadays1 (Fig. 1.2), galaxies can be classified as spirals (also called spiral galaxies or late-type galaxies) and ellipticals (elliptical galaxies or early-type galaxies). Lenticular morphol- ogy is intermediate between ellipticals and spirals. Objects that cannot be classified as one of these three kinds are regarded as irregular galaxies. Galaxies with spiral morphology usually contain large amounts of gas in their arms. Gas is fundamental for the formation of new stars. Spiral galaxies have blue colors, due to optical-ultraviolet emission coming from the newly formed, hot, and bright stars. On the contrary, el- liptical galaxies contain less gas and mostly show older stellar populations. The color of elliptical galaxies is typically redder than the color of late-type galaxies, due to the contribution of old stars to the global emission. Ellipticals do not show arms in their morphology, whereas the bulge (the central region of the galaxy, where most of the stars are located) is prominent. Most galaxies can be designated unambiguously to a certain morphological class. Only a few galaxies display intermediate properties, e.g.
interacting or irregular galaxies. Spirals are among the largest galaxies in the sky, with disk diameters of 5 to 100 kpc2, and a mass range of 109−1012M⊙3. Ellipticals can be more massive, with masses up to 1013M⊙, and reach a size of hundreds of kpc in case of giant ellipticals. Irregular galaxies cover a wide range of characteristics, though they are on average smaller (1−10 kpc) and less massive than spirals and ellipticals (108−1010M⊙) (2).
The observed local galaxy bimodality (3, 4, 5, 6, 7), i.e. the presence of two promi- nent galaxy classes, one blue and young, and the other red and old, might indicate that galaxies which are born with comparable global masses undergo a similar color and morphological transformation. Ideally they move along an evolutionary sequence, starting as spirals and ending as elliptical galaxies. In this case, the transition from blue and active to red and passive galaxy type would be very fast, so that only a few objects are “caught” in the act of evolving from one class to the other.
Spectra contain large amount of information and represent one of the best tools for
1After minor modifications. Also, the Hubble sequence does not represent an evolutionary sequence, as previously stated.
2One kpc corresponds to 103parsecs, where a parsec is∼3×10¹⁶m.
3In solar mass units. A solar mass is∼2×1030kg.
1.1 Galaxies
Figure 1.3: SED of the starburst galaxy NGC 7714. The plot shows the contribution of each galaxy component to the continuum emission. Stellar components can dominate in UV, visible, or far-IR (through dust emission) depending on the galaxy’s history and structure. X-ray dominance and significant radio emission are produced by active nuclei.
Credits: B. Keel, NED, Kennicutt atlas, FUSE data.
the study of galaxies and other celestial objects. On one hand, the analysis of emission and absorption lines provides an insight into chemical composition and physical condi- tions of the galaxy components - stars, gas, and dust. On the other hand, the shape of the continuum emission at specific wavelengths gives us hints on the contribution of each component to the overall emission. For example, thermal emission in infrared is mainly due to stars and dust, while synchrotron radio emission originates from Su- per Novae (SNe) explosions, or nuclear activity. Fig. 1.3 shows the spectral energy distribution (SED) of the starburst galaxy NGC 7714. The plot indicates the contribu- tion of X-ray emitting binaries, hot interstellar medium (ISM), stars, dust (reprocessed starlight), SNe and other sources of synchrotron radiation. The latter is produced by high-velocity electrons in a magnetic field. The amplitude of the far-infrared “bump”, or peak, is proportional to both the abundance of dust which is present in the galaxy and the star-formation rate. It is more prominent for starburst galaxies than for normal spirals. Direct starlight and the external regions of the accretion disk produce a bump in the UV-optical, also called “blue bump”.
The engine that causes the gas ionization and line transitions which are detectable in
1. INTRODUCTION
galaxy spectra can either be star formation, nuclear activity, or a combination of both.
For a fixed temperature and density of the gas, the observed strength of a line depends on the total number of ions that are responsible for that line transition. HII regions - rich-in-hydrogen areas where most of the star formation takes place - are mainly lo- cated in the outskirts of spiral and irregular galaxies. These contain large amount of interstellar gas and young O and B stars as powerful sources of photoionization. In the central region of galaxies, the origin of emission is often a combination of nuclear activity and stellar ionization. By measuring the relative intensity of emission lines, it is possible to disentangle the nature of the ionizing engine. Stars and nucleus will produce ionizing fields with different strengths, and thus induce different sets of tran- sitions. Knowing the cause of line emission in galaxies, and whether it is dominated by star formation or nuclear activity, will help us understanding the evolution of galaxies.
1.2 Active Galactic Nuclei and Active Galaxies
There are few galaxies whose nuclear ionized gas is not associated with hot bright stars. Examples are Seyfert galaxies and quasars. Seyfert galaxies are very luminous active galaxies, and distant and bright sources of electromagnetic radiation, whose spectra reveal strong, high-ionisation emission lines. Quasars (also called quasi-stellar objects) are extremely luminous and were first identified as being high redshift sources of electromagnetic energy, including radio waves and visible light, that were point-like, similar to stars. Unlike quasars, Seyfert host galaxies are clearly detectable. These two kinds of galaxy nuclei have luminosities of the order of 1012L⊙1, far too much for the energy source to be of stellar origin (the most massive stars have luminosities of the order of 105L⊙). For a spherically symmetric object in hydrostatic equilibrium, the Eddington condition for the minimum radiation pressure to contrast gravitational force must be satisfied:
L≤LE=4πGcmHM
σT = 1.26×1038M M⊙
whereGis the gravitational constant equal to 6.67384×10⁻¹¹m3kg−1s−2,cthe light speed, mH the proton mass, M the mass of the object andσT the Thomson cross-
1In solar luminosity units. The luminosity of the Sun is∼4×1033erg s−1.
1.2 Active Galactic Nuclei and Active Galaxies
section1. The equation can also be written in the form:
L L⊙≤LE
L⊙
= 3.22×10⁴M M⊙
from which one can infer that a source ofL= 1012L⊙in hydrostatic equilibrium must haveM≥3×10⁷M⊙, which is the typical mass of a black hole. Furthermore, fast con- tinuum variations observed in Active Galactic Nuclei (AGN), or accreting black holes, suggest that the energy source must have a size in the order of 1 light-week or -day (0.005−0.001 pc). Therefore, the best candidate as energetic source in AGN is the accretion disk around a super-massive black hole, namely the release of gravitational (or rest-mass) energy of matter converted into radiation due to friction. Super-massive black holes can have masses ranging from 106to∼109M⊙. Fig. 1.4 shows one of the most studied AGN. The galaxy orientation is edge-on, which means the observer’s line of sight meets the dust lane that surrounds the galaxy, thus we are not looking directly towards the nucleus. The prominent jets, possibly originating in the nuclear region and collimated by a strong magnetic field, propagate in the medium perpendicularly to the galaxy plane. Galaxies hosting AGN can be classified according to their luminosities, the strength of the emission lines, or their physical properties. A common way to iden- tify AGN is to look for them in the X-ray or radio domain. X-ray emission is a very energetic radiation probably produced in a compact region close to the super-massive black hole. Also powerful radio galaxies frequently host an active nucleus at their cen- ter. In radio galaxies, synchrotron emission typically arises from the nucleus, and from two large, diametrically opposite lobes that extend up to kiloparsec scales. It is be- lieved that lobes originate from magnetized plasma, collimated into two powerful jets ejected by the accreting black hole. However, observability of jets is highly dependent on the inclination angle of the source. When the AGN is face-on (we look directly at the nucleus, and the galaxy disk is perpendicular to the observer’s line of sight), the jets might be aligned with the observer’s line of sight. We then measure an intensity that is magnified by relativistic factors, the so-calleddoppler boosting. Moreover, there are AGN that might not show jets for some reasons, e.g. sensitivity limits of the current instruments. Once again, spectral information is essential for a deep understanding of
1Section of elastic scattering of electromagnetic radiation by a free charged particle, as described by classical electromagnetism.
1. INTRODUCTION
Figure 1.4:Multicolor image of Centaurus A, a dusty elliptical galaxy harboring an AGN.
In the image, we see the dust ring encircling the giant galaxy, and the fast-moving radio jets ejected from the galaxy centre, signatures of the supermassive black hole at the heart of Centaurus A. Credits: ESO press release 2009-01-28.
AGN properties. All AGNs have a continuous spectrum in the optical region, in addi- tion to their emission lines. Their hosting galaxies have the typical integrated stellar continuum plus absorption-line spectrum1. Emission lines observed in AGNs are similar to the emission lines observed in HII regions of normal (without AGN) galaxies, except that AGNs have a higher range of ionization. Highly ionized elements, such as [NeV], [FeVII], and [FeX], are observed in AGN. [SII]λλ6717,31, [OII]λλ3726,29, [NII]λ6584, and [OIII]λλ4959,5007 (hereafter [SII], [OII], [NII], and [OIII], respectively), which are a relatively low stage of ionization, are usually stronger in AGN than in star-forming galaxies
There are several excitation mechanisms that give important contributions to galaxy emission, though photoionization is the most likely source of excitation for the emission line gas in AGNs. Dissipative processes in the accretion disc transport matter inwards and angular momentum outwards, while causing the accretion disc to heat up. The
1In this work we consider AGN to be the host galaxy + active nucleus, more than the accreting black hole only. Definitions are often interchangeable in literature, though I try to use the term “host”
while speaking of surrounding galaxy.
1.2 Active Galactic Nuclei and Active Galaxies
Figure 1.5:Artist’s view of an Active Galactic Nucleus (AGN). The black core represents the accreting black hole, and the red ring the accretion disk. The jets are colored in salmon.
Grey clouds close to the accretion disk represent the Broad Line Region (BLR), while the most outer clouds are the Narrow Line Region (NLR). The dusty torus is represented in brown/yellow. Courtesy of Sebastian Kiehlmann.
radiation from the accretion disc excites cold atomic material close to the black hole and this, in turn, radiates at particular emission line frequencies. Another mechanisms of ionization could be the “auto-ionizing shocks”, e.g. jets in radio galaxies. These heat the local medium sufficiently that it re-radiates in UV and X-ray (8). Often, a combination of these processes is needed to explain the observed emission-line ratios (9).
Unified models of AGN propose that different observational classes of AGN are a sin- gle type of physical object observed under different conditions. The currently favored unified model is a “orientation-based unified model”, where the apparent differences amongst AGNs arise because of their different orientations to the observer (10, 11).
Fig. 1.5 shows the AGN components according to the picture offered by the unification model. TheNarrow Line Region(NLR) of an AGN is a region of clouds embedded in ionized and neutral gas generally characterized by strong [NII] and [OIII] emission. In contrast to the more compact (less than 1 pc, or several light days)Broad Line Region (BLR), the NLR is in the order of 103pc in size and contains relatively low-density
1. INTRODUCTION
gas, with electron densitiesNe∼104cm−3. In some cases, the BLR is hidden by the dustytorus, which is large enough to obscure the BLR but not the NLR. Seyfert I are galaxies where both the NLR and BLR are observable. Seyfert II are objects where, due to inclination effects, the BLR is not directly visible. The presence of the BLR in Seyfert II can then be verified by complementary studies of the polarized AGN light, since emission from the inner parts is scattered on the material around the torus and reaches the observer from a different angle. Narrow lines have typical widths of up to
∼500 km s−1. The BLR hasT∼104K, such that photoionization is the main process responsible for line emission. The lines are much broader compared with the NLR ones, and range between∼1000 and 25000 km s−1. The broadening of the lines in the BLR, which is located closer to the nucleus, is caused by supersonic bulk motion of the emitting gas. The gas density can be estimated by using the line ratios of forbidden transitions, e.g. [OIII] lines, since these transitions only take place if the density is lower than a critical value. The critical density for an atomic level is defined as the density at which the collisional de-excitation rate balances the radiative transition rate. The critical density depends on the element, and on the specific transition. For example, in case of [O III] the value is 7×105cm−3(12).
According to the intensity of their narrow lines, most of the local AGN population can be divided in Seyfert galaxies and Low Ionization Narrow Emission Line Regions (LINERs, 13). At high radio powers, the classification is analogous. However, the population of radio galaxies is completely dominated by low-luminosity, low-excitation objects. These do not show strong emission lines from the nucleus. Seyferts are rather powerful AGN and present a high [OIII]/Hβratio. Their hosting galaxies have lower stellar masses compared to LINERs hosts, and the stellar populations show a wider range of ages and metallicities (14). At radio wavelengths, LINERs show the highest fraction of AGN peculiar morphologies, like jets and lobes.
Galaxies are considered as radio-loud if they have ratios of radio flux at 5 GHz to optical flux in B band greater than ten (15). According to Fanaroff (16), radio-loud galaxies (generally AGN) can be divided into two major classes. In Fanaroff-Riley Class I (FR I) sources, the radio emission peaks near the galaxy nucleus and the emission from the jets fades with distance from the center. In contrast, FR II sources present bright radio lobes, which can reach kpc-scale distances from the nucleus. FR I sources dominate the population of radio emitters at low radio power (<1025W Hz−1at 1.4 GHz) and
1.3 Line emission in galaxies and AGN
low redshifts, while more powerful radio galaxies (with 178-MHz radio power greater than 1027W Hz−1) are almost exclusively FR II systems. These can also be detected at higher redshifts compared to FR I. It is possible to observe the jets interacting with the surrounding medium and forming a bow-shock. This is called “sharp-edge feature”.
Such FR II features are present when the central engine releases a large amount of energy, or when the source is young enough for the aging of the radiation not to play a role. In the oldest sources, nowadays more associated to LINERs and FR I, the radi- ation that originates from the nucleus and propagates through the jets loses power as it interacts with the medium, therefore lobes are not a prominent feature any longer.
Here the environment, especially the position of the galaxy in a group or cluster, and the density of the intergalactic medium, play an important role in shaping the galaxy’s morphology.
Radio galaxies can be further classified according to the strength of high-excitation narrow-line emission. The majority of FR I radio galaxies show either no or very weak emission lines. Those are referred to as low-excitation systems (17), and are mostly found in elliptical galaxies with little ongoing star formation (18, 19). If optical spec- troscopic information is available, these galaxies are generally classified as weak AGNs or LINERs. Conversely, the most powerful and high-redshift FR II radio galaxies have, in most cases, strong emission lines. They are classified as strong AGNs (20) and have peculiar optical morphologies, e.g. tails, bridges, and shells (21), and bluer colors com- pared to giant ellipticals. It has also been established that powerful FR IIs show a strong correlation between their radio luminosity and their optical emission-line lumi- nosity (22), suggesting that both optical and radio emission originate from the same physical process.
Observations at various wavelengths have contributed to increase our knowledge of AGN hosts. Every spectral band, from the far IR through the optical-UV, and to the X-ray regime, has provided information that helped understanding these objects.
1.3 Line emission in galaxies and AGN
The temperature of the ionized gas in galaxies hosting AGN is of order of 2×10⁴K1. This indicates that the main source of energy input is by photoionization. Analysis of
1Value computed for NLRGs and Seyfert 2 galaxies.
1. INTRODUCTION
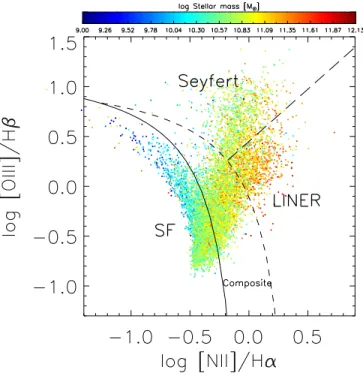
Figure 1.6: Example of an optical emission-line diagnostic diagram (4, 23, 24, 25, 26).
Data points represent radio emitters for which optical spectral measurements are available.
Colors indicate galaxy stellar mass values. “Blue” means low stellar mass, and “red” is high stellar mass. A theoretical demarcation curve (dashed, Kewley et al. 25) separates star-forming galaxies and composites from AGN (Seyferts and LINERs), while an empirical demarcation curve (continuous, Kauffmann et al. 27) separates pure SFGs from composites and AGN. Composite galaxies show a mixed contribution to line emission from both star formation and AGN activity. A further line separates Seyferts from LINERs (long-dashed, Schawinski et al. 28).
1.3 Line emission in galaxies and AGN
AGN spectra show that the main source of radiation cannot be hot stars. Radiation from such hot stars cannot produce the wide range of ionization observed in AGN, with emission lines of low ionization stages, such as [OI] and [SII], as well as higher stages (e.g. three times ionized species and so on). Thus, the source of the emission must have a much harder spectrum, capable of ionizing one species several times. The en- ergy released from the accretion process that feeds the black hole in the galaxy nucleus might be responsible of photoionizing the emitting gas.
The classification of AGN and star-forming galaxies from their optical spectra is mainly based on the recognition of the main energetic source - nucleus or stars, respectively - responsible for the observed emission. A classification can be achieved by the compar- ison of ratios of prominent emission lines, like the doubly ionized oxygen, or nitrogen, and the lines of the Balmer series. Balmer lines (Hα, Hβ, Hγ, Hδ, etc.) are associated with star formation, and are the main line features in the spectra of normal galaxies. In the most commonly used emission-line diagnostic diagram, the [NII]/Hαand [OIII]/Hβ line ratios are used (23). In such diagram (Fig. 1.6), the star-forming galaxies occupy a sequence from the upper left to the lower center. This sequence is considered to be a consequence of the correlation between metallicity1and ionization parameter. Nitro- gen enhancement in AGN is thought to originate from secondary CNO nucleosynthesis, where carbon and oxygen are pre-existing, and then distributed by stellar winds from massive stars. This creates a unique scaling relationship with metallicity, [N/H]∝Z2, while other elements scale linearly with metallicity (29).
The ionization parameter indicates the ratio between the ionizing photon flux and the gas density in a cloud, and determines the degree of ionization of a chemical species.
The ionization parameter for hydrogen (U) at the front of a gas cloud is given by:2 U=|ionizing photon f lux|
cNe =
R∞ ν0Lνdν/hν
4πr2cNe
whereNeis the electron density,ν0is the threshold ionization frequency,ris the cloud- center distance, andcis introduced to makeU dimensionless. Typical values forU in AGN clouds range between 0.1 and 1 (30). Although there is a different ionization parameter for each species, and for different distances from the cloud center,Ugives a
1The relative percentage of chemical species heavier than helium, usually measured in solar metal- licity units.
2Source: http://ned.ipac.caltech.edu/level5/March02/Netzer/Netzer2.html
1. INTRODUCTION
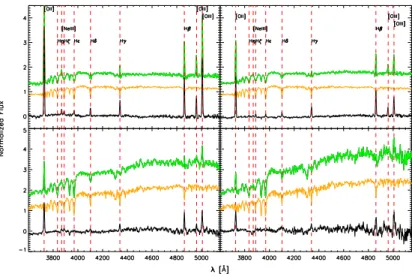
Figure 1.7: Emission-line galaxy classes and their optical spectra. Prominent emission lines are identified. Based on Ho, Filippenko & Sargent 1993 and unpublished data.
good approximation of the overall level of ionization. The ionization parameter is also a measure for ionization structure changes, where the thickness of ionization fronts is inversely proportional toU. A high ionization parameter (U∼0.1−1) corresponds to a sharp transition between successive stages of ionization, and lowU results in thick regions of gradual change in the level of ionization. LowU indicates several stages of ionization co-existing over large parts of the cloud.
As the metallicity (expressed in Fig. 1.6 by the [NII]/Hαratio) increases, the ionization parameter, expressed by [OIII]/Hβ, decreases at first. The sources on the right-hand side of the star-forming region in the diagnostic diagram represent AGN hosts (Seyferts and LINERs). AGN produce higher [NII]/Hαand [OIII]/Hβthan star-forming galaxies, due to their harder ionizing fields (e.g. capable of doubly ionizing more oxygen atoms) and the inefficiency of cooling. The high-energy photons of AGN cause high ionization near the central source, as well as a more extended, partially ionized zone where atoms and ions can be collisionaly excited. Collisional excitation gives rise to spectral lines in the spectra of astronomical objects such as H II regions. In these objects, most
1.4 Current understanding of galaxy evolution
atoms are ionised by photons from hot stars, stripping away electrons. The emitted electrons, (called photoelectrons), may collide with atoms or ions within the gas, and excite them. When these excited atoms or ions revert to their ground state, they will emit a photon e form a line. One should keep in mind that line emission-line ratios depend both on the specific element abundances and the strength of the ionizing fields (e.g. the type of stars). High [OIII]/Hβvalues require high ionization parameters and are a common feature of metal-poor star-forming galaxies and AGN (31). Fig. 1.7 illustrates the typical optical spectra of AGNs (top and middle spectra), compared with the normal star-forming galaxy NGC 7714 (bottom spectrum). Strong low-ionisation emission lines are very prominent in AGN (Seyferts and LINERs) in contrast to the spectrum of a normal galaxy, where Hα, Hβ, and the other lines of the Balmer series are more prominent.
1.4 Current understanding of galaxy evolution
Recently, a better overview of galaxy formation and evolution has been developing, with a great contribution coming from large cosmic surveys. Cosmic surveys play an important role in modern astrophysics. They open the door to extensive studies on large statistical samples of galaxies, and catch the light from objects that are not located in the local universe. The fact that all massive galaxies might harbor a black hole at their center has generated new hypothesis on galaxy evolution (32, 33). The central black hole can be either active, if it accreates material from the accretion disk, or inactive.
Active black holes might present highly collimated emission of charged particles, the so-called jets, that possibly influence galaxy evolution. Jets can on the one hand be able to clear the gas reservoir of the galaxy, eliminating the fuel to produce new stars, and on the other hand create shock fronts and compress the inter-stellar medium, creating the conditions to form stars. Therefore, studying AGN is crucial to understand whether their presence can affect galaxy properties significantly and/or induce morphological and color evolution.
1. INTRODUCTION
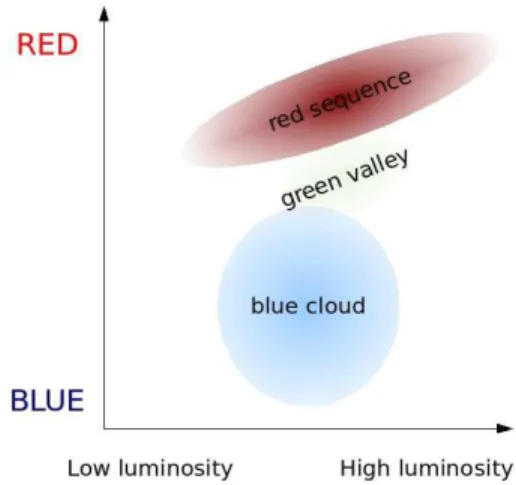
Figure 1.8: Representation of the galaxy color bimodality in a color-luminosity plot.
Credits: Wikipedia.
1.4.1 Galaxy bimodality
The local galaxy’s color function, i.e. the distribution of galaxy colors1, has been dis- covered to be a bimodal function (3, 4, 5, 6, 7). The two dominant color sequences are associated with the ellipticals+lenticulars population (red sequence) and the spi- rals+irregulars population (blue cloud). Galaxies showing intermediate properties, like early-type red spirals, are considered as composites or transitional objects (green val- ley). Early-type galaxies (ETGs) are mostly found in the red sequence amd dominate at the top-end of the local galaxy mass function, which means that they are particu- larly abundant among massive galaxies. Conversely, late-type galaxies (LTGs) are rare among massive galaxies and occupy the blue cloud preferentially. Fig. 1.8 shows a representation of the galaxy color bimodality in the luminosity-color plane.
The fast suppression of the star formation activity, the so-calledquenching, is currently thought to initiate passive galaxy evolution and to be largely responsible for the grow- ing abundance of galaxies on the red sequence (34). The star formation quenching could be explained by several mechanisms. The observed decline of the galaxy star
1Inferred from the band filter.
1.4 Current understanding of galaxy evolution
formation fromz ∼1 toz = 0 can be caused by a gradual and naturalgas exhaus- tion(35). Another mechanism that could explain the quenching aremajor mergers1. The interaction between a galaxy and its neighbors could indeed produce gravitational torques on the gas, reducing its angular momentum and allowing it to fall it toward the galactic center after an initial starburst phase (36). As a result, fuel is available for accretion, allowing the growth of the central black hole instead of the formation of new stars in the disk. However, the importance of mergers in the build-up of the galaxy bimodality has been criticized, as luminous and massive old galaxies formed via mergers were already common atz∼1 (37), and their number density only declines above this value. If merger events were efficient in forming galaxies atz <1, we would expect an increasing number of massive objects towards low redshift, which has not been observed.
Similarly, a role for AGN in galaxy evolution has been suggested (38, 39, 40, 41). Black holes are thought to be a basic constituent of most massive systems (42) and they have also been identified in some late-type and dwarf galaxies (43). During the BH accretion, AGNs release a large amount of energy, which could be partially absorbed by the host galaxy and quench the star formation via re-heating of the interstellar gas. Eventually, this transforms blue galaxies into red galaxies (e.g. 44, 45, 46). According to Cattaneo et al. (47), less than 1% of the energy released within a bulge during the BH accre- tion would be sufficient to heat and/or blow away the entire gas content. Consistent with this framework, Hopkins et al. (48) further developed the scenario described in Sanders (49), where starburst, quasar active phase, BH growth, and elliptical galaxies are connected to each other in a galaxy evolutionary sequence. This sequence starts with mergers, and the gas consumption is coupled with supernova-driven winds and/or AGN-feedback to quench star formation.
The hypothesis of AGN feedback is strengthened by the fact that a large amount of galaxies have been found to go through an active phase. Summed over all Hubble types, roughly half of all galaxies can be considered as active (50), even though some of them show a fairly low activity level. The amount of active galaxies becomes more remarkable for galaxies with a prominent bulge component, rising to 50-70% for Hubble types E-Sb. The percentage of AGNs drops towards later Hubble types (Sc and later), where about 80% of the galaxies host a star-forming nucleus instead. This suggests a
1Encounters of galaxies of similar mass and size.
1. INTRODUCTION
clear dependence of nuclear activity on the Hubble type (4, 51). The observed distri- bution of Hubble types for galaxies hosting active versus inactive nuclei leads to the expectation that the blue and red populations do not only differ in nuclear, but also global properties. In particular, it seems that the observed high fraction of AGNs in the green valley points to a connection between the end of the star formation phase, observed in a change of the galaxy color, and the rise of AGN activity (52, 53). In Fig. 1.9, Schawinski et al. (54) show an example of color-stellar mass relation, and assumeu−rcolors1 as a proxy for the stellar age of galaxies in their Sloan Digital Sky Survey (SDSS) sample divided in spectral classes according to their emission-line ratios. Stellar mass is here considered as a “cosmic clock” and indicates a sort of galaxy evolutionary sequence. On their way to the red sequence, galaxies seem to undergo a phase of significant nuclear activity, indicating that AGN may have a role in galaxy evolution. At the high-mass end of their sample, only quiescent and LINER galaxies are found.
1Difference between the ultraviolet (u) and red (r) optical filters.
1.4Currentunderstandingofgalaxyevolution
Figure 1.9: Color-stellar mass relation for early-type galaxies. Plot from Schawinski et al. (54) illustrating the color-stellar mass relation for a sample of early type galaxies drawn from the SDSS. In each panel, morphological late-type galaxies are gray, quiescent early-types are orange and the various active early-types are blue (star forming), purple (transition region), green (Seyfert), and red (LINER). These spectral classes are based on the classification in Fig. 1.6.
19
1. INTRODUCTION
2
Thesis aims
2.1 Open questions
The possibility of a general correlation between emission lines and radio luminosities of AGNs has been already explored in the past (55, 56). Radio-loud AGNs are most likely to display optical emission lines in galaxies with low velocity dispersions1 and radio luminosities greater than 1025W Hz−1(57). A similar correlation has been observed between the emission-line luminosity and the ionization state of the gas for a sample of low-zradio galaxies (58). The higher values of the emission-line luminosities have been measured for the more powerful radio sources, as an indication of the presence of a strong ionizing AGN-like field. However, a problem arises since the most powerful radio galaxies are generally detected at higher redshifts than the less powerful radio galaxies. This is due to selection effects, and makes it difficult to establish whether the correlation is between the emission-line luminosity and radio luminosity, or rather between emission-line luminosity and redshift (55). For the same reason, it is also not simple to build a large statistical sample of emission-line radio galaxies placed at inter- mediate and low redshifts.
The well-known effect of having an increasing number of detected powerful radio AGNs with increasing redshift is not only due to a selection bias, but it is also supported by the downsizing scenario of galaxy evolution (59). Galaxies placed at higher redshifts are more massive than local galaxies, and host massive black holes that accrete gas,
1Indicated withσ, it is the statistical dispersion of velocities about the mean velocity for a group of object, eg. stars.
2. THESIS AIMS
Figure 2.1: The powerful radio galaxy Cygnus A shows prominent jets and lobes, origi- nating from the central black hole. Image courtesy of C. Carilli.
producing powerful jets. These galaxies are easily detected in the radio domain, while low-redshift radio galaxies host low-mass black holes, with weak jets that are more difficult to observe. On the other hand, quasars detected in the radio but not in the optical regime might be heavily obscured objects. They experience dust obscuration when observed through the optically thick torus, which surrounds the black hole (uni- fied model by Antonucci, 10), or dust lanes in the hosting galaxy. Proofs of a true correlation between optical and radio galaxy emission, as well as extensive combined studies in these two domains, are still missing.
One of the current scenarios of galaxy evolution includes the possibility of a smooth transition from LTGs, which show blue colors and ongoing star formation, to red and passively evolving ETGs. This transition could be driven by the so-called AGN feed- back (47, 60), which is thought to be responsible for star formation quenching. In particular, radio galaxies are excellent candidates for testing this scenario, since they present jets (see Fig. 2.1) that could heat up the interstellar medium, thus prevent- ing cooling and star formation, or push the gas away from the nuclear region. After quenching, a phase of passive evolution starts, and the galaxy color turns redder. Some studies show that there is indeed a correlation between the age of galaxy stellar pop- ulations and the AGN activity (61, 62), with the oldest stars inhabiting the AGN-like galaxies. Moreover, AGNs are found to reside almost exclusively in massive galaxies
2.1 Open questions
(M∗>1010M⊙) with structural properties similar to normal early-type systems (63), which are dominated by old stellar populations.
The question of whether the AGN feedback is capable of quenching star formation, or rather triggering it in the vicinity of the black hole and on larger scales, still has to be answered. The standard accretion mode of AGNs, which is associated with quasar activity (64), is related to star formation in the host galaxies (4). This scenario seems to contrast the quenching of the starburst activity due to AGN feedback. Very re- cent results from studies using integral field spectroscopy techniques (65, 66) or the extremely high spatial resolution of ALMA (67) and other radio facilities (68) show the presence of gas outflows propagating from the center of galaxies. Outflows could be re- sponsible for compressing the medium, or cooling it down, or enhancing the metallicity (important for cooling and star formation).
Star formation and black-hole accretion, both fueled by the same material, might occur with delays with respect to each other (69, 70) and come to an end once the gas is ex- hausted. A fraction of AGNs discovered in starburst galaxies show powerful radio jets and are therefore radio “loud”. Ivezic et al. (71) have shown that a sample of optically unresolved radio-bright sources from the FIRST radio survey have bluer colors than other SDSS objects. Richards et al. (72) found that the SDSS quasar candidates - which are likely to have a radio counterpart - display blue colors, especially atz >1, indicative of ongoing star formation. If this is proven to be right, starburst, AGN, and passive elliptical could be regarded as different but related phases in the evolution of a regular galaxy.
To understand the importance of AGN feedback in the current scenarios of galaxy evolution, a study of AGNs and their host galaxies properties, and the physical mech- anisms that trigger line emission or radio activity, is necessary. One of the major goals of modern astrophysics, and topic addressed in this thesis, is the understanding of the interplay between black hole accretion and evolution of the physical properties of the hosting galaxy. In particular, I would like to address the following questions:
•Are optical and radio emission in AGN hosts connected, and originating from the same physical mechanism(s)?
•Does the AGN-feedback have a substantial and formative role in galaxy evolution?
2. THESIS AIMS
•To what extent are AGN and galaxy properties related?
•Is there a sequence that links the blue color distribution (spirals) to the red color distribution (ellipticals)?
•How can a multi-wavelength approach help us solving these questions?
2.2 Aims and Methods
Given the high number of galaxies in the universe, one of the best ways to study these objects is to classify them according to their properties, and use a statistical approach to analyze how galaxies grow and evolve. My research focuses on the study of Ac- tive Galactic Nuclei and host galaxy properties in the radio and optical domains. The optical regime is very effective in tracing the host galaxies properties (color, morphol- ogy, mass, stellar content), while the radio regime is particularly useful for identifying AGNs. Moreover, observational evidence points towards a tight correlation between emission at optical and radio wavelengths. This indicates a possible common origin of the emission.
The main aim of my PhD project is to bridge the lack of extended multi-wavelength studies of galaxy properties and provide observational evidence to the latest models of galaxy evolution. My research includes my published studies on the correlation of AGN-detection rate with stellar mass of the host galaxies up toz∼1 (Chapter 4, see also 62), and investigations on the origin of the optical line emission in radio galaxies (Chapter 5, see also 73, 74). In particular, I study whether AGNs occur more fre- quently in massive and passive radio-bright hosts, consistently with a scenario where the AGN feedback stops the star formation. Also, the nature of AGNs, as classified in the optical-emission line diagnostic diagrams, is investigated with the goal of identifying the main source of line emission in Seyferts and LINERs. LINERs are mostly regarded as AGNs, although there is growing evidence that some of these objects are actually ionized by fast shocks and old stars, and not by the nucleus. This opens the doors to a new interpretation of the LINER phenomenon as the very last stage of galaxy evolution, starting after the AGN quenching of the star formation.
The multi-wavelength approach, i.e. the study of combined properties as inferred from data taken at different wavelengths, is crucial to unveil the evolution of galaxies over
2.2 Aims and Methods
the cosmic time. For these reasons, I have carried out a research program that makes use of new observations and archive radio data, combined with existing optical data.
Subsequently to the submission of a proposal for the use of the Effelsberg 100m ra- dio telescope, I have been granted 50h observing time to conduct a galaxy survey. I have measured continuum intensity and polarization of 150 radio emitters with optical (SDSS) counterpart. The collection of the Effelsberg data aims at probing galaxy evolu- tion in radio emitters that are classified as star-forming, composite, Seyfert and LINER galaxies in the optical emission-line diagnostic diagrams, by looking at their combined optical-radio properties. With this project, I search for a flattening of the radio spec- tral index along the composite-AGN sequence of the diagnostic diagrams (Chapter 6).
Flattening is expected due to the presence of compact nuclei, or jet emission. In par- ticular, I am interested in testing a scenario where the end of the star-forming phase of galaxies represents a turnover point in galaxy evolution, i.e. the start of the quasar phase, which leads to the color and morphological transformation of the hosts (transi- tion from spirals to ellipticals). The analysis of the spectral indexes, combined with the information on the radio morphology (low resolution, from FIRST survey at 20 cm), will help us to investigate the nature of the sources along the composite-AGN branch, their active state, and the chance to spot an evolutionary sequence .
2. THESIS AIMS
3
Data
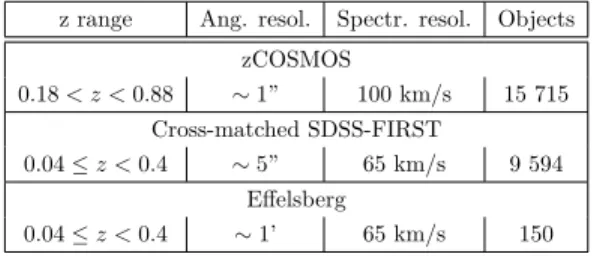
For the accomplishment of the thesis aims, I have worked with different optical and radio datasets. This chapter aims at giving a description of the surveys and the specifications of the datasets. Table 3.1 provides a summary of the data I used.
3.1 COSMOS and zCOSMOS surveys
The COSMOS survey (75) is a large Hubble Space Telescope (HST) Treasury project that covers∼2 deg2equatorial field with the Advanced Camera for Surveys (ACS). It usesI-band exposures down to faint magnitudes (IAB= 28, 75). The COSMOS field has been the object of extensive multi-wavelength ground- and space-based observations spanning the entire spectrum: X-ray, UV, optical/NIR, mid-infrared, mm/submillimeter, and radio, providing fluxes measured over 30 bands (76, 77, 78, 79, 80, 81, 82, 83, 84).
z range Ang. resol. Spectr. resol. Objects zCOSMOS
0.18< z <0.88 ∼1” 100 km/s 15 715 Cross-matched SDSS-FIRST
0.04≤z <0.4 ∼5” 65 km/s 9 594 Effelsberg
0.04≤z <0.4 ∼1’ 65 km/s 150
Table 3.1: Datasets summary. Col. 1: Redshift range. Col. 3 and 4: Angular and spectral resolution. Col. 4: Number of objects in the sample.
3. DATA
The zCOSMOS survey was planned to provide high-quality redshift information to the COSMOS field (79). It benefitted of∼600 h of observations at VLT using the VIMOS spectrograph and consists of two parts: zCOSMOS-bright and zCOSMOS-deep. The zCOSMOS-bright is purely magnitude-limited and covers the whole area of 1.7 deg2 of the COSMOS field. It provides redshifts for∼20 000 galaxies down toIAB.22.5 as measured from the HST-ACS imaging. The success rate in redshift measurements is very high, 95% in the redshift range 0.5< z < 0.8, and the velocity accuracy is
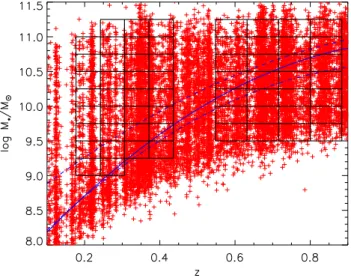
∼100 km s−1(85). Each observed object has been assigned a flag according to the reliability of its measured redshift. This work is based on the the zCOSMOS-bright survey final release: the so-called 20k sample, totaling 16 623 galaxies withz.2 and secure redshifts measurements with an actual reliability of 99%.
For objects brighter thanIAB= 22.5 and without secure spectroscopic redshift1, pho- tometric data from the COSMOS survey provide good-quality photometric redshifts2 (86). Based on a comparison with the zCOSMOS spectroscopic redshifts, Ilbert et al. (86) estimated an accuracy ofσzphot= 0.007×(1 +zs) for galaxies brighter than IAB= 22.5.
For all galaxies brighter thanIAB= 22.5, absolute rest-frame magnitudes and stellar masses were obtained using standard multi-color spectral energy distribution (SED) fit- ting techniques. SED fitting was performed using the secure spectroscopic redshift, if available, or the photometric one. Stellar masses were obtained using theHyperZmass code (87, 88), by assuming a Chabrier initial mass function (IMF)3(89). HyperZmass uses the SED fitting technique, computing the best SED fit by minimizing theχ2be- tween observed and model fluxes. When the redshift is known, the best SED fit and its normalization provide an estimate of the stellar mass contained in the observed galaxy.
More information on sample and mass completeness can be found in Vitale et al. (62).
3.1.1 Analyzed galaxy sample
For my analysis, I have used the Bright zCOSMOS spectroscopic catalog (v4.12 ver- sion). For AGN that are more luminous than the host galaxy, such as the type-1 AGN,
1Redshift inferred from spectral lines.
2The redshift determination technique uses photometry instead of spectra. Photometry is the brightness of the object viewed through various standard filters, each of which lets through a relatively broad spectrum of colors.
3Empirical function that describes the distribution of initial masses for a population of stars.