Research Collection
Journal Article
Novel fatigue strengthening solution for metallic structures
using adhesively bonded Fe-SMA strips: A proof of concept study
Author(s):
Wang, Wandong; Li, Lingzhen; Hosseini, Ardalan; Ghafoori, Elyas Publication Date:
2021-07
Permanent Link:
https://doi.org/10.3929/ethz-b-000477355
Originally published in:
International Journal of Fatigue 148, http://doi.org/10.1016/j.ijfatigue.2021.106237
Rights / License:
Creative Commons Attribution 4.0 International
This page was generated automatically upon download from the ETH Zurich Research Collection. For more information please consult the Terms of use.
International Journal of Fatigue 148 (2021) 106237
Available online 18 March 2021
0142-1123/© 2021 The Author(s). Published by Elsevier Ltd. This is an open access article under the CC BY license (http://creativecommons.org/licenses/by/4.0/).
Novel fatigue strengthening solution for metallic structures using adhesively bonded Fe-SMA strips: A proof of concept study
Wandong Wanga,*, Lingzhen Lia,b, Ardalan Hosseinic,d, Elyas Ghafooria,b
aStructural Engineering Research Laboratory, Swiss Federal Laboratories for Materials Science and Technology (Empa), 8600 Dübendorf, Switzerland
bInstitute of Structural Engineering, Department of Civil, Environmental and Geomatic Engineering, ETH-Zürich, 8093 Zürich, Switzerland
cSimpson Strong-Tie, Pleasanton, CA 94588, USA
dDepartment of Civil and Environmental Engineering, University of California, Davis, CA 95616, USA
A R T I C L E I N F O Keywords:
Fatigue strengthening Prestressing Fatigue crack growth Adhesive bonding
Fatigue crack growth life extension
A B S T R A C T
An innovative fatigue strengthening solution for metallic structures that takes advantage of the shape memory effect of an iron-based shape memory alloy (Fe-SMA) and the bridging mechanism offered by the bonding technique has been proposed and examined. Fatigue tests on cracked steel plates with bonded carbon fiber- reinforced polymer (CFRP) and nonprestressed and prestressed Fe-SMA strips were conducted. The experi- mental results demonstrate that the bonded prestressed Fe-SMA strips are much more effective than CFRP strips, extending the fatigue crack growth life by a factor of 3.51. The proposed innovative solution is highly effective in retarding fatigue crack growth in metallic structures.
1. Introduction
The sustainability of aging metallic structures suffering from cyclic loading is an issue faced by many industrial sectors, and efficient fatigue strengthening solutions are required to combat this issue. Fatigue cracks can initiate and propagate over time in metallic structures. The struc- tural failure of aging metallic structures because of fatigue fracture places lives and properties at risk. Many fatigue strengthening methods have been developed to combat this problem, such as riveted patch re- pairs [1], bonded fiber-reinforced polymer (FRP) repairs [1-3], pre- stressed but not bonded reinforcements [4,5] and prestressed and bonded reinforcements [6,7]. A common feature of these solutions is that external strengthening elements are attached to cracked parent structures to add a second load path. The added load path reduces the load transferred by the cracked parent structures, thus reducing the fa- tigue crack growth.
Among the developed fatigue strengthening solutions, the pre- stressed solutions, either bonded or unbonded, have been proven to be highly efficient and promising for extending the service life [8,9]. Zheng et al. [10] showed that the fatigue life of an unreinforced specimen with a crack can be increased by a factor of eight times by bonding a carbon FRP (CFRP) patch, and by 26.4 times by bonding a CFRP patch con- taining shape memory alloy (SMA) wires at a stress level of 155 MPa.
With an adequately high level of prestressing, the crack driving force can be reduced below the fatigue threshold, and a complete crack arrest can be achieved [11,12].
Nevertheless, the prestressing process of reinforcement elements, typically CFRP strips, is time-and labor-intensive. Heavy hydraulic jacks are normally employed to prestress CFRP strips when they are anchored to parent structures. Dedicated mechanical clamps are normally devel- oped to anchor prestressed CFRP strips to the parent structure. Adhesive bonding is not normally used for prestressed CFRP reinforcements because the release of prestress force results in a high stress concen- tration at the tip of the bonded patch and thus a low load capacity of the bonded joint [13]. Premature debonding can occur in such cases.
Consequently, the application of the prestressed reinforcing solution is mainly limited to rigid civil engineering structures.
Bonded and prestressed repairs are not unattainable. To avoid pre- mature debonding at the patch tip, the prestressing effect in such a so- lution has been achieved by taking advantage of smart SMA wires embedded in FRP [6,10,14,15]. The merits of this solution are derived from the added load path, beneficial prestressing effect, and bonding technique. A prestressed repair patch that is attached to the cracked detail of a parent structure generates compressive stresses surrounding the detail, in addition to the extra layer of material that acts as an additional load path [7-9,16-18]. Both the added load path and the
* Corresponding author.
E-mail addresses: wandong.wang@empa.ch (W. Wang), lingzhen.li@empa.ch (L. Li), ahosseini@strongtie.com (A. Hosseini), Elyas.Ghafoori@empa.ch (E. Ghafoori).
Contents lists available at ScienceDirect
International Journal of Fatigue
journal homepage: www.elsevier.com/locate/ijfatigue
https://doi.org/10.1016/j.ijfatigue.2021.106237
Received 31 January 2021; Received in revised form 10 March 2021; Accepted 11 March 2021
generated compressive stresses reduce the stress experienced by the crack tip and hence the crack driving force [19,20]. Adhesive bonding eliminates the need for hole drilling, which is required for mechanical fastening and thus discrete stress concentrations, rendering a more uniform and well-distributed load transfer between the parent structure and the repair patch. Bonding is preferred in terms of fatigue strength- ening. In addition, adhesive bonding offers a bridging mechanism under which the intact reinforcement bonding restrains the crack opening in the parent structure and significantly reduces the stress singularity at the crack tip [21]. The effect of the bridging mechanism on the retardation of fatigue crack growth is best exemplified by stable and slow fatigue crack growth in fiber metal laminates [21-23]. Nevertheless, it is time- consuming to hybridize SMA wires with FRP, and the commonly used SMA wires are NiTi-based wires, which are expensive, thereby hindering their applications for fatigue mitigation.
To ease the difficulties associated with the prestressed solution for the fatigue reinforcement of metallic structures, an Fe-17Mn-5Si-10Cr- 4Ni-1(V,C) (mass%) SMA was recently developed at Swiss Federal Laboratories for Materials Science and Technology (Empa) [24]. The Empa iron-based SMA (Fe-SMA) exhibits a shape memory effect (SME) that can generate high recovery stresses relative to its strength. A stretched Fe-SMA member tries to recover its original shape upon heating, followed by cooling to the ambient temperature. Tensile stresses of 360 MPa can be generated in the Fe-SMA member when its deformation is constrained during the activation process [25]. This feature is highly desirable for prestressing applications. The combina- tion of the excellent mechanical properties and low cost of the Fe-SMA (relative to that of NiTi- and Cu-based SMA wires), easier installation, and simpler prestressing process (compared with prestressed CFRP
reinforcements) makes this alloy particularly attractive for applications as a prestressing element for the fatigue strengthening of aging metallic structures in different sections. In addition, Ghafoori et al. conducted high-cycle fatigue (HCF) tests on Fe-SMA specimens to investigate the fatigue resistance of Fe-SMA [26]. The HCF test results were analyzed using the constant life diagram technique, leading to a criterion for fa- tigue design of the Fe-SMA reinforcements under HCF loading regimes [26]. This has been substantiated by experimental results from several test campaigns [17,27,28].
The application of Fe-SMA reinforcements circumvents many chal- lenges imposed by traditional prestressing methods. It is evident, based on the preceding review of fatigue strengthening methods, that a bonded prestressed fatigue strengthening solution utilizing the Fe-SMA is highly desirable. An adhesively bonded prestressed Fe-SMA solution is prefer- able to the mechanical joining solution, as bonding overcomes the problem of low fatigue resistance associated with holes required for mechanical joining. However, only mechanical anchorage systems have been developed and studied for externally attaching prestressed Fe- SMAs to parent metallic structures, which is currently the state-of-the- art joining technique [17,27,28]. This is due to the lack of understand- ing of the bonded behavior of the Fe-SMA joints. A recent study con- ducted by the present authors fills the knowledge gap in the bonding techniques and failure behavior of bonded Fe-SMA joints [29].
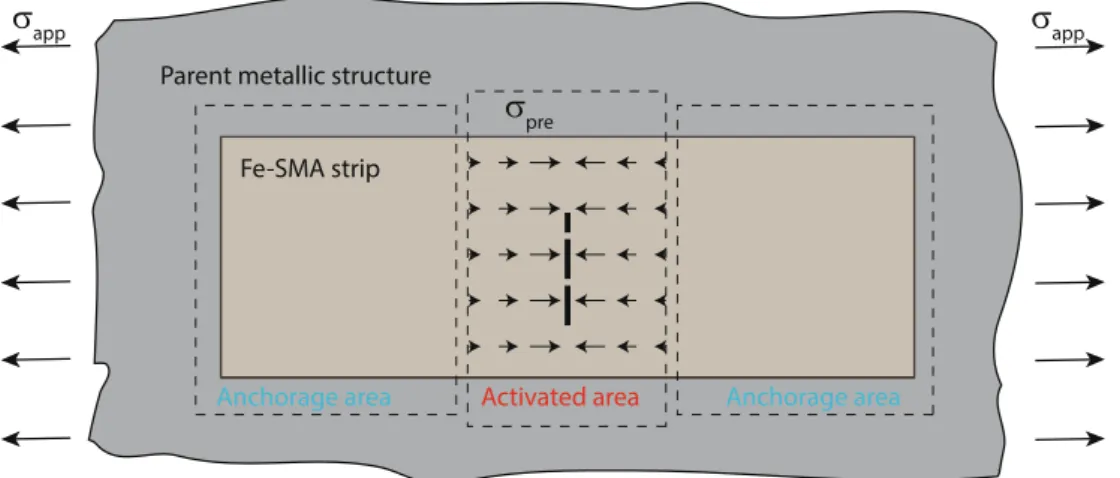
The aim of this study is to propose and develop a novel bonded prestressed fatigue strengthening solution using the Fe-SMA for cracked metallic structures. The effect of such a solution on fatigue retardation is presented. An experimental campaign was carried out to substantiate that the bonded prestressed Fe-SMA patch is achievable and such a so- lution is highly efficient for fatigue life extension of fatigue-cracked Fig. 1.Schematic illustration of the novel fatigue strengthening method.
Fig. 2. Schematics of the behavior of a Fe-SMA strengthening member. (a) Stress–strain behavior. (b) Stress–temperature behavior.
metallic structures.
2. Novel fatigue strengthening technique using the Fe-SMA This work presents a novel fatigue strengthening solution in which the adhesive bonding technique is used to join Fe-SMA reinforcements to metallic structures with the effect of beneficial prestressing. The mechanisms of such a fatigue strengthening solution are detailed in this section. As shown in Fig. 1, a prestrained Fe-SMA strip is adhesively bonded to strengthen a metallic parent structure containing a mode I crack. The Fe-SMA strip must be prestrained first and bonded to the metallic parent structure at ambient room temperature. Only the middle portion of the strip, illustrated as the activated area in Fig. 1, is fully activated by subjecting it to a high activation temperature up to approximately 160 ◦C to induce compressive stresses in the parent structure. There is a transition area between the activated area and anchorage area because of heat transfer during the activation process.
The anchorage area schematically shown in Fig. 1 should have a tem- perature lower than Tg of the adhesive used during the activation pro- cess to prevent adhesive softening and relaxation of the prestressing in the Fe-SMA [29].
For clarity, an overview of the behavior of the Fe-SMA during pre- stressed strengthening is also provided. Fig. 2 schematically depicts the stress–strain and stress–temperature behaviors of the alloy during the prestraining, activation, and loading processes.
The austenite phase, γ, is stable in the unloaded Fe-SMA at ambient temperature T0. Before it is bonded, the material is prestrained to εpre
and then unloaded completely at T0, as shown by path 1 and path 2 in Fig. 2(a). A permanent strain, εr, is observed owing to the forward austenite-to-martensite (γ → ε) transformation, and some irreversible plasticity resulting from the loading process indicated by path 1 [26].
The nonlinearity in path 2 (during unloading) is largely due to the reverse (ε → γ) phase transformation [30].
Subsequently, an activation process is carried out after the Fe-SMA joint is cured, as shown in Fig. 1. The middle portion of the Fe-SMA strip is heated to an activation temperature Th, as shown by path 3, and cooled to T0, as displayed by path 4 in Fig. 2. Meanwhile, the strain of the Fe-SMA is constrained by the metallic parent structure. The hin- dered strain recovery of the Fe-SMA leads to the development of a tensile stress (the so-called prestressing) in the Fe-SMA element (see paths 3 and 4 in Fig. 2(a) and (b)). The prestressing applies compressive stresses to the parent structure. The generation of stress recovery in the Fe-SMA for elastic restraint conditions with various compliances has been studied and reported in [31]. Path 5 in Fig. 2 denotes the stress in the Fe-SMA when the parent structure is subjected to external loading.
The features in Fig. 2(b) are worth highlighting. The initial slight decrease in stress in path 3 at the beginning of the heating process in- dicates that thermal expansion primarily controls the SME during this period. Nonetheless, the ε → γ phase transformation accelerates and suppresses the thermal expansion effect once the temperature is higher than the austenite-start temperature,As. Consequently, tensile stresses are generated in the Fe-SMA member. The As and Af lines in Fig. 2(b) denote the start and finish temperatures of the austenitic phase trans- formation, respectively, which depend on the stress level [24,32]. By the end of the cooling process, the nonlinearity in path 4 is due to the development of new martensite at larger stress levels. When the recov- ery stress surpasses the stress limit for the martensitic transformation as the temperature decreases to T0, new martensite develops and decreases the recovery stress [26].
This procedure is proposed to achieve a high prestressing level without jeopardizing the integrity of the adhesive joint. The curing of the adhesive joint at room temperature avoids prestressing loss with respect to an elevated temperature curing. In this case, the reverse phase transformation already starts during the curing of the adhesive without the deformation of the Fe-SMA being restrained, thereby resulting in the
loss of prestressing. Only the middle portion of the Fe-SMA strip over the crack is subjected to an elevated temperature to be activated after the adhesive joint is cured. As schematically shown in Fig. 1, the activated area of the middle portion is distinguished from the two anchorage areas at both ends, which are not activated. Beneficial compressive stresses are generated during the activation of the middle portion, whereas the anchorage areas are not heated and restrain the deformation of the Fe- SMA. It is critical not to activate the anchorage areas and induce high prestressing stresses because these stresses further load the adhesive layer in addition to the mechanical load transfer between the parent structure and the Fe-SMA strip. The heat transfer between the activated area and the anchorage area can occur, but the temperature over the anchorage area should be kept well lower than the glass transition temperature, Tg, of the adhesive used.
3. Experimental procedures
An experiment campaign was carried out to investigate the feasi- bility of the proposed solution and the effect of bonded prestressed Fe- SMA reinforcements on the fatigue crack growth life extension. This section presents a detailed description of specimen configurations, test matrix, mechanical properties of the materials, and fatigue test procedure.
3.1. Specimen configuration and test matrix
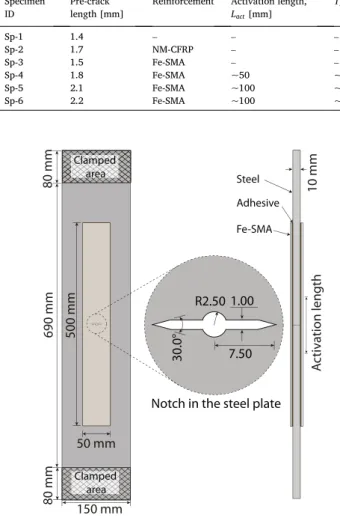
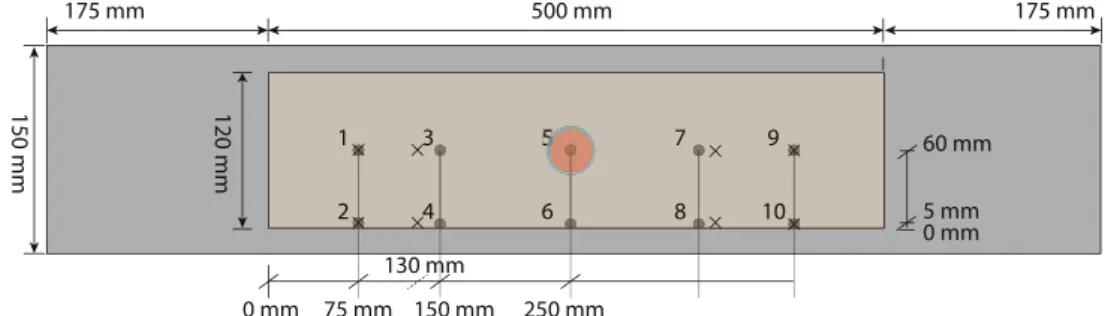
A series of fatigue tests on unstrengthened and strengthened steel Fig. 3.Specimen configuration for fatigue testing.
Table 1 Test matrix.
Specimen
ID Pre-crack
length [mm] Reinforcement Activation length,
Lact [mm] Th[◦C]
Sp-1 1.4 – – –
Sp-2 1.7 NM-CFRP – –
Sp-3 1.5 Fe-SMA – –
Sp-4 1.8 Fe-SMA ~50 ~160
Sp-5 2.1 Fe-SMA ~100 ~160
Sp-6 2.2 Fe-SMA ~100 ~160
plates was performed to demonstrate the efficiency of the proposed solution on the fatigue crack growth life extension. Table 1 summarizes the test matrix. In total, six specimens were tested. The middle tension M (T) specimen configuration, shown in Fig. 3, was adopted in this test campaign.
As shown in Table 1, the test matrix consists of steel specimens with different types of reinforcements. The steel specimens were from the same batch in order to minimize fatigue scatter. A bare steel plate, specimen Sp-1, was tested to obtain the reference data of the crack growth behavior of the steel plate. As the same M(T) specimen config- uration was tested under the same fatigue loading in a previous study [11], the test data obtained in the previous study is used for Sp-1 in this research work. It is of interest to compare the fatigue life extension ef- ficiency using activated Fe-SMA to that using normal modulus CFRP (NM-CFRP) and non-activated Fe-SMA. For specimens Sp-2 and Sp-3, NM-CFRP and non-activated Fe-SMA strips were used as re- inforcements, respectively. The middle portions of the Fe-SMA strips on both sides were activated after bonding for Sp-4, Sp-5, and Sp-6. Based on a preliminary finite element (FE) study, as detailed in Section 4, two activation lengths were examined in this test matrix. As can be seen from Table 1, Sp-4 has an activation length of approximately 50 mm, whereas Sp-5 and Sp-6 have an activation length of approximately 100 mm. The activation method is detailed in Section 3.3. Unlike the activation pro- cess for Sp-4 and Sp-5, two activation processes were implemented for Sp-6. A 50 mm activation length was achieved first, and a second acti- vation process was implemented to expand the activation length to 100 mm. The adopted middle tension M(T) specimen configuration is sche- matically illustrated in Fig. 3. The reinforcement strips were bonded on both sides of the steel plate to eliminate the effects of secondary bending on the fatigue crack growth behavior. The dimensions of the steel plate and reinforcement strip are also presented in Fig. 3. The central through thickness notch was cut using electrical discharge machining, and its size is provided in the close-up of Fig. 3. The final Fe-SMA strip with the dimensions shown in Fig. 3 was first cut out from a big coil and then milled to the exact size with cooling refrigerant. A brief description of the industrial production process of the Fe-SMA material is provided in Ref [33].
To further minimize the fatigue scatter, fatigue precracking was conducted for each specimen before bonding the reinforcement strips to induce a sharp crack tip and exclude effects of the starter notch, ac- cording to the ASTM standard [34]. Previous studies have shown that the majority of fatigue scatter originates from the crack initiation phase instead of the crack propagation phase and the scatter in fatigue crack growth data of the used steel plates is really low [12,35]. The pre- cracking of all the specimens should minimize the fatigue scatter asso- ciated with the fatigue behavior of the used steel plates. The procedure of precracking is detailed in Section 3.4.
The adhesive Sika1277 was chosen to bond the NM-CFRP and Fe- SMA strips to the steel plates. The curing process was performed at a controlled temperature of 23 ±0.5 ◦C in a climate room at Empa. Before bonding, the surfaces of the substrates were carefully prepared. The surface of the NM-CFRP was cleaned using a white cloth soaked with acetone. For the surfaces of the steel plate and Fe-SMA strips, they were first cleaned with acetone and then grit-blasted using 0.15–0.21 mm aluminum oxide at a pressure of 8 bar. The cleaning process was repeated after grit-blasting. The destructive tests performed on Fe-SMA- to-steel joints revealed that the cohesive failure mode was achieved with such a surface preparation procedure for bonding the Fe-SMA and steel using Sika1277 [29].
The length of the Fe-SMA strips was determined based on the lap- shear test results of another experiment study [29]. The results of the lap-shear test show that the effective bond length is approximately 115 mm. The anchorage length of the tested specimen was designed to be slightly larger than 1.5 times the effective bond length.
3.2. Material properties
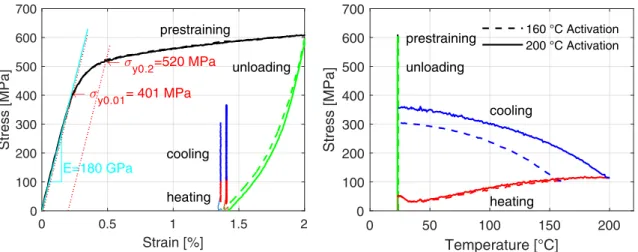
The mechanical properties of the materials used are detailed in this section. Table 2 summarizes the properties of interest for the steel, NM- CFRP, Fe-SMA, and adhesive used. The steel plate was of grade S355J2 +N. As can be seen from Table 2, the CFRP has a Young’s modulus and thickness close to those of the Fe-SMA. The stiffness added to the steel plate for these two materials is comparable. The mechanical properties of the Fe-SMA are obtained from the uniaxial tensile response reported in Fig. 4(a). The strain rate for the prestraining part in Fig. 4(a) was 0.15%/s. It is noteworthy that the nonlinearity of the tensile behavior of the Fe-SMA starts when the strain values are smaller than 0.2%, owing to the forward phase transformation under loading. Consequently, the standard 0.01% yield strength, σy0.01, instead of σy0.2, is reported as the yield strength for the Fe-SMA. The Young’s modulus of 187 GPa re- ported in Table 2 is determined based on the slope of the stress–strain curve up to a strain value of 0.1%. The reported Young’s modulus and yield strength values in this study may slightly differ from other reported values [26]; the difference is attributed to the materials tested from different batches.
The mechanical behavior of the Fe-SMA is of special interest. Its mechanical behavior, stress–strain and stress–temperature relations, when subjected to mechanical loading followed by thermal activation, are shown in Fig. 4. Two activation temperatures, 160 and 200 ◦C, were adopted to demonstrate the effect of activation temperature on the re- covery stress level. As can be seen from Fig. 4, the final recovery stress for the activation temperature of 200 ◦C is higher than that at 160 ◦C. It is worth noting that a stress of 50 MPa was applied after the complete unloading of the prestrained Fe-SMA coupon to avoid compressive stresses owing to thermal expansion at the beginning of the activation process. The data shown in Fig. 4 are under the condition that the strain of the Fe-SMA coupon was kept constant during the activation process.
For the activation of the Fe-SMA strips bonded to the steel plates, the strain of the Fe-SMA cannot be kept constant as a result of the compli- ance of the steel plate, which results in a small reduction in the recovery stresses in the Fe-SMA. The reduction depends on the compliance of the parent structure [31].
3.3. Activation of the Fe-SMA
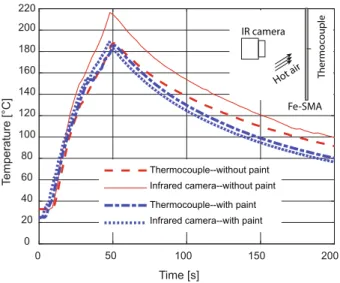
The middle portion of the prestrained Fe-SMA must be activated to generate beneficial prestressing forces. This section describes the acti- vation procedure. A heat gun (model: Steinel HG2320E) was used to manually apply heating to the Fe-SMA strip. This heating method was selected to mimic an easy on-site activation process. The temperature of the hot air reached 600 ◦C first, and the airflow was directed at the Fe- SMA surface to apply heat. An infrared camera (model: Testo 885) was employed to monitor the temperature at the surface of the Fe-SMA strip.
As shown in Fig. 5(a), a spectrum of colors represents the temperature distribution on the Fe-SMA during activation, and the green color was Table 2
Mechanical properties of materials used.
Steel [11] Fe-
SMA NM-CFRP
[11] Sika1277
[36]
Tensile Young’s modulus,E
[GPa] 205 187a 156 2
Yield strength, σy [MPa] 421 345b – –
Tensile strength [MPa] 526 1000 2800 30
Thickness, t [mm] 10 1.5 1.4 –
Glass transition
temperature,Tg [◦C] – – – 67
a The reported Young’s modulus is for strain values up to 0.1%.
b The reported yield strength of the Fe-SMA is the standard 0.01% yield strength.
set to indicate a temperature range of 160–175 ◦C. For the accuracy setting of the infrared camera, please see Appendix A.
The activation area was heated step by step using the scanning strategy schematically shown in Fig. 5(b). The heat gun was pointed at one specific area on the Fe-SMA surface until the color on the thermal image of this area turned green. The same procedure was implemented to heat the area next to it until the entire area to be activated had been scanned. It is noteworthy that the hot air was directed to heat the Fe-
SMA to the target temperature within the activated length only. The neighboring Fe-SMA outside the activated length was also heated due to heat transfer; however, the temperature was lower than the target temperature and it was deemed that the Fe-SMA was not fully activated.
The middle sections of the Fe-SMA strips on both sides of the steel plate were activated consecutively. Marks were made on the surfaces of Fig. 6.Setup of a specimen with dimensions provided in Fig. 3tested on a 500 kN fatigue testing machine.
Fig. 5. Activation of the Fe-SMA strip. (a) Temperature measurement using an infrared camera. (b) Heating of the Fe-SMA using a manual scanning strategy.
Fig. 4.Experimentally obtained stress–strain and stress–temperature diagrams for the Fe-SMA subjected to mechanical loading and temperature.
the Fe-SMA strips to ensure the areas activated and the prestressing forces on both sides were set as symmetrically as possible. The flexural and compressive deformations of the steel plate resulting from the prestressing forces induced by the sequential activation of the Fe-SMA reinforcements were not restrained during the activation process.
The accuracy of the temperature measurement using the infrared camera is discussed in Appendix A, while the temperature distribution in the bonded joint when the middle portion of the Fe-SMA is heated up to 160 ◦C is discussed in detail in Appendix B for brevity. It is highlighted that this temperature measurement method is feasible with high accu- racy, and the temperature in the adhesive over the anchorage area could be kept well below its Tg. Readers are referred to Appendix A and Ap- pendix B for more information. It is critical to ensure that a temperature below Tg is maintained in the adhesive over anchorage areas. Thus, adhesive softening and associated prestressing losses can be avoided. In addition, no extra stresses are induced in the bond line over the anchorage areas, as the Fe-SMA is not activated.
3.4. Fatigue test setup
Fatigue tests were carried out on a computer-controlled servo hy- draulic fatigue testing machine (walter +bai testing frame, Type LFV 500-HH) with a 500 kN load cell (model: GTM DR-F 500kN) and wedge grips. Fig. 6 shows the fatigue test setup. The two ends of the steel plate were clamped by wedge grips to apply constant amplitude fatigue loading (see Fig. 3 for detailed dimensions of the specimen size and clamped areas).
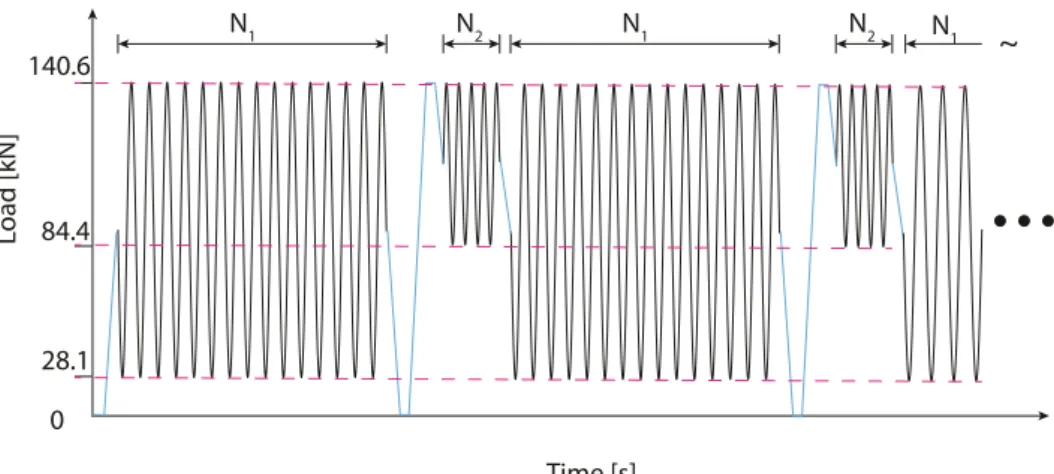
Fig. 7 shows the fatigue loading used for fatigue testing, which was implemented under load control. The minimum and maximum forces of the cyclic loading are 28.1 and 140.6 kN, respectively. This corresponds to a fatigue stress ratio of R=0.2. A frequency of 10 Hz was adopted for the fatigue testing. The beach marking technique was adopted to leave marks of the crack frontier on the crack flanks at specific fatigue lives to analyze the fatigue crack growth behavior. The location of the crack tip and thus the crack length with a known fatigue life can be measured on the fracture surface of the specimen [11]. The beach marking was ach- ieved by increasing R from 0.2 to 0.6 of the fatigue loading while maintaining the same maximum load, leading to a minimum load level of 84.4 kN for the beach marking cycles. N1 cycles of fatigue loading for fatigue crack propagation are followed byN2 cycles of beach marking loading until the specimen fails. The values for N1 and N2 in this test campaign are 50,000 and 25,000, respectively. It is noteworthy that the fatigue life solely corresponds to the cycles of fatigue loading with R=
0.2.
The same fatigue loading was also used to precrack all bare steel plates before bonding enforcements. N1 and N2cycles were repeated four times to obtain a precrack length of approximately 1.5 mm with a sharp
crack tip in the steel plate. The detailed precrack lengths for all tested specimens are provided in Table 1. The pre-crack length ranges from 1.4 mm to 2.2 mm because of the scatter in the crack initiation phase. It is ideal to have the same pre-crack lengths for all the specimens; however, it requires more time and effort to do so. The main difficulties are associated with the monitoring of the growth of a sub-millimeter fatigue crack. Most importantly, the difference in the pre-crack lengths sum- marized in Table 1 has a negligible impact on the total fatigue crack growth life. The fatigue crack growth life and a–N curves reported in Section 5 do not include the 200,000 cycles used for precracking.
4. Simplified analysis of compressive stresses in steel plate It is beneficial to understand the compressive stress distribution in a steel plate reinforced by prestressed Fe-SMA strips. The concept of prestressing is easy to understand, but the load transfer between the Fe- SMA and the steel plate is extremely difficult to capture. The tensile stresses in the Fe-SMA strips and the stiffness of the adhesive change simultaneously as the temperature varies during the activation process.
Analyzing such a multiphysical problem is beyond the scope of this study; however, it is argued that the compressive stress levels in the steel plate after activation should be bounded by the predicted results of two extreme conditions of the adhesive during activation: (1) assuming 100% softening of the adhesive, and (2) assuming 0% softening of the adhesive. Finite element modeling (FEM) was employed to analyze the two cases using the commercial FE package ABAQUS 6.16.
The specimen configuration illustrated in Fig. 3 was modeled in ABAQUS using C3D8R elements for the steel plate, adhesive, and Fe- SMA strips [37]. The crack details in the steel plate were not modeled because the compressive compliance of the steel plate was negligibly affected by the crack. A coarse mesh size of 5 mm was used because no singularity problems or stress concentration were involved in the FEM analysis. The relative motion between the surfaces of the Fe-SMA strips, steel plate, and adhesive layers for the bonded area was eliminated by using the tie constraint to model the bond in the specimen. The me- chanical properties reported in Table 2 were used to define the material properties of the respective materials, except for the adhesive layers over the activation length. The original modulus of 2 GPa of the adhesive was used for the case assuming 0% softening of the adhesive during activation, and a modulus of 1 MPa was used for another case assuming 100% softening.
The prestressing in the Fe-SMA strip was simulated using a reduced temperature field of the Fe-SMA strip over the activation length. A prestressing level of 320 MPa in the Fe-SMA was achieved by defining a temperature change of − 320 K. An artificial thermal expansion coeffi- cient of 5.348 ×10⁻⁶ /K was prescribed for the Fe-SMA in the longi- tudinal direction only, such that the temperature change could result in
Time [s]
N1 N2
Load [kN]
N1 N2 N1 ~
0 28.1 84.4 140.6
Fig. 7. Illustration of fatigue loading spectrum incorporating beach marking technique.
a thermal strain that leads to the prestressing stress. The prestressing level is an approximation of the values measured in this study and a similar study [5]. To gain a better understanding of the effect of the activation length on the compressive stress distributions, four activation lengths (Lactof 50, 100, 150, and 200 mm) were simulated for the two extreme cases.
Fig. 8 shows the compressive stress distributions in the steel plate for the case of assuming 0% softening of the adhesive for Lact of 50, 100,
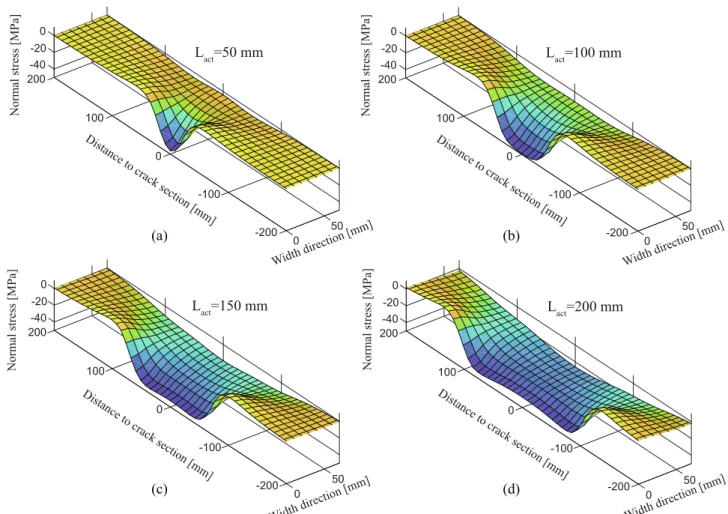
150, and 200 mm. Because the stress distribution is symmetric with respect to the central longitudinal axis of the steel plate, only half of it is shown. It is observed from Fig. 8 that the highest values of the compressive stresses achieved in the steel plate for different activation lengths are approximately the same, whereas the area of the steel plate under compression becomes longer and wider as the activation length increases. Another observation is that the highest compressive stresses are along the central longitudinal axis of the steel plate. A more in-depth analysis of the simulation results is provided in the following section.
Fig. 8.Compressive stress distributions in the steel plate for the case of 0% softening of adhesive for four Lact values. (a) Lact=50 mm, (b) Lact =100mm, (c) Lact = 150mm and (d) Lact=200 mm.
-50 -50 -40 -40 -30 -30 -20 -20 -10 -10 0 0 10 10
L L tca ta = 50 mc = 50 mmm
L
L tca tac==110000mmmm L
L tca tac==115500mmmm L
L tca tac==220000mmmm
-300
-300 -200-200 -100-100 00 100100 200200 300300 Distance to the cracked section [mm]
Distance to the cracked section [mm]
-50 -50 -40 -40 -30 -30 -20 -20 -10 -10 0 0 10 10
Normal stress in the center line [MPa]Normal stress in the center line [MPa]
(a)
(b)
cracked section
Fig. 9. Normal stresses along the central longitudinal axis of the steel plate for four activation lengths. (a) Assuming 100% softening of adhesive, and (b) assuming 0% softening of adhesive.
-50 -50 -40 -40 -30 -30 -20 -20 -10 -10 0 0
L L tca ta = 50 mc = 50 mmm
L
L tca tac==110000mmmm L tcLa tac==115500mmmm L
L tca tac==220000mmmm measured stressmeasured stress
-80
-80 -60-60 -40-40 -20-20 8080
Distance to the center line [mm]
Distance to the center line [mm]
-50 -50 -40 -40 -30 -30 -20 -20 -10 -10 0 0
20
20 4040 60 60 0
0
Normal stress in the crack section [MPa]Normal stress in the crack section [MPa]
(a)
(b)
center line
Fig. 10.Compressive stress distribution in the cracked section. (a) Assuming 100% softening of adhesive, and (b) assuming 0% softening of adhesive.
Fig. 9 depicts the stress distribution along the central longitudinal axis of the steel plate for all simulated cases. The length of the steel plate under compression in both cases of 100% softening and 0% softening increases as with Lact. For the case of 100% softening (see Fig. 9(a)), the compressive stress in the middle of the activation length, that is, the cracked section, is not the highest. Its value is approximately − 24 MPa for the four activation lengths. For the case of 0% softening (see Fig. 9 (b)), the compressive stress at the cracked section increases as the activation length increases from 50 to 100 mm; however, it decreases for longer activation lengths of 150 and 200 mm. A maximum compressive stress of approximately − 40 MPa can be achieved for Lact=100mm.
The simulation results for the two extreme conditions of the adhesive layer show that the stiffness of the adhesive layer during activation af- fects the load transfer between the Fe-SMA and the steel plate, indicating that an adhesive with a Tg higher than the activation temperature in- creases the compressive stresses in the steel plate.
The compressive stress distributions in the width direction at the cracked section are of significant interest, as depicted in Fig. 10. As can be seen from Fig. 10 (a), the compressive stresses in the middle of the steel plate remain the same for all simulated activation lengths. How- ever, the compressive stresses close to the free edge of the steel plate increase with Lact. As can be seen from Fig. 10 (b), for the case of 0%
softening of the adhesive, the compressive stress in the middle is the highest for all Lact values. The compressive stress close to the edge of the plate is higher for longer Lact. The compressive stresses forLact =100mm are the highest from the middle of the plate to approximately 40 mm.
This is the region where a short crack propagates. The crack growth rate of a short crack is slower and the corresponding fatigue crack growth life is longer than that of a long crack [14 11]. Obtaining higher compressive stresses for this region is therefore more effective for the fatigue life extension.
The simulation results were also compared to experimental mea- surements. Four strain gauges (Type: 1–LY66–6/120, HBM AG, Ger- many) were mounted on one surface of the steel plate of specimen 5 to measure the strains after activation of the Fe-SMA strips. The four strain gauges were mounted on the cracked section, symmetrically aligned 65 and 40 mm away from the middle of the steel plate. The average compressive stress values calculated based on the measured strains are plotted in Fig. 10. The simulation results agree well with the measure- ment at the distance of 65 mm for both simulated conditions of the adhesive. The simulation result for the case of the 100% softening agrees well with the measurement at the distance of 40 mm. The correlation indicates that the real development of the compressive stresses in the steel plate is more represented by the simulated case of 100% softening of the adhesive during activation. This is somewhat expected, because most of the prestressing in the Fe-SMA is developed at a temperature higher than the glass transition temperature, Tg =67◦C, of the adhesive used.
5. Results
5.1. Fatigue test results
This section summarizes the results of the fatigue tests. The fatigue crack growth life results of the tested specimens are provided in Table 3.
The life extension ratios of the fatigue lives of specimens with different reinforcements to that of Sp-1 without any reinforcements are also lis- ted. As can be seen, a life extension ratio as large as 3.51 can be obtained using the proposed system, which is twice the life extension ratio ob- tained with the bonded NM-CFRP. The fatigue life extension ratios of Sp- 4, Sp-5, and Sp-6 were consistently higher than those of Sp-3, confirming the beneficial effects of prestressing on the fatigue life extension. The results of Sp-4, Sp-5, and Sp-6 confirm that the activation length of 100 mm is superior to the activation length of 50 mm in terms of obtaining a higher level of prestressing in the system and thus a higher fatigue life extension ratio. The fatigue crack growth life of Sp-6 was increased by 24.5% compared to Sp-4 with Lact =50mm and by 34.7% compared to Sp-3 without activation. The scatter in the fatigue life results of Sp-5 and Sp-6 may originate from the difference in the activation processes and activation temperatures of the two specimens.
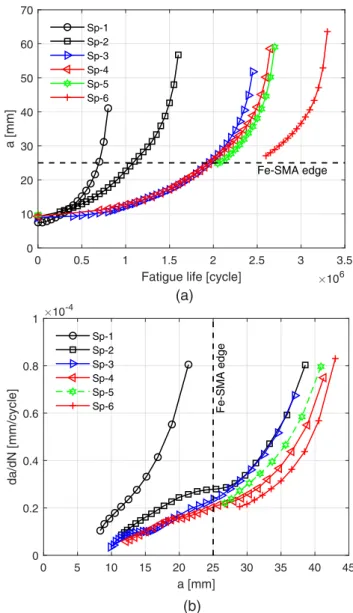
The a–N curves and crack growth rate curves of all the tested spec- imens are plotted and compared in Fig. 11. The crack length was ob- tained using the beach marking technique, as explained in Section 3.4, and a typical image of the crack surface with beach marks is shown in Fig. 12. After fatigue testing, quasi-static tests were performed to detach the bonded reinforcements and expose the cross-section of the crack surface with beach marks. Images of the crack surface were captured and post-processed with the ImageJ software package to measure the half-
0 0.5 1 1.5 2 2.5 3 3.5
Fatigue life [cycle] 106 0
10 20 30 40 50 60 70
a [mm]
Fe-SMA edge Sp-1
Sp-2 Sp-3 Sp-4 Sp-5 Sp-6
0 5 10 15 20 25 30 35 40 45
a [mm]
0 0.2 0.4 0.6 0.8 1
da/dN [mm/cycle]
10-4
Fe-SMA edge
Sp-1 Sp-2 Sp-3 Sp-4 Sp-5 Sp-6
(a)
(b)
Fig. 11.Fatigue crack growth behaviors of tested specimens. (a) Comparison of a–N curves, (b) Comparison of da/dN–a curves.
Table 3
Summary of fatigue life results.
Specimen ID Fatigue crack growth life [×106 cycle] Life extension ratio
Sp-1 0.94 –
Sp-2 1.60 1.70
Sp-3 2.45 2.61
Sp-4 2.65 2.82
Sp-5 2.70 2.87
Sp-6 3.30 3.51
crack length a for a corresponding fatigue life. The seven-point poly- nomial method was used to obtain the crack growth rates of all the tested specimens according to the ASTM standard [34]. For Sp-5 and Sp-6, the beach marks for the crack length under the prestressed Fe-SMA are almost invisible. Only the crack lengths for the crack tip beyond the Fe- SMA strip edge could be recorded.
As can be seen from Fig. 11, the crack growth is rapid in Sp-1, as this monolithic steel plate does not have any reinforcements. Compared to the crack growth behavior in the bare steel plate, the a–N curves of the remaining specimens show the effects of the added load path and pre- stressing on the fatigue crack growth retardation. For specimen Sp-2 with bonded NM-CFRP strips and specimen Sp-3 with bonded but non- activated Fe-SMAs, the added load path and the bridging mechanism retard the fatigue crack growth. Nevertheless, an obvious difference can be observed in the two a–N curves and the crack growth rate curves of the two specimens. The bonded Fe-SMA strips without prestressing are much more effective in retarding the fatigue crack growth in the steel plate than the NM-CFRP, although the mechanical and geometric properties of the two materials are very similar (see Table 2). The dif- ference is attributed to the difference in the bridging mechanisms of the two specimens, with Sp-3 having a much smaller debonding size, which will be discussed in the subsequent section. A smaller debonding size indicates higher bridging stresses and thus a slower crack growth rate, as shown in Fig. 11(b). The crack growth rate curves of Sp-2 and Sp-3 overlap for crack lengths beyond the Fe-SMA strip, where the crack growth retardation effect of the bridging mechanism becomes negligible.
The curves of Sp-4, Sp-5, and Sp-6 in Fig. 11 demonstrate that the prestressing induced by activating bonded Fe-SMA reinforcements is highly desirable. Compared to the a–N curve and crack growth rate curve of Sp-3, the crack growth is further retarded in the activated cases, as expected. Sp-6 has the highest fatigue life extension in this test. The results also prove that a longer activation length offers a higher pre- stressing level in the system. As can be seen from Fig. 11(b), the crack growth rates for specimens with activated Fe-SMA strips are lower than those of Sp-2 and Sp-3 for crack lengths beyond the Fe-SMA strip edge.
This is attributed to the compressive stresses generated in the steel plate.
Nevertheless, the scatter in the results of these three specimens reveals that the fatigue life extension obtained using the proposed method is
sensitive to the activation process.
Further investigation is needed to fully understand the dependence of the prestressing level on the activation process. More fatigue tests on steel plates with bonded and activated Fe-SMA strips must be repeated to analyze the scatter observed in this test results. As shown in Fig. 4, the prestressing level is sensitive to the activation temperature. Another source of scatter is the activation length and the symmetry of the acti- vation length with respect to the crack section. These two aspects were loosely controlled in this study using the heat gun activation method. As can be seen from Fig. 9, these two aspects affect the compressive stress distribution in the steel plate. An activation method with precise control of the temperature applied to the Fe-SMA and the activated area is preferable to reduce the contribution of the temperature inconsistency to the scatter in the fatigue results.
6. Discussion
The fatigue test results substantiate the desirable crack growth retardation effect of the prestressed Fe-SMA reinforcements. Two important factors have a significant impact on the fatigue crack growth retardation of the proposed method: the effect of debonding at the interface between the steel plate and the Fe-SMA strip, and the effect of the R ratio of applied fatigue loading. These two factors are discussed in this section.
6.1. Effect of debonding size
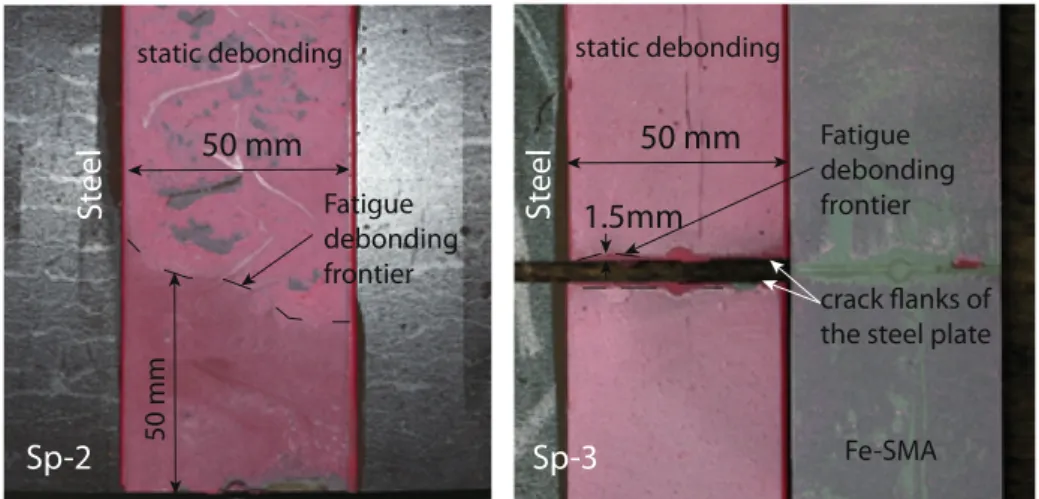
As pointed out in the previous section, the drastic difference in the crack growth behaviors of Sp-2 and Sp-3 is attributed to the different bridging mechanisms of the two specimens. A post-mortem examination of the destroyed bond line between the steel plate and reinforcements shows that the debonding size due to fatigue loading in Sp-2 is much larger than that in Sp-3. The dimensions of the respective debonding sizes resulting from fatigue loading are shown in Fig. 13.
Fatigue debonding can be easily distinguished from static debonding on the debonding surface, as shown in Fig. 13. The surface of the fatigue debonding is much smoother, owing to friction during fatigue loading, than the debonding resulting from quasi-static loading. The debonding surface was obtained by detaching the reinforcement strips. The NM-
Fig. 13.Comparison of fatigue debonding sizes of Sp-2 and Sp-3.
Fig. 12.Crack surface with beach marks of Sp-3.
CFRP strips exploded during this process, whereas the Fe-SMA strips debonded from the steel plate. A relatively thick layer of adhesive is left on the steel surface, whereas a thin layer of adhesive can be observed on the Fe-SMA strip and on the CFRP fragments.
It is well-known that the magnitude of the bridging stresses is related to the debonding size [23]. The bridging stresses are normally evaluated by implementing the principle of displacement compatibility [21,23,38]. The evaluation of the bridging stresses is beyond the scope of this study, and only qualitative reasoning is provided. The rein- forcement material over the debonded length deforms to accommodate the crack opening; a longer debonded length allows for a smaller strain in the reinforcement material to accommodate the crack opening, and thus the bridging stresses induced are smaller.
Based on the above argument, the large debonding size in Sp-2 in- dicates that the bridging stresses, which would substantially reduce the crack driving force at the crack tip, were not maintained at a high level.
On the contrary, the debonding size in Sp-3 is very small, resulting in a higher bridging stress distribution, which substantially reduces the crack growth. This is consistent with the crack growth rate curves of Sp- 2 and Sp-3 in Fig. 11(b). However, the reason Sp-3 with the Fe-SMA strips has almost no fatigue debonding merits further investigation.
It is noteworthy that the debonding sizes due to fatigue loading in Sp- 4, Sp-5, and Sp-6 are close to the case of Sp-3. It seems that the activation Th above Tgof the adhesive does not degrade the fatigue performance of the adhesive.
6.2. R ratio effect
The fatigue test results demonstrate that the proposed solution is promising. A life extension ratio of 3.51 can be obtained, which is significantly superior to the solution with NM-CFRP. However, the effect of prestressing on the fatigue life extension is not as high as expected when comparing the results of Sp-3 and the specimens with prestressing.
This is explained in terms of the R ratio effect.
It is assumed that linear elastic fracture mechanics are applicable for the analysis of fatigue crack propagation in the tested specimens. As a result, the total stress intensity factor, Ktotal, at the crack tip can be decomposed into three items based on the principle of superposition:
Ktotal=Kfarfield− Kprestressing− Kbridging
where Kfarfield is due to far-field applied stresses, Kprestressing is due to the generated prestressing stresses in the steel plate, and Kbridging is due to the bridging mechanism. As detailed calculations of these parameters are beyond the scope of this study, a qualitative discussion on the effect of prestressing stresses on Ktotal and the effective stress intensity factor range, ΔKtotal, in relation to the R ratio is provided.
For simplification, it is assumed that the activation does not change the stiffness of the Fe-SMA strips and the adhesive. Kfarfield and Kbridging
are the same for specimens with or without prestressing stresses. When the Fe-SMA strips are activated, compressive stresses that compensate
the far-field applied tensile stresses are generated in the steel plate. As shown in Fig. 14, the applied far-field fatigue loading is shifted down- ward by the prestressing stresses. It is certain that the prestressing will decrease Ktotalfor the maximum loading according to Eq. (1). However, the change in ΔKtotaldepends on the level of prestressing and the R ratio.
As illustrated in Fig. 14, the fatigue loading with R=0.2 is shifted down by the prestressing stresses, σpre,1, in the activated 1 case. In this case, the effective stress range is unchanged, assuming that the crack opening stress is zero for the simplicity of this discussion. Consequently, in this case, ΔKtotal is not reduced because of the prestressing stresses [11]. To reduce ΔKtotal, the prestressing stresses should be higher, as illustrated by σpre,2 in the activated 2 case. For fatigue loadings with R ratios close to 0, such as R =0.05, ΔKtotalcan be easily reduced with even a low level of prestressing stresses, as depicted in Fig. 14. The pre- stressing stresses, σpre,1, shifts part of the applied loading below 0, effectively reducing ΔKtotal.
In this test campaign, an R ratio of 0.2 is adopted. The minimum fatigue stress in the steel plate is approximately 18.7 MPa, and the compressive stresses in the steel plate owing to prestressing is approxi- mately − 20 MPa, as shown in Fig. 9. The fatigue life extension effect is very close to the activated 1 case illustrated in Fig. 14. The prestressing level must be higher to achieve a better fatigue life extension efficiency of the proposed solution.
7. Conclusions
In this research, a bonded prestressed fatigue strengthening system for metallic structures was proposed, and its fatigue life extension effi- ciency was experimentally investigated. The proposed fatigue strengthening system takes advantage of the SME of the Fe-SMA and the bridging mechanism offered by the bonding technique to generate beneficial compressive stresses in the parent structure. The generated compressive stresses can significantly reduce the crack growth rate, resulting in a fatigue life extension ratio as high as 3.51.
Compared to adhesively bonded reinforcements without prestressing reinforcements with prestressing, the bonded prestressed reinforcement combines the advantages of the two repair systems. There are three mechanisms that contribute to the retardation of the fatigue crack growth: added stiffness, bridging mechanism, and prestressing mecha- nism. The potential of prestressing on fatigue life extension is high- lighted by the fact that the fatigue life is increased by 34.7% owing to prestressing.
The concerns related to the high-temperature heating of adhesive during the activation process are also addressed in this study. Based on the test results, it is concluded that the adhesive anchorages can securely anchor the Fe-SMA strip without softening during the activation process, and no significant residual stresses due to prestressing could lead to premature debonding failure of the anchorage.
Fig. 14.Illustration of R ratio effect.