Berg: Ascorbate interference in glucose test Strips 89 J. Clin. Chem. Clin. Biochem.
Vol. 24, 1986, pp. 89-96
© 1986 Walter de Gruyter & Co.
Berlin · New York
Ascorbate Interference in the Estimation of Urinary Glucose by Test Strips
By B. Berg
Clinical Chemical Laboratory, Central Hospital, Kristianstad, Sweden
(Received July l/September 19, 1985)
Summary: Currently used test strip methods for the detection of glucose in urine are influenced by ascorbate and may thus give false negative results, e. g. in screening for diabetes. Six different test Strips for urine glucose were evaluated for interference by ascorbate in vitro.
Interference by ascorbate varied markedly, being highest at low glucose concentrations. Interference coeffici- ents for the individual tests were calculated to serve äs an approximate index of interference by ascorbate.
A new test (BM 33.071, Boehringer Mannheim GmbH, currently used in Combur-9-Test®/Chemstrip™-9 and other multiple test Strips of Boehringer Mannheim) was clearly much less influenced äs no urine containing 5.5 mmol/1 glucose was read äs negative even at very high ascorbate concentration. Readability of test Strips differed due to patchy colour reactions. Precision was good within-test strip and within-urine but markedly less between urines.
Interferenz von Ascorbat beim Nachweis von Glucose im Harn mit Test streifen
Zusammenfassung: Gegenwärtig benutzte Teststreifen-Methoden für den Nachweis von Glucose im Harn werden durch Ascorbat beeinflußt und können deshalb falsch negative Resultate ergeben, z. B. beim Screening auf Diabetes. Sechs verschiedene Teststreifen für Glucose im Harn wurden hinsichtlich der Interferenz durch Ascorbat in vitro geprüft. Die Interferenz durch Ascorbat variierte deutlich, sie war am stärksten bei geringen Glucosekonzentrationen, Für die einzelnen Tests wurden als Näherungs-Maß der Interferenz durch Ascorbat Interferenz-Koeffizienten berechnet. Ein neuer Test (BM 33.071; Boehringer Mannheim GmbH, z. B. enthal- ten im Combur-9-Test®/Chemstrip™-9 und anderen Mehrfach-Teststreifen von Boehringer Mannheim) wurde deutlich geringer beeinflußt: Kein Harn, der 5,5 mmol/1 Glucose enthielt, ergab auch bei sehr hoher Ascorbat- Konzentration ein negatives Testresultat. Die Ablesbarkeit der Teststreifen differierte aufgrund von scheckigen Farbreaktionen. Die Präzision der Untersuchung mit dem einzelnen Teststfeifen und dem einzelnen Harn war gut, mit verschiedenen Harnen jedoch deutlich geringer.
Introduction The problem is well documented by experiments in
Currently used test Strips for the detection of glucose vitro (1—3). Many efforts have been made to avoid in urine are all based on the glucose oxidase/peroxid- it, e. g. by ion exchange chromatography (4), but äse detection principle. The last Step in these redox these methods have not been widely used due to their reactions is more or less influenced by ascorbate in impracticability.
all test Strips.
J. Clin. Chem. Clin. Biochem. / Vol. 24,1986 / No. l
90 Berg: Ascorbate interference in glucose lest Strips Since 1977 test Strips have been available that are
supplemented by a test field for reducing components in urine, in order to indicate possible interference with the glucose test. Specimens with a positive ascorbate reaction are then discarded to avoid potentially false- negative results. However, the patient must then re- turn to the laboratory to repeat the determination with ascorbate-free urine.
Recently a new urine test (BM 33.071, Boehringer Mannheim GmbH) has been developed which con- tains iodate. This oxidizing agent diminishes the inter- fering effect of ascorbate and other reducing sub- stances.
The aims of this study were to evaluate ascorbate interference and ease of handling of six different urine glucose test Strips.
Materials and Methods
Thirty urine specimens with ascorbate concentrations below 0.1 mmol/1 were obtained from non-diabetic patients in primary health care. The urines were spiked with glucose and ascorbate to result in glucose concentrations of 2.8, 5.6, 16.7 mmol/1 (50, 100, 300 mg/dl) and ascorbate concentrations of native, 0.6, 1.1, 1.7, 2.3, 4.5 mmol/1 (100, 200, 300, 400, 800 mg/1).
In this way 540 (30 3 6) urine samples were examined by each test.
Four urines spiked with glucose were also tested with gluta- thione and gentisic acid (0.6 and 2.4 mrnol/1) and also with ascorbate up to 23 mmol/1.
In table l the six urine glucose tests are listed by manufacturers' code names, batch nurnber, minimum time to expiration date, nominal glucose concentration for each colöur block, indi- cators, reaction colours and reading times. T£e manufacturers give little or no detailed written instructions for the perfor- mance of the test reading. The readings were therefore taken to the nearest half colour block (arbitrary unit, arb unit) ffom 0 ("negative"/"iiormal") to 3 or 4 (highest concentration) with Interpolation to at least one intermediate step between the printed colour blocks. All readings lower than 0.5 unit were read äs 0 arbitrary units, even if a faint reaction colour was seen.
Irregularities in the test field colours and difficulties in reading were noted.
According to the manufacturers' instructions, the test strips C, E and F should be read at 30-60 seconds, the fonner being recommended. All calculations made on the influence qf ascor- bic acid on the glucose estimation were based on the values recorded after 30 seconds. For 14 urines, 30- and 60-seconds- readings were compared. All test strips had at least 7 months to expiration date.
In urine specimens 1 — 10, the users kriew the spiked concentra- tions of glucose and ascorbic acid (i. e. open reading). All samples from urine specimens 11—30 were randomised before testing (blind reading).
Six experienced readers with normal colour vision read the test strips in a room well lit with "daylight" fluorescent tubes (5500 K). Within each of the 30 urines, each type of test strip was read by only one reader.
Ascorbate was measured äs redücing capacity (Ferrozine detec- tion of Fe3+ -» Fe2+) (5), and glucose with a glucose dehydroge- nase (Merck, West Germany) method.
Tab. 1. Urine glucose tests.
Test batch Time No. to
expira- tiondate
Manufacturer Colour blocks (mmol/1) Indicator
(months) Arb unit
BM 33.071
Redia-Test 14 21022501
L-Combur-5- 18 Test21082505
Labstix 12 1145013 A
Rapignost 7 Diabetes-Profil 0631
Meditest 19 Glucose 3
03313
0 Boehringer norm.
Mannheim West Germany
Boehringer neg.
Mannheim West Germany
Boehringer norm.
Mannheim West Germany
Ames neg.
USA
Behring norm.
Diagnostica West Germany
Macherey-Nagel neg.
West Germany
1 2 2.8 5.6
up ' 5.6 to 5.6 to 28
5.6 16.7
5.6 13.9
2.8 8.3
2.8 8.3
3 4 16.7 56
28 .and more 56
28 56
28 56
28 56
Tetramethyl- benzidine
0-Tolidine
Aminopropyl- arnino- carbazole lodide
ö-Tolidine
ö-Tolidine ,
Final reaction colour/
recom- mended reading time green-bme 60s green-blue 60s brown 30-60 s
brown on turquoise 30s green-blue ' 30-60 s
green-blue 30-60 s
Berg: Ascorbatc interference in glucose test Strips 91 Interference coefficients
To obtain a practical index, ascorbate interference was ex- pressed äs interference coeiTicient (C. A. Carslensen, to be pub- lished), derived from the intervals where interference was seen, i. e. when the estimate was significantly lower than the one with the native urine. The interference coefficient is identical with the slope b in the linear regression function described below. For each glucose concentration the median readings in arbitrary units were plotted on the Ordinate versus the ascorbate concentration on the abscissa. At low ascorbate concentrations, readings were reasonably linear. For this linear ränge, the regression coefficients were calculated for each glucose concen- tration:
y = a + bx where
y = median reading (expressed in arbitrary units)
a = intercept, i. e. reading of glucose in urine without added ascorbate
b = interference coefficient
= ascorbate concentration (mmol/1)
The calculated interference coefficient is only valid within the linear ränge of the estimated glucose concentration. The lower the interference by ascorbate, i. e. the less deviation from the expected reading, the smaller will be the absolute value of the interference coefficient. If the coefficient is b = —l, then the testfield reaction at a glucose concentration of one arbitrary unit is completely suppressed by l mmol/1 ascorbate, i. e. a false negative reading is obtained. With b = —0.5, an ascorbate concentration of 2 mmol/1 is necessary to give a reading of 0 arbitrary units. With b = 0, the "y" value will be identical to the "a" intercept and constant over the entire ränge of ascorbate concentrations, i. e. there is no influence of ascorbate on the glucose estimation.
Strips varied widely in their sensitivity to ascorbate interference. Test strip A was clearly less influenced than the other tests. Four of the test Strips gave false negative median readings (i. e. 0 arb unit) at a glucose concentration of 2.8 mmol/1 and > 1.1 mmol/1 ascor- bate (tab. 3).
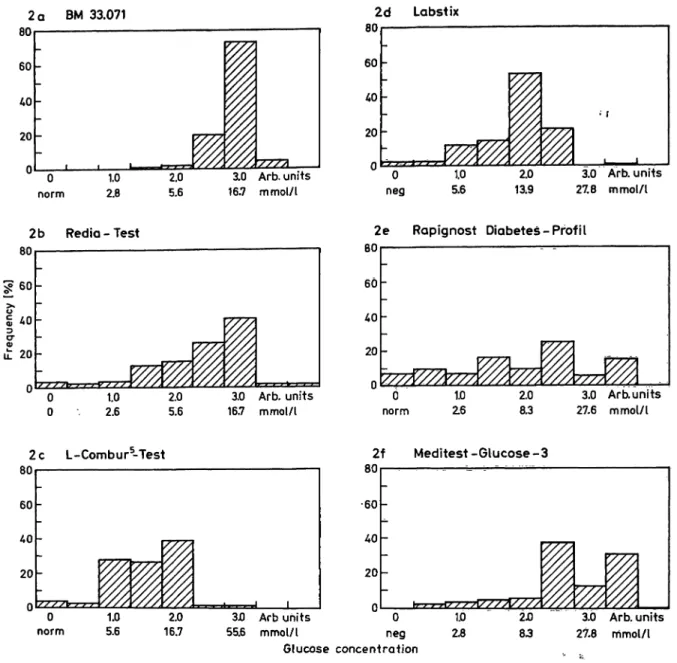
Even when colour was still produced at higher glucose concentrations, ascorbate still affected precision. Dia- grams 2 a — f show the frequency of the readings (in arbitrary units) at a glucose concentration of 16.7 mmol/1. Regardless of the actual ascorbate concentra- tion all values for the 30 urines were plotted. If the readings are precise and the test insensitive to ascorbate, then the distribution will be narrow. A Symmetrie, Gaussiau distribution may be expected at absolute insensitivity. If the readings are decreased by ascorbate, the distribution will be skewed to the left.
This was observed with all tests. However, the repro- ducibility of test strip A (BM 33.071) was distinctly better than that of the others.
An interference with the glucose reaction, similar to that caused by ascorbate, was also caused by gentisic acid and, to a much lesser extent, by glutathione.
These substances produced a colour markedly dif- ferent from that of the printed colour blocks for test Strips B and E.
Results
Urine glucose determination
Little difference was found between the median re- sults for each ascorbate glucose combination whether the reading was open or blind. Therefore, the results from all 30 urine specimens were pooled.
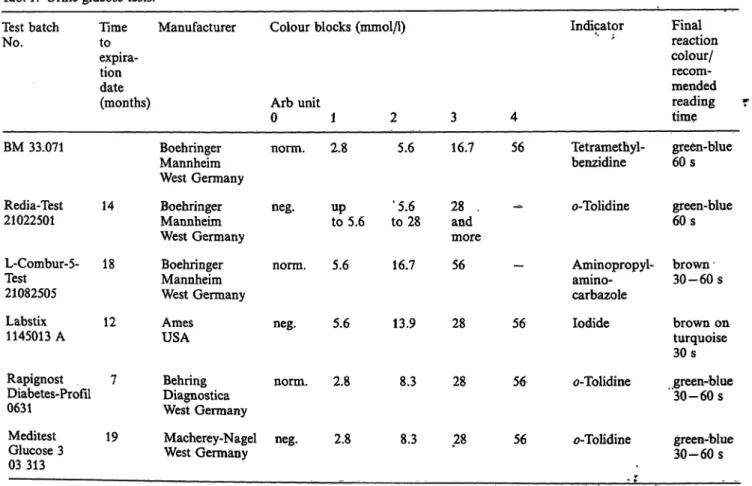
Figures l a—f show the influence of the ascorbate concentration on the reading, when the results from 30 urine specimens were plotted äs medians and 10—90 percentile confidence intervals. With increas- ing ascorbate concentrations, the readings decreased for all urine glucose tests.
At a glucose concentration of 2.8 mmol/1 the decrease was often linear up to 1.1 mmol/1 ascorbate. At higher glucose concentrations, the linear ränge extended to 2.3 mmol/1 ascorbate. Interference coefficients are presented in table 2.
It follows from figures l a—f (visually) and from table 2 (numerically) that the ascorbate interference with a glucose test was much more pronoünced at lower than at higher glucose concentrations. The test
Handling
The glucose test Strips also differed in readability and ease of handling.
For test strips E and F readability decreased strongly with urine specimens containing ascorbate, due to a patchy, flaming appearance of the colour of the test fields (tab. 4).
Sometimes the edge of the test fields had a darker or lighter colour than the center (E and F). This was sometimes caused by overflow of chemicals from the adjacent test fields (for test strip F). Sometimes the whole test area showed irregulär darker and brighter areas (especially for E and F). All readers had some difficulty with test strip D at glucose concentrations between 5.6 and 13.9 mmol/1 due to a marked speckled appearance of brown dots on turquoise background, which was not illustrated on the printed colour block.
All six readers individually chose Strips A and B (BM 33.071 and Rediatest) äs the strips easiest to read, i. e. with the lowest frequency of reading problems.
J. Clin. Chem. Clin. Biochem. / Vol. 24,1986 / No. l
92 Berg: Ascorbate intcrfcrence in glucose test Strips
1 α ΒΜ 33.071
percentile
10 50 90 1d Labstix
1b Red ia-Test 1e Rapignost Diabetes-Profil
1c L-Combura-Test 1f Meditest-Glucose-3
24.
1 2 3 4
Ascorbate concentration lmmol/l]
Fig. l a f. Influence
Abscissa: Ascorbate concentration (mmol/1)
Ordinate: lOth, 50th and 90th percentile for readings (arbitrary units)
ion on urine glucose estimation with test Strips at three concentrations of glucose
Berg: Ascorbate interference in glucose test Strips 93 Tab. 2. Interference coefficients for six urine glucose tests at three glucose concentrations.
Concentration of glucose in 2.8 mmol/1
BM 33.071 Redia-Test L-Combur-Test Labstix
Rapignost Diabetes-Profil Meditest Glucose 3
const.*
toascorbic acid (mmol/1) 1.1
—
——
—
—
Interference coeffieient
-0.258 -0.892 -0.907 -0.833 -1.667 -0.833
urine
5.6 mmol/1 const.*
toascorbic acid (mmol/1) 1.7 0.6— 0.6
——
Interference coeffieient
-0.322 -0.423 -0.907 -0.833 -1.346 -0.883
16.7 mmol/1 const.*
toascorbic acid (mmol/1) 2.30.6 2.3—
—
—
Interference coeffieient
-0.227 -0.346 -0.423 -0.455 -0.557 -0.312 Correlation coeffieient r > 0.95
* const. = no influence on the median glucose estimation by ascorbate up to concentrations noted in the table.
Tab. 3. Frequency of false-negative readings (<0.5 arb units) in 30 urines spiked with glucose and ascorbate.
BM 33.071 Rediatest Combur-Test Labstix
Glucose 2.8 mmol/1 Ascorbate concentration (inmol/1)
0.60 1.11.7 2.34.5
Glucose 5.5 mmol/1 Ascorbate concentration (mmol/1)
0.60 1.11.7 2.34.5
06 2311 2529
00 00 00
09 1229 2930
00 02 288
190 2930 3030
01 173 2730
193 2730 3030
00 131 2230
Rapignost Meditest Diabetes- Glucose-3 Profil
240 3030 3030
02 3010 3030
101 2830 3030
02 63 1930
Glucose 16.7 mmol/1 Ascorbate concentration (mmol/1)
00.6 1.11.7 4.5"2.3
00 00 00 .
00 00 04
00 00 201
00 00 03
00 00 235
00 00 31
For most urines, increasing the ascorbate concentra- tions gave a progressive decrease in the readings without much irregulär scattering. This was seen in both the open and the blind trials (number of irregu- larities: ^0.5 arb unit corresponds to 2 out of 150 and 19 out of 300 possible combinations; l arb unit corresponds to l out of 150 and l out of 300). Thus,
the combination of one reader, one test Strip and one urine specimen had a rather high degree of precision even when the readings were taken blind,
Median readings at 60 seconds were distinctly higher than at 30 seconds for test Strips C, E and F. Es- pecially at high glucose concentrations, the increase amounted to l arb unit for test Strips E and F.
J. Clin. Chem. Clin. Biochem. / Vol. 24,1986 / No. l
94 Berg: Ascorbate intcrference in glucose test strips
2 80 60 40 20 0
α ΒΜ 33.071
-
0 1.0 2.0 norm 2.8 5.6
1 13.0 Arb. unitsvyy>i 16.7 mmol/t
2 80 60 40 20 0
d Labst ix
: , ^
0 1.0
neg 5.6
^ U
2.0m.
S'///13.9
• r
3.0 Arb. units 27.8 mmolA
Redio - Test
3.0 Arb. units 16.7 mmol/l
2e Rapignost Diabetes-Profi l
80 60 40 20
Ο d
norm
1.0 Z6
2.0 8.3
3.0 Arb.units 27.6 mmol/l
2c L-Combur5-Test
BU 60 /•O 20 -
P m '%. '///,
////'xVxs///'////
DU
•60 40 20 -
_ -
~
0 1.0 2.0 3JO Arb uhits 0 1.0 norm 5.6 16.7 55.6 mmol/l neg 2.8
Glucose concentration
////
///////
v//. % W'.'W.
2Ό 3.0 Arb. units 83 27.8 mmol/l
Fig. 2 a—f. Frequency of test strip readings at a urine glucose concentration of 16.7 mmol/l. All readings were pooled without respect to ascorbate concentration.
Abscissa: Reading results (arbitrary units and corresponding nominal glucose eoncentration) Ordinate: Frequency of readings
Tab. 4. Problems in reading the test fields (540 urine samples each).
Teststrip
AB CD EF
Colour Interpretation difficult 19 (1) 17 (7) 1666 (37) 76 (35) 39 (14)
Flaming appearance of test fields
137 14 (1) 37 (1) 116 (84) 76 (41)
Deviating colour of test field edge
2 (1)1 41 28 (15) 32 (12) Figures within brackets denote urines where the reaction was classified s <0.5 arb unit. Reading problems only relate to test fields with positive readings (i. e. often for less than 540 urine samples).
Discussion
Numerous άι vzfro experiments have clearly deinon- strated that reducing substances interfere with urine test strips th t use redox reactions for the detection of glucose and haemoglobin (1—3, 6), Ascorbate is the most important reducing substance, although interference by urate, glutathione and gentisic acid may possibly occur (6). In fact, in many years of routine clinical experience with native patient urines, we h ve never seen the aberrant reaction colours caused by gentisic acid and glutathione described here for test strips B and E. Therefore, these sub- stances lack clinical significance for urine glucose testing.
Berg: Ascorbate interference in glucose test Strips 95
On the basis that ascorbate may cause false negative glucose results, at least one test strip manufacturer has recommended that ascorbate-containing urine specimens should be discarded and a new specimen obtained. Another way to circumvent the problem has been to discourage patients to eat fruits, veg- etables and vitamin Supplements prior to assay. How- ever, modern test Strips should be applicable in a simple way to random urine specimens.
Exchange chromatography (4) or ascorbate oxidase pretreatment (B. Berg, to be published) have been employed to eliminate ascorbate. Unfortunately, little attention has been given to the heart of the problem, i. e. the unavailablility of ascorbate-insensitive strip tests for glucose.
The six test Strips for urine glucose evaluated here differed markedly in their sensitivity to ascorbate.
It should be mentioned that one of the two Strips containing test fields for ascorbate also had the highest sensitivity to interference.
The new Boehringer Mannheim concept of including iodate in the test field appears to be effective. lodate oxidizes ascorbate to non-interfering dehydroascor- bate, without affecting the indicator reaction.
Ascorbate affects test results in three modes:
a) lower pretision at all glucose concentrations (tab. 2)
b) false-negative results
c) compromised readability due to uneven distribu- tion of the reaction colour on the test field. This may be caused by Chromatographie effects: If urine is absorbed intö the test field paper mainly from the edges less ascqrbate will reach the middle of the test ärea. Ön the other band, reading diffi- culties were also observed with native unspiked urines (tab. 4).
The interference coefficients give an'approximate nu- merical expression of the sensitivity to ascorbate interference by allowing an estimation öf the ascor- bate concentration ät which a false negative result will be obtained. Naturally, interference coefficients may also be calculated using absolute glucose concen- trations in order to "standardize" arbitrary units ob- tained with different test Strips. However, not all test Strips have nominal levels for absolute concentra^
tiöns.
As might be expected, low levels of glucose were more easily falsified than high levels. In Scandinavia, urine glucose tests for diabetes screening are expected to have a very high sensitivity with little emphasis
on quantification. Thus, screening for early, mild diabetes with only low-grade glucosuria will be more severely äffected than monitoring of known diabetes with high glucosuria.
Different manufacturers recommend different cut-off limits for diabetes screening, e. g. 2.8-5.5 mmol/1 glucose. Only evaluations in clinical practice can de- cide which level is the most suitable.
In any case, the cut-off limits should be correctly reflected by the screening test without interference, e. g. from ascorbate.
The new test BM 33.071 (Boehringer Mannheim GmbH) was not completely insensitive to ascorbate but still had a wide safety margin. At a urine glucose concentration of 5.5 mmol/1, even 23 mmol/1 ascor- bate failed to completely abolish the reaction. Since the levels of ascorbate in urine do not always increase proportionately to the amount of vitamin C ingested this level is far higher than encountered in clinical practice. According to Angel et al., urinary ascorbate did not exceeä 5 mmol/1 even after intake of 5 g ascorbic acid per day for several weeks (7).
In our patient population in Kristianstad county as- corbate concentrations of 0.6 to l .2 mmol/1 (100—200 mg/1) are typically seen in 3 to 20% of the urine specimens. Higher concentrations are very rare.
Therefore, it is probably sufficient for a test strip to tolerate 2 mmol/1 ascorbate. But even at such low levels several of the test Strips were markedly äffected.
In this study even well trained readers found marked differences in the ease of handling of the test Strips.
Difficulties in cpmparing the test strip with the printed colour blocks on the bottle were highly corre- lated with an uneven distribution of the reaction colour on the test field.
Even when a test strip is completely immersed into the urine specimen, urine may not always be distributed evenly throughout the test paper. This may explain the patchy, flaming or dotted appearance of the test fields, especially observed with the Strips E, F (spor- adic error) and D (systematic error). The problem is enhanced if the colour block does not accurately reflect the colour reaction of the test strip. This may cause severe reading problems not only for glucose tests.
Even in the blind readings, each observer achieved high within-reader in within-test strip precision. How- ever, between-urine and between-reader Variation was considerable. Thus, matrix effects on test strip func- tion may be a major part of analytical imprecision, in addition to reader subjectivity and varying light conditions (8).
J. Clin. Chem. Qin. Bioohem. / Vol. 24,1986 / No. l
96 Berg: Ascorbate interference in glucose test Strips As expected for a non-equilibrium reaction such äs
the redox test used here, the reaction colour varied markedly with incubation time (up to l arb unit for an extra incubation time of 30 seconds). For qualitative tests, this is a minor limitation. However, if a test is labeled "semiquantitative", a defined read- ing time should be used. It is not sufficient to use the wide recommendations by the manufacturers (e. g.
30-60 s).
Unfortunately, in published evaluations of test strip performance, little attention has been given to the specification of detailed reading instructions. The manufacturers have usually omitted to give exact instructions on how to interpolate and round off the test field readings, i. e. whether to use the nearest
colour block, go upwards or go downwards. This is important äs it means 0.5 — 1 arb units (i. e. colour block) difference in the resült.
It is not enough for the manufacturer to develop a test strip that prodtices a colour change in the presence of an analyte. Every test should also bfe evaluated for ease of handling and clinical usefulness. Test Strips are often used by untrained personell, having more difficulties in reading than the experienced reäders in this study.
Acknowledgement
I thank Boehringef Mannheim, West Germany, for supplying all test strips used.
References
1. Appel, W., Nuerck, C. & Merkle, U. (1979) Medical Labora- torytf,29-39.
2. Daae, L. N. W. & Juell, A. (1983) Scand. J. Clin. Lab. Invest.
43, 747-749.
3. Kutter, D. (1983) Schnelltests in der klinischen Diagnostik.
Urban & Schwarzenberg, München—Wien —Baltimore, pp.
28-39.
4. Brandt, R., Guyer, K. E. & Banks, W. L. (1974) Clin. Chim.
ActaJ/, 103-104.
5. Butts, W. C. & Mulvihffl, H. J. (1975) Clin. Chem. 2i, 1493-1497.
6. Feldman, J. M., Kelley, W. N. & Lebowitz, H. E. (1970) Diabetes 19, 337-343.
7. Angel, J., Alfred, B., Leichter, J., Lee, M. & Marchant, L.
(1975) Internat. J. Vit. Nutr. Res. 45, 237^-243.
8. Dyrberg, J., Pedersen, L. & Aagaard, O. (1976) Clin. Chem.
22, 205-210.
Bertel Berg Clin. Chem. Lab.
Central Hospital S-291 85 Kristianstad