Bayer et al.: Multicentre evaluation of the Hitachi 704 9] 9 J. Clin. Chem. Clin. Biochem.
Vol. 25,1987, pp. 919-932
© 1987 Walter de Gruyter & Co.
Berlin · New York
A Multicentre Evaluation of the Boehringer Mannheim/Hitachi 704 Analysis System
By P. M. Bayer
Wilhelminen-Spital, Vienna M. Knedel
Klinikum Großhadern, Munich
N. Montalbetti, S. Brenna
tL· Prencipe Ospedale Niguarda-Ca'Granda, Milan A. Vassault, M. Bailly
tH. T. Phung Hopital Necker, Paris \
in collaboration with
W. Bablok, W. Poppe and W. Stockmann Boehringer Mannheim GmbH, Mannheim
(Received August 17, 1987)
Summary: The selective multitest Boehringer Mannheim/Hitachi 704 analysis System was examined according to the ECCLS guidelines in a multicentre evaluation involving four laboratories. Ten routine parameters, covering most of the application settings of the Instrument, were measured in the respective laboratory at temperatures 25, 30 or 37 °C. The trial lasted four months and gave more than 40000 data. It yielded the following results:
1. Within the four laboratories the mean coeffidents of Variation for three control sera at different concen- trations were found to be equal to or better than 1.6% for the within-run imprecision and 2.8% or better for the between-day imprecision.
2. No drift was observed during eight hours.
3. Because of the high linear measuring ränge a re-run analysis was seldom necessary.
4. 'Sample-related carry-over was not seen. Reagent-dependent carry-over was measured from cholesterol to uric acid and from triacylglycerols to lipase. Through modification of the cholesterol and triacylglycerol reagents, the carry-over effect was präctically eliminated.
5. The recovery of the assigned values of control sera showed average values between 99 and 104%. For bilirübin, creatinine, creatine kinase and alanine aminotransferase some control sera showed deviations greater than 10%.
6. In all cases, regression analysis of the resülts obtained in comparisons of the present Instrument with the Hitachi 705 or 737 yielded slopes close to unity with extreme values of 0.95 and 1.06.
J. Clin. Chem. Clin. Biochem. / Vol. 25,1987 / No. 12
7. During the entire evaluation period there was no malfunction or breakdown of the Instruments.
The evaluators came to the conclusion that the analytical performance äs well äs the reliability and practic- ability of the Hitachi 704 can be rated äs excellent.
Introduction
To establish reliable performance criteria, the Boeh- ringer Mannheim/Hitachi 704 analysis System
1) was evaluated in a multicentre study. Four clinical labo- ratories participated in the evaluation. The evaluation protocol mainly follows the ECCLS guidelines for the evaluation of analysers in clinical chemistry (1). These guidelines have already been applied successfully to the multicentre evaluation of the Hitachi 737 (2).
This is the first time that a multicentre trial has been undertaken at three different measuring temperatures.
This entailed a certain risk with regard to the com- parability of the data, especially the enzyme activities.
To ensure uniformity between the different labora- tories, similar Instruments (Hitachi 705 and 737 resp.) were used for comparison.
These Instruments were chosen because of their wide distribution together with their good performance and acceptance. Moreover, these Instruments are already installed for routine analysis in the four laboratories.
Within four months, more than 40 000 data had been collected in the four centres and statistically evaluated at Boehringer Mannheim.
Data were evaluated in four stages:
Familiarization period
The Instrument users were trained by experts of the Company. An acceptance test was carried out covering imprecision and inaccuracy with 3 control sera and a minimum of 4 parameters.
Initial trial
An imprecision study was carried out for 10 days on the Hitachi 704 and the comparison Instrument, using the same 10 analytes äs in the main trial.
Main trial
Extensive performance data were obtained from the main trial, which involved imprecision studies, recov- ery studies, method comparisons, linearity studies, carry-over and drift experiments for 10 analytes. In contrast to the ECCLS-protocol, the within-run im-
precision was detennined only on one day instead of three, and the between day impreqision data froin both the initial and main trial were used.
Description of the Hitachi 704
The Hitachi 704 is a discrete, selectively operated multitest analyser, which can handle up to 23 chemicäl analytes including the electrolytes sodium, potassium and Chloride; these are detennined with an optional ion-selective electrode module. The Hitachi 704 was developed äs a logical successor of the Hitachi 705, offering additional special features: an alphanumeric keyboard and improved printout, a real time qüality control program, data monitoring and special Soft- ware for immunological tests (non-linear curve fitting, prozone check). A bidirectional link with a host Com- puter is possible.
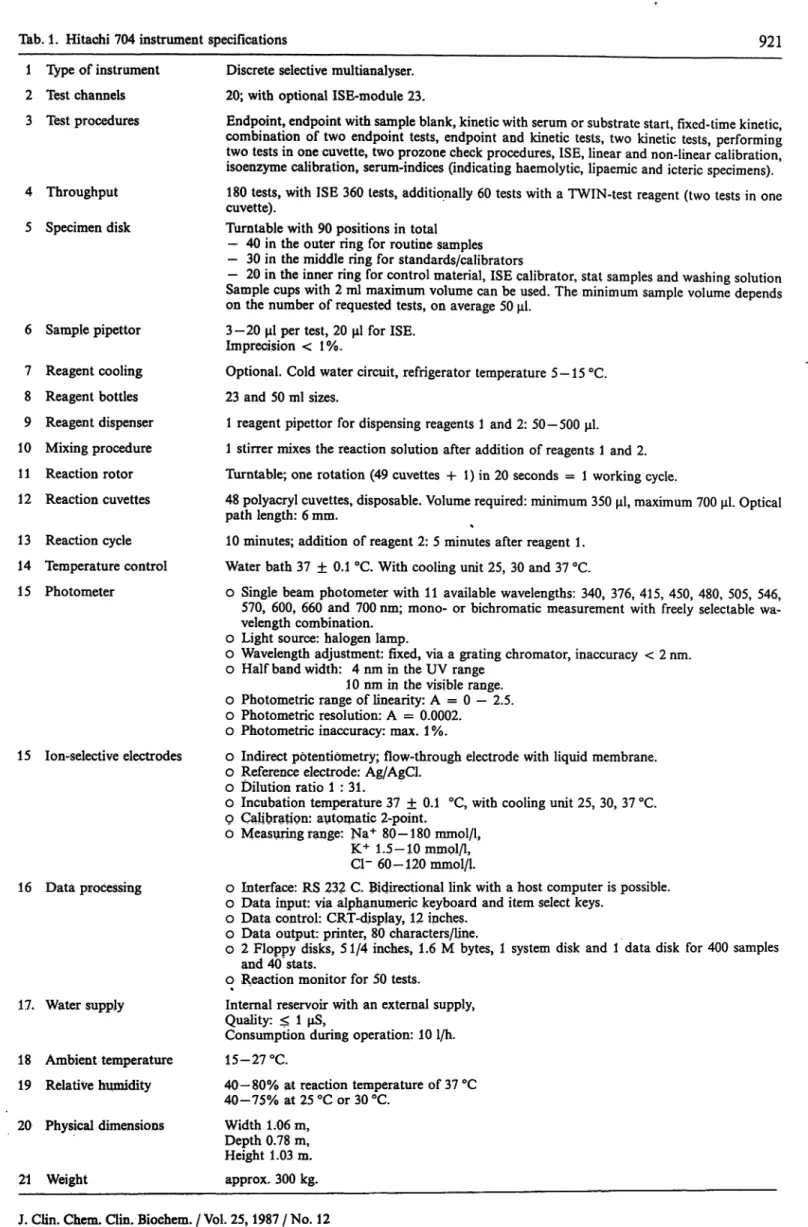
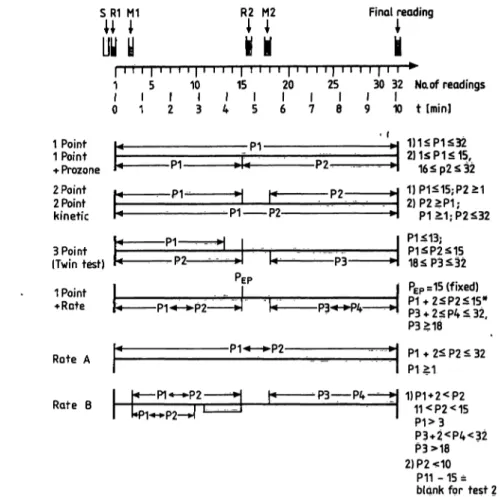
The Hitachi 704 is available in 4 versions: a basic model with 37 °C measuring temperature only, a model with cooling unit and three measuring temper- atures (25, 30, 37 °C) and both of these versions with an ISE-unit. For the multicentre evaluation the model with cooling unit was used. ISEs were tested in a different laboratory; the results will be püblished else- where. The Instrument specificiations are listed in table 1; figure l shows the analysis modes of the Hitachi 704. For easy reagent handling special System packs for the Hitachi 704 are available (listed in tab. 2).
Methods
Materialsand general procedure
The reagents used on the Hitachi 704 and the comparison analysers are listed in table 3; table 4 shows the most important application settings. The control sera used in the respective trials are shown in table 5.
The four participants of the multicentre evalutation used the same lot of reagent for each of the ten methods.
Predetermined factprs were used in the estimation of enzyme activities; a reagent blank was run daily. The factors were the mean of 5 calibration runs using the calibrator for automated Systems (Lot. No. 1512662)). With the exception of bilirubin, all other Substrates were calibrated with a daily freshly prepared ' calibrator. For the bilirubin assay a fixed factor was detennined by 5 calibration runs with the Precibil® control $erum (tab. 5).
Measurements were performed at 37 °C in laboratories l and 3, at 30 °C in laboratory 4 and at 25 °C in laboratory 2.
0 Abbreviated to Hitachi 704 in the following text. 2) Cat. No. 608432* Boehringer Mannheim GmbH.
J. Clin. Chem. Clin. Biochem. / Vol. 25,1987 / No. 12
Tab. 1. Hitachi 704 Instrument specifications 921 1 type of Instrument
2 Test channels 3 Test procedures
4 Throughput 5 Specimen disk
6 Sample pipettor 7 Reagent cooling 8 Reagent bottles 9 Reagent dispenser 10 Mixing procedure 11 Reaction rotor 12 Reaction cuvettes 13 Reaction cycle 14 Temperature control 15 Photometer
15 Ιοη-selective electrodes
16 Data processing
17. Water supply
18 Ambient temperatme 19 Relative humidity 20 Physical dimensions
21 Weight
Discrete selective multianalyser.
20; with optional ISE-module 23.
Endpoint, endpoint with sample blank, kinetic with serum or Substrate start, fixed-time kinetic, combination of two endpoint tests, endpoint and kinetic tests, two kinetic tests, performing two tests in one cuvette, two prozone check procedures, ISE, linear and non-linear calibration, isoenzyme calibration, serum-indices (indicating haemolytic, lipaemic and icteric specimens).
180 tests, with ISE 360 tests, additionally 60 tests with a TWIN-test reagent (two tests in one cuvette).
Turntable with 90 positions in total
— 40 in the outer ring for routine samples
— 30 in the middle ring for standards/calibrators
- 20 in the inner ring for control material, ISE calibrator, stat samples and washing solution Sample cups with 2 ml maximum volume can be used. The minimum sample volume depends on the number of requested tests, on average 50 μΐ.
3-20 μΐ per test, 20 μΐ for ISE.
Imprecision < 1%.
Optional. Gold water circuit, refrigerator temperature 5-15 °C.
23 and 50 ml sizes.
l reagent pipettor for dispensing reagents l and 2: 50-500 μΐ.
l stirrer mixes the reaction solution after addition of reagents l and 2.
Turntable; one rotation (49 cuvettes + 1) in 20 seconds = l working cycle.
48 polyacryl cuvettes, disposable. Volume required: minimum 350 μΐ, maximum 700 μΐ. Optical
path length: 6 mm. %
10 minutes; addition of reagent 2: 5 minutes after reagent 1.
Water bath 37 ± 0.1 °C. With cooling unit 25, 30 and 37 °C.
o Single beam photometer with 11 available wavelengths: 340, 376, 415, 450, 480, 505, 546, 570, 600, 660 and 700 nm; mono- or bichromatic measurement with freely selectable wa- velength combination.
o Light source: halogen lamp.
o Wavelength adjustment: fixed, via a grating chromator, inaccuracy < 2 nm.
o Half band width: 4 nm in the UV r nge 10 nm in the visible r nge.
o Photoinetric r nge of linearity: A = 0 — 2.5.
o Photometric resolution: A = 0.0002.
o Photometric inaccuracy: max. 1%.
o Indirect p tenti metry; flow-through electrode with liquid membrane.
o Reference electrode: Ag/AgCl.
o Dilution ratio l : 31.
o Incubation temperature 37 ± 0.1 °C, with cooling unit 25, 30, 37 °C.
o Calibration: autpmatic 2-point.
o Measuring fange: Na+ 80—180 mmol/l^
K+ 1.5-10mmpl/l, Cl- 60-120mmol/L
o Interface: RS 232 C. Bidirectional link with a host Computer is possible.
o Data input: via alphanumeric keyboard and item select keys.
o Data control: CRT-display, 12 inches.
o Data Output: printer, 80 characters/lme.
o 2 Floppy disks, 51/4 inches, 1.6 M bytes, l System disk and l data disk for 400 samples and 40 stats.
o Reaction nionitor for 50 tests.«
Internal reservoir with an external supply, Quality: ^ l μ8,
Consumption during Operation: 10 l/h.
15-27°C.
40-80% at reaction temperature of 37 °C 40-75%at25°Cor30°C.
Width 1.06 m, Depth 0.78 m, Height 1.03 m.
approx. 300 kg.
J. Clin. Cherm. Clin. Biochem. / Vol. 25,1987 / No. 12
s m MI
uy y U 1
R2 M2H l
1 J Final readingH i
l ι ι ι l ' ι 'i » l ι ' i ι l ι ι ι ι l ' ι ι ι l ' ι l l l ι i
1 5 10 15 20 25 30 32 Naof readings t l l l l l l l l i l
0 1 2 3 4 5 6 7 8 9 1 0 t [min]
1 Point 1 Point
·»· Prozone 2 Point 2 Point kinetic H
Fig. l. Analysis modes of the Hitachi 704 s = sample
Rl, R2: reagent l, 2 Ml, M2: mixing l, 2 Pi = reading points
*) correction for test 2
^ CM fcL· po to
3 Point (Twin test)
1 Point
•••Rate
Rate A
Rate B
-P1 P2-
l« P1««-*»P2 »l
2)1<ίΡ1<15,
2)P2>P1;
P1>
P3««-M>4
l PEP =
^H P3l P1^P2^15 18^P3^52 PEP=15(fixed)
2<P4<32, P3>18
-P1« ±l P1*2^P2^32
*P3 P4-—H 1JP1 + 2<-P2 11<P2<15 P1>3 P3+2<P4<32 P3>18 2)P2<10
P11 -15 = blank for test 2
Tab. 2. Available Hitachi 704 System packs
Enzymes Substrates
Alanine aminotransferase Alkaline phosphatase a-Amylase
Aspartate aminotransferase Cholinesterase
Creatinine kinase γ-Glutamyltransferase Lactate dehydrogenase Lactate dehydrogenase-1- isoenzyme (a-HBDH) Lipase
Albumin Bilirubin Bicarbonate Calcium Cholesterol Creatinine Glucose Iron
Total protein Triacylglycerols Uric acidrea
Proteins TWIN-Tests
Immunoglobulins G, A, M Transferrin
Complement factors 3, 4 C-reactive protein
Aspartate/Alanine aminotransferase
Triacylglycerols/Cholesterol Urea/Glucose '
For some analytes, several methods are available.
ceeded directly the initial trial, and both studies were performed under the same conditions, the d ta of both trials were cpm- bined to obtain 21 single data3). Only the second value of the duplicate measurements was taken for the statistical calculation.
Drift
Drift effects were st died for all the ten analytes with the same three control sera used in the irnprecision trial. Several vials from the same lot were pooled and kept in closed Containers in a refrigerator. Small portions were transferred into the sample cups of the analyser 15 minutes before the measurements which were taken hourly over a period of 8 hours. For the bilirubin assay the control material was reconstituted every 2 hours to avoid stability problems of the analyte.
Measuring r nge and linerarity
The measuring r nge and the linearity of the methods were checked by mixing a high level serum — which in some cases had to be spiked — with a low level serum to obtain a series of 10 different concentrations. Fresh reagents were used. The measurements were made on two different days.
Imprecision
For the within-run imprecision study three different control sera containing three different levels of the corresponding an- alyte were used (tab. 6). Each participant carried out 21 deter- minations with each of the analytes. Additionally two fresh human serum pools with different levels of the analytes were measured.
The same control sera were used to establish the between-day imprecision with the Hitachi 704 and the comparison.methods.
As the between-day imprecision study of the main trial suc-
Carry-over
The carry-over caused by the sample probe was st died in detail according to a model of roughton (18). Five successive portions of a specimen with a high value (ht ..., hs) folloWed by 5 suceessive portions of one with a low value (l, ..., ls) were determined ten times for each of the analytes.
3) Twenty days in laboratory l, and eleven days in laboratofy 4 for the comparison instrument Hitachi 705.
J. Clin. Chem. Clin. Biochem. / Vol. 25,1987 / No. 12
Bayer et al.: Multicentre evaluation of the Hitachi 704
923
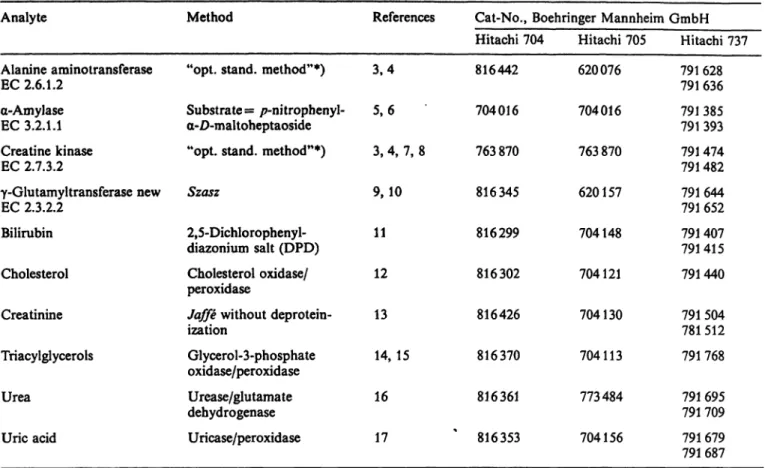
Tab. 3. Reagcnts used during the multicentre evaluation.Analyte Method References Cat-No., Boehringer Mannheim GmbH
Alanine aminotransferase EC 2.6.1.2
a-Amylase EC 3.2.1.1 Creatine kinase EC 2.7.3.2
γ-Glutamyltransferase new EC 2.3.2.2
Bilirubin Cholesterol Creatinine Triacylglycerols Urea
Uric acid
"opt. stand, method"*) Substrate = /7-nitrophenyl- a-Z)-maltoheptaoside
"opt. stand, method"*) Szasz
2,5-Dichlorophenyl- diazonium salt (DPD) Cholesterol oxidase/
peroxidase
Jaffe without deprotein- ization
Glycerol-3-phosphate oxidase/peroxidase Urease/glutamate dehydrogenase Uricase/peroxidase
3,4 5,6 3, 4, 7, 8 9,10 11 12 13 14,15 16 17
Hitachi 704 816442 704016 763870 816345 816299 816302 816426 816370 816361 ' 816353
Hitachi 705 620076 704016 763870 620157 704148 704121 704130 704113 773484 704156
Hitachi 737 791 628 791 636 791 385 791 393 791 474 791 482 791644 791 652 791 407 791415 791440 791 504 781 512 791 768 791 695 791 709 791 679 791 687
*) "optimized Standard method" conforming to the recommendations of the Deutsche Gesellschaft f r Klinische Chemie.
Tab. 4. Application settings of the selected methods.
Method
Alanine aminotransferase a-Amylase
Creatine kinase γ-Glutamyltransferase Bilirubin
Cholesterol Creatinine Triacylglycerols UreaUric acid
Wavelengths main(nm)
340415 415340 546505 505505 340570
side(nm)
376660 376660 600700 570700 376660
Mea-suring points 19-^32 25-32 22-32 19-32 15/32 19-2332 19-2232 32
Measuring mode and time1 (min)
con 5.9—10 con7.8— 10 con 6.8 -10 con 5.9—10 EP 10 EP 10 kin 5.9-7.2 EP 10 kin 5.9-6.8 EP 10
Reaction Sample Sample ) course blank
incr./
decr.2) decr.
incr.
incr.
incr.
incr. -f incr. — incr.
incr. — decr.
incr. —
voiume (μΐ) 2020/103) 1010 105 205 55
Reagent voiume Rl
(μΐ) 350350 350350 350500 350500 350100
R2 (μΐ) 7070 7070 350—
—70 350100 ') kin = kinetic mode, EP
2) decr. = decreasing, incr.
3) 10 μΐ at 37 °C
Endpoint, con = continuous mode
= increasing
A c rryrpver constant can be calculated according to the fol- lowing relation;
K = roea na.-t ? )
mean (h5 - 15)
Reagent-related ca.rry-over can be caused by the reagent pipet- ti g System, the stirrer an<l th? cuvettes. Carry-over from the lactate dehydrogenase of the alanine aminotransferase assay to the lactate dehydrogenase assay caused by reagent sampling was checked in one centre. Reagents A and B were pipetted alternately, where represents the alanine aminotransferase and B the lactate dehydrogenase. For this experiment only, the reagent containing the lactate dehydrogenase (about 3000 U/l;
A 1) was pipetted before reagents l and 2 of B.
Similar studies with other reagent combinations such s cho- lesterol-uric acid and triacylglycerols-lipase were carried out by the evaluation group of Boehringer Mannheim, and are dis- cussed in the Results section.
Comparison of the analytical procedures Accuracy was examined by 3 experiments:
Mean values obtained in the between-day imprecision study were compared:
a) with the assigned values of the three control sera and b) with the mean value of the comparison method.
J. Clin. Chem. Clin. Bipchem. / Vol. 25,1987 / No. 12
Tab. 5. Control sera chosen for the Hitachi 704 evaluation.
Control serura*) Precinorm® U Precipath® U
Precinorm® E Precipath® E Precilip®
Precilip® EL Precibil
(Boehringer Mannheim GmbH, Mannheim M + D Moni-trol I
M H- D Moni-trol II
Lot.-No.
151407, 151621 1-595, 1-599 1-528, 150801 151464, 150456 150457, EV 704 3-372, 151935 3-344, 152147 1-376, 150817 151661 1-308, 153302 1-210
,FRG) 204104
(AHS/Deutschland GmbH, Bereich Merz + Dade, M nchen, FRG)
Validate® N Validate® A
(G decke AG, Freiburg, FRG) Kontrollogen^-L
Kontrollogen®-LP
(Behringwerke AG, Marburg/Lahn, FRG) Seronorm
Pathonorm L Pathonorm H
(E. Merck AG, Darmstadt, FRG)
5334113 5345113
623 124 C 623210 A
16220 20
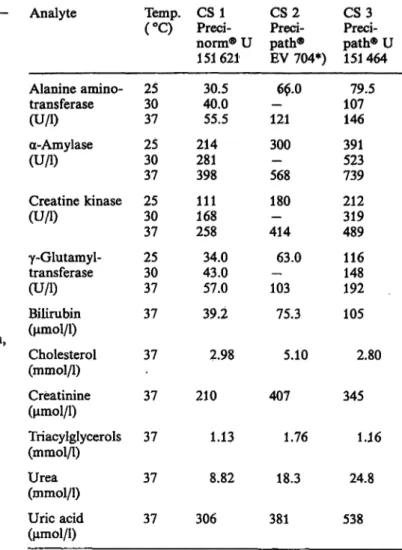
Tab. 6. Assigned 37 °P
J 1 \*>.
Analyte
Alanine amino- transferase (U/l) a-Amylase (U/l)
Creatine kinase (U/l)
γ-Glutamyl- transferase (U/l) Bilirubin (umol/i)
Vf*******/ V
Cholesterol (mmol/1) Creatinine (μπιοΐ/l) Triacylglycerols (mmol/l) Urea (mmol/1) Uric acid (μπιοΐ/l)
values of the control sera 1 — 3 at 25, 30 and Temp.
(°Q
2530 37 2530 37 2530 37 2530 37 37 37 37 37 37 37
*) enzyme activities for 30 CS1Preei- norm® U 151621
30.540.0 55.5 214281 398 111168 258 34.043.0 57.0 39.2
2.98 210
1.13 8.82 306
°C were not CS 2Preci- path®
EV 704*) 60.0 121 300 568 180 414— 63.0 103
75.3 5.10 407
1.76 18.3 381 declared.
CS3Preci- path® U 151 464 10779.5 146 391523 739 212319 489 116148 192 105
2.80 345
1.16 24.8 538
*) The Precinorm® U 151621, Precipath® EV 704 and Preci- path® U 151 464 were used s control sera l, 2 and 3 in the imprecision and recovery studies.
In a second experiment, up to 25 different control sera (de- pendent on the analyte) were measured in duplicate assays with the Hitachi 704 and the comparison method. The recoveries of the assigned value were calculated and compared with those for the comparison method.
Each of the 4 laboratories analysed 100 fresh human sera (10 sera per day for 10 days), covering the entire analytical r nge for each of the 10 analytes with the Hitachi 704 and the comparison Instrument. Both metbods were measured in par- allel.
Results
The ten methods were not chosen arbitrarily but were selected with a view to checking s many application settings of the Instrument s possible (e.g., wave- length, measuring points, sample and reagent volumes and reaction course). Nearly all performance criteria of the Instrument are covered by these ten analytical methods.
Imprecision
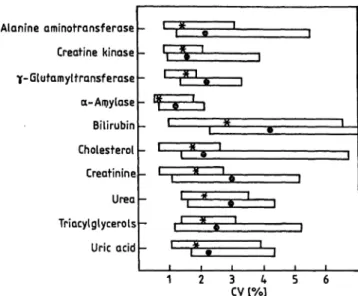
Figure 2 shows the Condensed data for the within-run imprecision of all participants and the three control sera.
Alanine aminotransferase Creatine kinase γ-Glutamyltransferase a-Amylase Bilirubin Cholesterol Creatinine Urea Triacylglycerols Uric acid
- 1 * |
-ra
- L* J -n» — ι -1 * |- cnn
- r^r-i - l * 1
1 1 1 1 1 1
1 2 3 4 5 6
CVl%]
Fig. 2. Within-run imprecision of 4 laboratories and 3 control sera.
For assigned values of the control sera see table 6.
CV = coef cient of Variation
* = median of the CV's
0 α = r nge of the CV's
J. Clin. Chem. Ciin, Biochem. / Vol. 25,1987 / No. 12
Bayer et al.: Multicentre evaluation of the Hitachi 704 925
The asterisks respresent the median and the blocks the r nge of the coefficients of Variation
4) for all laborat ries and control sera. The median of the CV for all 10 analytes is equal to or better than 1.6%.
Only for alanine aminotransferase, γ-glutamyltrans- ferase and uric acid does the CV exceed 2% (2.5%, 2.3% and 3.2% respectively).
Similar results were obtained for the within-run im- precision in human sera. Table 7 shows the data for a normal and pathological serum obtained by the laborat ries measuring at 37 °C.
Tab. 7. Within-run iinprecision in human sera with the Hitachi 704 at 37 °C (n = 21).
Analyte (unit)
Alanine aminotransferase (U/l)
a-Amylase (U/1)
Creatine kinase (U/l)
γ-Glutamyltransferase (U/l)
Bilirubin (μηιοΐ/ΐ) Cholesterol (mmol/1) Creatinine (μπκ>1/1) Triacylglycerols (mmol/1) Urea (mmol/1) Uric acid (μιηοΐ/ΐ)
Mean
2082 14397 90247 62 246 13.7 35.9 4.77 11.9 70.7 178
1.64 4.08 24.35.89 168 492
Coeflicient of Variation (%) 2.3
0.6 1.5 0.8 0.41.6 0.70.4 2.40.8 0.60.4 2.2 1.1 1.80.5 2.10.9 2.50.6
For the same control sera, figure 3 shows the CV of the between-day imprecision study for the Hitachi 704 and the comparison instrument. The CV is below 3%
exeept for alanine-=aminotransferase (3.1%), bilirubin (6.5%), urea (3,5%) and uric acid (3.9%). The median of the CV is around 2% (2.8% for bilirubiri and 0.7%
for amylase).
Figure 4 gives a more detailed presentation of the between-day imprecision data for the control sera l and 3, for one laboratory in each case. The impreci- sion of the Hitachi 704 is remarkably better than that of the comparison Instruments. This may be the case if a new instrument is compared with one that has been in routine use for years.
Alanine aminotransferase Creatine kinase γ- Glutamyl transf erase a-Amylase Bilirubin Cholesterol Creatinine Urea Triacylglycerols
Uric acid
4) Abbreviated to CV in the following text.
1 2 3 4 5 6
CV [%)
Fig. 3. Between-day imprecision of 4 laborat ries and 3 control sera for the Hitachi 704 and the comparison Instrument.
For assigned values of the control sera see table 6.
CV = coefficient of Variation
* = median of the CV's for the Hitachi 704
o = median of the CV's for the comparison Instrument D = r nge of the CV's, upper block for the Hitachi 704, lower block for the comparison Instrument
The relatively high CV (maximum 6.5%) of bilirubin reflects the instability of this analyte: the bilirubin value is dependent on the influence of light and the reconstitution time of the control serum. Therefore it lends itself poorly to instrument testing unless pre- analytical conditions (mainly reconstitution and stor- age) are standardized.
Drift
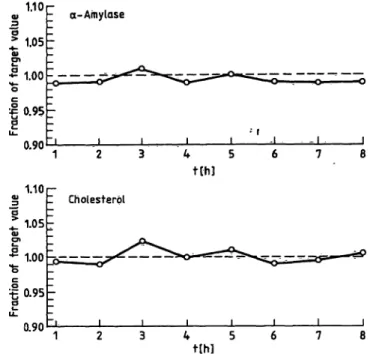
All data have been represented graphically. Only bil- irubin in one laboratory shows a severe drift because the pre-analytical conditions were not maintained.
For all other methods no drift was found. Figure 5 illustrates the excellent reproducibility for amylase and cholesterol over 8 hotirs.
Measuring r nge and linearity
The linearity study for alanine aminotransferase at 37 °C is shown in figure 6. In the left-hand diagram the measured activity is plotted against the target activity, which is obtained by regression calculation of the first 4 points, this being the segment more likely to be linear. The higher values tend to deviate more and more from the identity y = χ. Α better critical examination is possible for the right-hand diagram which shows the relative deviation of measured and expected values. The acceptance criteria for linearity was set at a limit of ± 5% from the expected value.
J. Clin. Chem. Clin. Biochem. / Vol. 25,1987 / No. 12
6 ςj _4
>Ρ
5>
^2 1
Precinorm®
-
. 7
\ • y,
6 5 4
^,<—3 δ2 1
~ - . - -F
[x
6 5 _ 4
°2 1
"ΙΊΙ
^
P
Y/U 151 621
Pfl
f?
— /
i
^Lab.1
£3 R ^
?7 r11! 1 1
Lob. 3
't^ i
—
Π R/Π &
W \ Γ vh ^
^ l ^ M ^
- Precipath® U 151 464 Lafa 2
(
»ti ,
t10™ / / / / /
"β
* 1.05
QlS1
•^ 1.00 - *o
ί Ι 0.95
/ y/ g
/ u_
/ 0.90 (37°C)
Ί P \l
OJ 1.10
=3
!l.OS
QJσ»
5 1.00
"l ^
r o
; 1 °· 95
/ Q^
n n/\
U.7U
(25 °C)
a-Amylase
~- _ -
"" ^r**^^^ ^^^^^^^^., ·Γ>·>
_°" '^^
L
"Ι ι l 1 1 . 1 - 1 1
1 9 q / C L·£ 3 « f D O 1/ AO
t [h]
—1 Cholesterol -
: ^^-^^
-^^^ ^^^^Ti - , ι r^0·»» . ,*·-/%
-v^—
I
~
~l 1 1 1 1 1 1 1
1 2 3 4 5 6 7 8
tlh]
Fig. 5. Eight-hour drift-experiment; recovery of -amylase and cholesterol in control serum 2.
--M M
5
~4
»— · j^ υ
1
ο
- -
1\
"~
',
ml
rflJl
ω ω(Λ (Λ
α αι_ c
οι ·=
Sl2
0)
ω
13
*»
Η- -^ — **. 6=
£ « >*«2 <
.- ·£ Q,
β ώ
1
o1
E a
pn 7> "" *7* V "1 ^
ί ? <Λ /
LI ιΐι
γ'f
^ \
Lab.4
1—1
£— I
ι iil 1
c: -Q oj α t·
·— t. C <U ~"
.— *W "^ ι
rz οι α s co o £ "L
1
(30°
r-.
|
J
Λ Tab. 8.
ΊΊ 1 Analyte C)
Alanine
Linearity on the Hitachi 704*).
Temp. Unit Linearity tested found up to
amino- 25 U/l 1350 1100 acA in iocs\ ncn
... U AllolClCLOV* «JV AO«^VI J J\J
π 37 1200 700
5 a-Amylase 25 U/l 1650 > 1650 ί 30 5200 3000
i 37 17ΠΛ >» 1ΤΠΛ•^ ' A / W <<^ A / \/\/
5 S Creatine kinase 25 U/l 1250 > 1250
•X
•n —i
5 ώ — · —er
ao
30 2000 1500
37 1200 ^ 1200
* γ-Glutamyl- 25 U/l 1500 ^ 1500
< σ *" transferase 30 2000 ^ 2000
Fig. 4. Between-day imprecision in each laboratory 704 and comparison Instrument).
For assigned
D
(Hitachi ilirubin 30 μιηοΙ/1 360 ^ 360 values of the control sera see table 6.
= Hitachi
= Hitachi704705(Lab. 2: Hitachi 737)
Cholesterol 25 mmol/1 25 > 25 Creatinine 25 μηιο1/1 2100 £ 2100 Triacylglycerols 25 mmol/1 13 ^ 1 3
In the given 700 U/l,
i.e.example the 5% deviation is attained at
Ureathe method is linear up to 700 U/L
37 inmol/1 57 47 Uricacid 25 μιηοΐ/ΐ 1370 1000
Table 8 summarizes the results of the linearity exper- iment. The measuring r nge is shown in the last column while the preceding column represents the values up to which the linearity has been checked. A wide linear measuring r nge was found, seldom re- quiring sample predilution.
Because the linearity was checked with fresh reagents, the linearity limits were even higher than those claimed by the manufacturer.
*) freshly prepared reagents. For the Substrates only the highest tested linearity is presented.
Carry-over
Table 9 shows results ffom the inVestigation of sam- ple-related carfy-over. Only the highest carry-over recorded by any laboratory for an analyte is reported in this table. The minimal and maximal values f the
J. Clin. Chem. Clin. Biochem. / Vol. 25,1987 / No. 12
Bayer et al.: Multicentre evaluation of the Hitachi 704
927
1200 r
§1000 g l 800
.H 60°
» 400
200
y=x/
/ o
0 200 400 600 800 1000 1200 Target catalytic concentration [U/U
0.90 200 400 600 800 1000 1200 χ l /U
Fig. 6. Linearity of alanine aminotransferase at 37 °C (lab. 1).
Tab. 9. Sample-related carry-over on the Hitachi 704.
Analyte
Alanine aminotransferase a-Amylase
Creatine kinase γ-Glutamyltransferase Bilirubin
Cholesterol Creatinine Triacylglycerols Urea
Uric acid
Unit
U/lU/l U/lU/l μπιοΐ/ΐ mmol/1 μίηοΐ/ΐ mmol/1 mmol/1 μιηοΐ/l
concen-High tration h
>4000 23502100 650170 107911.9 12.035.0 803
concen-Low tration l1)
25.1 66.033.0 24.0 10.12.25 76.9
0.622.83 334
l i - l s minimum
- 1.7 - 4.0 - 1.0 - 2.4 - 0.86 - 0.03 - 2.7 - 0.01 - 0.17 -14.3
median
0.31.0 0.00.0 -0.26 0.00.0 0.00.0 -1.8
maxi- mum 4.01.5 2.41.0 0.86 0.052.7 0.290.50 9.5
Standard devia- tion2) of 1s, U, 1s 0.591.98 0.520.95 0.800.02 1.590.05 0.208.7
r nge90%2) of 1* U, 1s
1.955.5 2.72.0 2.14
0.056.2 0.14 24.10.58
Carry- overconstant K - 1 04
0.350.88 - 0.48 - 2.112.1
00 26.015.4 -13.0
J) median of the ten values of 13, U and 15
2) n = 30
difference li —1
5s well s the median of the ten series are reported. In all cases the median is less than the Standard deviation of the low concentration. If the maximal value of the difference li—1
5is compared with the 90% r nge of the low concentration, the difference is lower than the r nge, except for triacyl- glycerols (twice the r nge). But this poor result for triacylglyeerols was found in only one of the ten series, so that the occurrence of systematic carry-over cannot be claimed.
We think that the comparison of the interference effect with the impre sion of the uninfluenced low values is more illustrative than the carry-over constant. As the carry-over effect is within the npise level of the detennination of the respective analyte, the diiference often becomes negative.
Reagent-dependent carry-over for the coinbination alanine aminotransferase to lactate dehydrogenase is negligible, values showing less than 10 U/l at 37 °C, i. e. less than 3% of the reference limit.
A carry-over caused by both the reagent pipettor and the cuvettes was found with the System cholesterol to uric acid. The uric acid results are increased by about 7.8 μιηοΐ/ΐ at 37 °C, if this assay is performed after a cholesterol assay, or in a cuvette which has previously been used for a cholesterol test. The cholesterol oxi- dase is responsible because it affects the colorimetric reagent of the uric acid test. Boehringer Mannheim has modified this enzyme, so that the carry-over is now negligible.
The lipase result is increased about 600 U/l if a lipase assay is performed after a triacylglycerol test. This is due to the lipase activity of the triacylglycerol reagent.
In the past it was recommended that the lipase assay should be run in batch-mode and with a separate cuvette ring. The latter is not necessary if the triacyl- glycerol test is programmed so that the reaction takes place in the first 5 minutes of the reaction cycle and then hydrochloric acid is added to deactivate the lipase in the reaction mixture. The sample carry-over
J. Clin. Chem. Clin. Biochem. / Vol. 25,1987 / No. 12
can be avoided, if both channels are separated frora
each other and a lipase assay is never requested after
Α(α
ηβ|εηΤ
Γν^
ΓαεΗθη° a triacylglycerol test. Taking these points into consid- aminotransferase eration the lipase assay can then be performed in the ^^^^
usual selective mode. o-Amyiase
Bilirubin Cholesterot
Comparison of analytical procedures Creatinine
r Urea
Recovery of the assigned value in control samples Triacyigiycerois
Uric acid
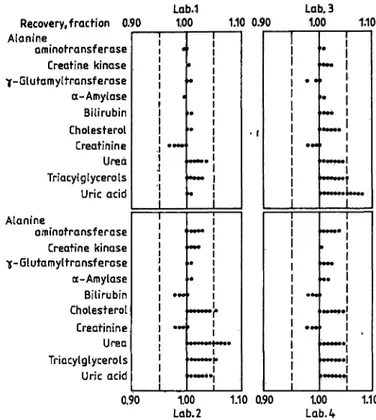
Figure 7 shows the recovery of assigned values for
· j r* i_ Alanine
control serum 1 . These results were obtainea irom the aminotransf erase mean of the between-day imprecision (n = 20 or 21; Creatine kinase
_ , Α χ ^ , .- γ-Glutamyltransferase
2nd of the duplicate measurements). Only the urea a-Amyiase and uric acid recoveries in laboratories 2 and 3, re- Bilirubin spectively, are clearly outside the + 5% limit, al- choiesteroi though they are within the ± 10% r nge. Similar ^^α results were found with the other two control sera. Triacyigiycerois Table 1 0 summarizes the results of the recovery studies
Unc QCldin 25 different control sera. The mean recovery (me-
asJ * \ · 1 Λ. ΛΓ\ί\ί\/ £ —.11 __.~1-.4. — .~ ,·.,!Λ.Λ~.
Lab.1 Lab, 3 K) 1;00 1.10 0.90 1.00 1.10
1
,
•
•
'
··«
··»
•
»·
•
W····
•
·»··
•
******
**~-
******
******
^ ' W·.·
'
•
• f
1
'
•
• ·
• M
···
···
'
^*
.
*
—
999999
··«··
»
*~
«·
«···
i-~"
1
.
~*.
>0 1.00 1.10 0.90 1.00 1.1 Lab.2 Lab. 4
dian) is very close to 100% for all analytes with extreme values ctf 99 and 104%. Hence the majority of deviations from the assigned value is within ± 5%.
A more marked deviation can be seen in the case of creatine kinase, with 7% of the values (4 labs with 20 to 25 sera) deviating more than 20% from the as- signed value. This is possibly due to the specific com- position of control sera from different sources, and the dependency on the reconstitution time. The de- viations (more than 10%) in the case of bilirubin can be explained by the instability of the analyte. The target value of creatinine is dependent on the method.
For both analytes the agreement with the comparison
• Instrument is good.
It should be mentioned that these results were estab- lished by a single experiment, whereas the mean of several independent series should be chosen for the examination of the accuracy.
Fig. 7. Recovery of assigned values for control serum l (lab. l to4).
Method comparison with patient specimens
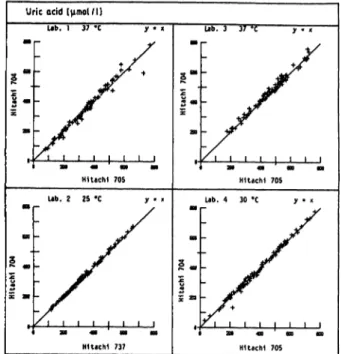
The statistical evaluation by a non-parametric method of Passing & Bablok (19, 20) yielded slopes for the regression line which are close to unity in all cases with extreme values of 0.95 and 1.06. The intercepts are negligible (see tab. 11). The medians of the rela- tive differences do not show any significant deviations from the comparison method. The results reflect close agreement with the comparison Instrument, i.e. the established laboratory method.
Plots for the comparison of methods are shown in figure 8. To improve the graphical presentation, not all figures show the whole measuring r nge.
Tab. 10. Recovery in 25 different control sera.
Distribution of the recoveries (in %) s a function of the % deviation from assigned value.
Analyte
Alanine aminotransferase a-Amylase
Creatine kinase γ-Glutamyltransferase Bilirubin
Choiesteroi Creatinine Triacyigiycerois UreaUric acid
Mean recovery
/ · J* \ c
(median) of assigned vaiues in %
103101 101101 102104 10399 101104
% Deviation 0 - <5 Distribution 5189
8188 6658 6955 8169
from assigned value
5 - <10 10 - <15 of the
369 129 2331 1935 1627
recoveries in % 91 03 153 107 22
15 - <20
30 00 40 23 12
£20
01 70 00 00 00
J. Clin. Chem. Clin. Biochem. / Vol. 25,1987 / No. 12
Bayer et al.: Multicentrc cvaluation of thc Hitachi 704 929 Tab. 11. Mcthod comparison with human sera on thc Hitachi 704 (y) and comparison Instrument (x) (Hitachi 705, Lab. l, 3, 4
and Hitachi 737, Lab. 2; n = 100).
Analyte (Unit)
Alanine aminotransfcrasc (U/l)
a-Amylase (U/l)
Creatinc kinase (U/l)
y-Glutamyltransferase (U/l)
Bilirubin (μπιοΐ/l)
Cholesterol (mmol/1)
Creatinine (μιηοΐ/ΐ)
Triacylglycerols (mmol/1)
Urea(mmol/1)
Uric acid (μπιοΐ/ΐ)
b.
31 24
31 24
31 24
31 24 13 42 31 24 31 24 31 24 13 24 13 42
Temp.
3737 2530 3737 2530 3737 2530 3737 2530 3737 2530 3737 2530 3737 2530 3737 2530 3737 2530 3737 2530
Range (from x)
4 - 4 6 5 7 - 9 0 0 3 -1929 5 - 427 23 -1235 9 -2206 13 -3906 36 - 630 4 -1101 27 -1859 4 -1037 8 -3200 7 - 728 6 -1872 3 - 951 6 -1900 6 - 775 1,5 - 451 1,7 - 296 3 - 397 * 0.93- 10.0 3.26- 15.0 1.40- 24.4 1.26- 14.3 24.8 -1048 61.9 -1676 44.2 -1087 26 - 674 0.43- 9.1 0.40- 15.5 0.49- 29.1 0.35- 9.67 2.50- 45.0 3.50- 55.8 2.50- 25.0 1.50- 43.2 79 - 767 175 -1122 119 - 660 31 - 861
Regression analysis y = bx + a b a 0.971.03 1.001.03 0.981.04 1.001.03 0.991.02 0.99 0.96 1.021.01 0.951.00 0.971.06 0.961.04 1.001.00 0.981.00 1.021.02 1.021.04 1.011.00 1.021.02 1.031.00 1.001.04 1.05 1.001.00 1.01
0.44 0.470.00 0.32 -1.251.00 -0.970.00 0.531.77 -1.82 2.79 0.920.80 0.160.00 -0.68 -0.34 -0.510.68 0.000.03 0.030.03 -0.88 -1.77 -0.88 -2.65 0.000.04 0.02 -0.01 -0.17 -0.21 0.00 0.06 -11.30
7.14 -0.590.00
Medi n rel. diff.
-0.47 0.003.86 3.29 -0.82 2.74 0.002.52 2.151.47 -6.25 -2.22 2.762.01 -5.17 0.00 -3.472.11 1.001.92 0.000.32 -1.35 0.48 0.400.81 2.851.28 1.281.59 2.87 1.48 -2.49 1.37 0.004.62 1.391.39 0.000.43
Interferences
Since the multicentre evaluation was primarily con- cerned with the Hitachi 704 Instrument and not with the reagents applied to it, interference studies were not carried out.
Assessment of practicability
In addition to the analytical perfofmance, character- istics such s reliability, practicability and Integration into the laboratory Organisation are important for the evaluation of an analytical Instrument. These attri-
butes cannot be measured accurately and no general evaluation protocol can be applied. Nevertheless, these points should be observed during the evaluation period. Only a brief summary of the impressions will be presented in the following.
No problems were associated with the Installation of the Hitachi 704. The laboratory staff was well ac- quainted with the Instrument within two days, which is normal for an operator with experience on other Hitachi analysers. The Instrument can be operated easily, and the data input is very simple. However, the characters of the keyboard are arranged alpha-
j. Clin. Chem. CUn. Biochem. / Vol. 25,1987 / No. 12
Alanine aminotransferase [U/l]
lab. l 37 "C
l I
Hitachi 705
l - s
\ \
Lab. 3 37 eC y · x
l l
Lab. 4 30 °C y » χ
Creatine kinase [U/11
l. 37 »c y = χ
Hitachi 705 Lab. 2 25 «C y = χ
Hitachi 737
lab. 3 37 «C y * χ
lab. 4 30 eC y « χ
'i
1'"!.""!
t-Glutomyltronsferase l U/11
lab. 1 37 "C y « χ
lab. 2 25 °C y » χ
lab. 3 37 °C y - χ
Lab. 4 30 °C y » χ
l l l
a-Amylase [U/l]
leb. l 37 "C y · χ
Hitachi 705
Lab. 2 25 °C y - χ
Lab. 3 37 °C y « χ
4 30 °C y β χ
Bilirubin (μπιοΙ/Π
Lab. 1 37 «C y » χ
_J l l
lab. 2 25 "C y > χ
lab. 3 37 °C y · χ
Lab. 4 30 «C y · χ
Cholesterol [mmol/l]
Lab. l 37 *C y · χ
Lab. 2 25 °C y - χ
r* ' ' ' i ' ' ' '
Hitachi 737
Lab. 3 37 «C y « χ
4 30 «C y · χ
J. Clin. Chem. CBn. Biochem. / Vol. 25,1987 / No. 12
Bayer et al.: Multicentre cvaluation of the Hitachi 704
931
Creatinine ΙμιηοΙ/Π
b. 1 37 *C y · χ
HHecM 705 b. 2 25 *C y · χ
Hitachi 737
b. 3 37 *C y · χ
Hitachi 705 lab. 4 30 «C y · χ
Ureo Immol/l]
lab. 1 37 ·€
Hitachi 705
Hitachi 737
b. 3 37 «C y «
b. 4 30 *C y · χ
Triacylglycerols tmmol/1]
lab. l 37 C~
tab. 2 25 *C
lab. 3 37 "C y " χ
Lab. 4 30 «C
Hitachi 705
Uric ocid ΙμΓηοΙ/Ι]
lab. \ 37 "C
Ub. 2 25 «C
HUacM 737
b. 3
Fig. 8. Method comparison from 4 laboratories.
betically, which is unusual for users who are famili r with the* conventional typewriter keyboard. On the other band, one can easily get accustomed to this arrangement.
For the frequently requested analytes the reagent bot- tles are too small for longer series. Boehringer Mann- heim will introduce concentrated reagents for more than ten methods so that at least twice the number of determinations per bottle can be made.
The ECCLS-protocol recommends a logbook in which any breakdown or defect of the Instrument is recorded. In our case, keeping this logbook was not actually necessary. There were no breakdowns in any of the laboratories at any time during the entire eval- uation period. Only during the initial trial in labora- tory 4, was there a problem with the light source of the photometer. This was recognized from the results of the day^to-day imprecision run. After exchange of the l mp, this Instrument ran without any fault.
Reliability and practicability, s well s the analytical Performance of the Hitachi 704, can be rated s ex- cellent. The Hitachi 704 is well suited for routine Operation and emergency analysis in small to medium- sized lab ratories,and s a back-up System for large laboratories.
Acknowledgement
We would like to thank Mrs. H. Hotschek, Mrs. L. Nykiel and Mr. P. Hajdusich (Vienna), Mrs. M ller-M ller (Munich), Mr.
A. Codeglimi (Milan), Mrs. C. Hennequin and Mrs. A. Nicolas (Paris) for their dedicated work in carrying out the analysis.
^urthennore, we thank Mr. R. Barembruch (Boehringer Mann- heim GmbH) for the support in the statistical evaluation.
J. Clin. Chem. Clin. Biochem. / Vol. 25,1987 / No. 12
References
1. Haeckel, R., Busch, E. W., Jennings, R. D., Kohholm, G.
& Truchaud, A. (1985) ECCLS Document 5, No. 6 (3rd draft).
2. Knedel, M., Haeckel, R., Seidel, D., Thiery, J., Vonder- schmitt, D. J., Haenseler, E., Hubbuch, A., Stockmann, W.
& Völkert, E. (1986) J. Clin. Chem. Clin. Biochem. 24, 409-432.
3. Empfehlungen der Deutschen Gesellschaft für Klinische Chemie (1970) J. Clin. Chem. Clin. Biochem. 8, 182-192.
4. Empfehlungen der Deutschen Gesellschaft für Klinische Chemie (1972) J. Clin. Chem. Clin. Biochem. 10,182-192.
5. Rauscher, E., Bülow, S. v., Neumann, U. & Schaich, E.
(1981) Ber. Österr. Ges. Klin. Chem. 4, 150.
6. Scholer, A. & Hohenwallner, W. (1984) J. Clin. Chem. Clin.
Biochem. 22, 677-684.
7. Szasz, G., Gruber, W. & Berat, E. (1976) Clin. Chem. 22, 650-656.
8. Gruber, W. (1978) Clin. Chem. 24, 177-178.
9. Persijn, J. P. & Van der Slik, W. (1976) J. Clin. Chem. Clin.
Biochem. 14, 421 -427.
10. Szasz, G. & Persijn, J. P. (1974) J. Clin. Chem. Cün.
Biochem. 12, 228.
11. Wahlefeld, A. W., Herz, G. & Berat, E. (1972) Scand. J.
Clin. Lab. Invest. 29, Suppl. 126, Abstract 11.12.
12. Seidel, J. Hagele, E. O., Ziegenhorn, J. & Wahlefeld, A. W.
(1983) Clin. Chem. 29, 1075-1080.
13. Bartels, H. (1972) Clin. Chem. Acta 37, 193-197.
14. Wahlefeld, A. W. (1969) Ann. Clin! feiochem. 6, 24.
15. Nagele, U., Hagele, E. O., Säuer, G., Wiedemann, E., Lehmann, R, Wahlefeld, A. W. & Gruber, W. (1984) J. Clin.
Chem. Clin. Biochem. 22* 165—174.
16. Neumann, U. & Ziegenhpra, J. (1977) XVI. Nordiska kon- gressen for klinisk kemi och klinisk fysiologi Oulu, Finland.
17. Klose, S. (1981) Boehringer Mannheim GmbH, pers. com- munication.
18. Broughton, P. M. G., Gowenlock, A. H., McCormack, J.
J. & Neill, D. W. (1984) Ann. Clin. Biochem. 11, 207-218.
19. Passing, H. & Bablok, W. (1983) J. Clin. Chem. Clin.
Biochem. 21, 709-720.
20. Passing, H. & Bablok, W. (1984) J. Cim. Chem. Clin.
Biochem. 22, 431-445.
Dr. W. Stockmanh
Boehringer Mannheim GmbH Sandhofer Straße 116
D-6800 Mannheim 31
J. Clin.Chem. Clin. Biochem. /Vol. 25,1987 / No. 12