Evaluation Patterns for Analyzing the Costs of Enterprise Information Systems
Bela Mutschler1and Manfred Reichert2
1 Business Informatics, University of Applied Sciences Ravensburg-Weingarten, Germany bela.mutschler@hs-weingarten.de
2 Institute of Databases and Information Systems, University of Ulm, Germany manfred.reichert@uni-ulm.de
Abstract. Introducing enterprise information systems (EIS) is usually associated with high costs. It is therefore crucial to understand those factors that determine or influence these costs. Existing cost analysis methods are difficult to apply. Par- ticularly, these methods are unable to cope with the dynamic interactions of the many technological, organizational and project-driven cost factors, which specif- ically arise in the context of EIS. Picking up this problem, in previous work we introduced the EcoPOST framework to investigate the complex cost structures of EIS engineering projects through qualitative cost evaluation models. This pa- per extends this framework and introduces a pattern-based approach enabling the reuse of EcoPOST evaluation models. Our patterns do not only simplify the design of EcoPOST evaluation models, but also improve the quality and com- parability of cost evaluations. Therewith, we further strengthen our EcoPOST framework as an important tool supporting EIS engineers in gaining a better un- derstanding of those factors that determine the costs of EIS engineering projects.
Keywords: Information Systems Engineering, Cost Analysis, Evaluation Models, Patterns.
1 Introduction
While the benefits of enterprise information systems (EIS) are usually justified by im- proved process performance [1], there exist no approaches for systematically analyzing related cost factors and their dependencies. Though software cost estimation has re- ceived considerable attention during the last decades [2] and has become an essential task in software engineering, it is difficult to apply existing approaches to EIS, par- ticularly if the considered EIS shall support business processes. This difficulty stems from the inability of these approaches to cope with the numerous technological, or- ganizational and project-driven cost factors which have to be considered for process- aware EIS (and which do only partly exist in data- or function-centered information systems). As example consider the costs which emerge when redesigning business pro- cesses. Another challenge deals with the many dependencies existing between different cost factors. Activities for business process redesign, for example, can be influenced by intangible impact factors like available process knowledge or end user fears. These dependencies, in turn, result in dynamic effects which influence the overall costs of EIS
engineering projects. Existing evaluation techniques [3] are typically unable to deal with such dynamic effects as they rely on too static models based upon snapshots of the considered software system.
What is needed is an approach that enables project managers and EIS engineers to model and investigate the complex interplay between the many cost and impact factors that arise in the context of EIS. This paper is related to the EcoPOST methodology, a sophisticated and practically validated, model-based methodology to better understand and systematically investigate the complex cost structures of EIS engineering projects [4, 5]. Specifically, this paper extends previously described concepts [6, 7] and intro- duces a pattern-based approach to enable the reuse of EcoPOST evaluation models.
Using the presented evaluation patterns does not only simplify the design of EcoPOST evaluation models, but also improves the quality of EcoPOST cost evaluations.
Section 2 summarizes the EcoPOST methodology. This background information is needed for understanding this work. Section 3 introduces evaluation patterns for design- ing evaluation models. Section 4 deals with the use of our evaluation patterns. Section 5 discusses related work. Section 6 concludes with a summary.
2 The EcoPOST Cost Analysis Methodology - A Brief Summary
We designed the EcoPOST methodology [3–7] to ease the realization of process-aware EIS. The EcoPOST methodology comprises seven steps (cf. Fig. 1). Step 1 concerns the comprehension of an evaluation scenario. This is crucial for developing problem- specific evaluation models. Steps 2 and 3 deal with the identification of two different kinds of Cost Factors representing costs that can be quantified in terms of money (cf.
Table 1): Static Cost Factors (SCFs) and Dynamic Cost Factors (DCFs).
SCF Static Cost Factors (SCFs) represent costs whose values do not change during an EIS engineering project (except for their time value, which is not further considered in the following). Typical examples: software license costs, hardware costs and costs for external consultants.
DCF Dynamic Cost Factors (DCFs), in turn, represent costs that are determined by activities related to an EIS engineer- ing project, e.g. process modelling, requirements elicitation and definition, process implementation and adaptation.
These activities cause measurable efforts which, in turn, vary due to the influence of intangible impact factors.
Table 1. Cost Factors.
Step 4 deals with the identification of Impact Factors (ImFs), i.e., intangible factors that influence DCFs and other ImFs. We distinguish between organizational, project- specific, and technological ImFs. ImFs cause the value of DCFs (and other ImFs) to change, making their evaluation a difficult task to accomplish. As examples consider factors such as ”End User Fears”, ”Availability of Process Knowledge”, or ”Ability to (re)design Business Processes”. Also, ImFs can be static or dynamic (cf. Table 2).
Static ImF Static ImFs do not change, i.e., they are assumed to be constant during an EIS engineering project; e.g., when there is a fixed degree of user fears, process complexity, or work profile change.
Dynamic ImF
Dynamic ImFs may change during an EIS engineering project, e.g., due to interference with other ImFs.
As examples consider process and domain knowledge which is typically varying during an EIS engineering project (or a subsidiary activity).
Table 2. Impact Factors.
Unlike SCFs and DCFs the values of ImFs are not quantified in monetary terms. Instead, they are ”quantified” by experts using qualitative scales describing the degree of an ImF.
As known from software cost estimation models, such as COCOMO [2], qualitative scales we use comprise different ”values” (ranging from ”very low” to ”very high”) expressing the strength of an ImF on a given cost factor.
Generally, dynamic evaluation factors (i.e., DCFs and dynamic ImFs) are difficult to comprehend. In particular, intangible ImFs (i.e., their appearance and impact in EIS en- gineering projects) are not easy to follow. When evaluating the costs of EIS engineering projects, therefore, DCFs and dynamic ImFs constitute a major source of misinterpre- tation and ambiguity. To better understand and to investigate the dynamic behavior of DCFs and dynamic ImFs, we introduce the notion of evaluation models as basic pillar of the EcoPOST methodology (Step 5; cf. Section 2.2). These evaluation models can be simulated (Step 6) to gain insights into the dynamic behavior (i.e., evolution) of DCFs and dynamic ImFs (Step 7). This is important to effectively control the design and im- plementation of EIS as well as the costs of respective projects. Note that EcoPOST evaluation models can be designed and simulations can be performed using any System Dynamics modeling and simulation tool. In our case, we used the tool ”Vensim”.
Impact Factors (ImF) Dynamic Cost Factors (DCF)
Static Cost Factors (SCF)
Steps 2 - 4 Step 5 Step 6
Design of Evaluation Models
Step 1 Step 7
Deriving Conclusions Simulation of
Evaluation Models Evaluation Context
Fig. 1. Basic EcoPOST Methodology (without Evaluation Patterns).
2.1 Evaluation Models
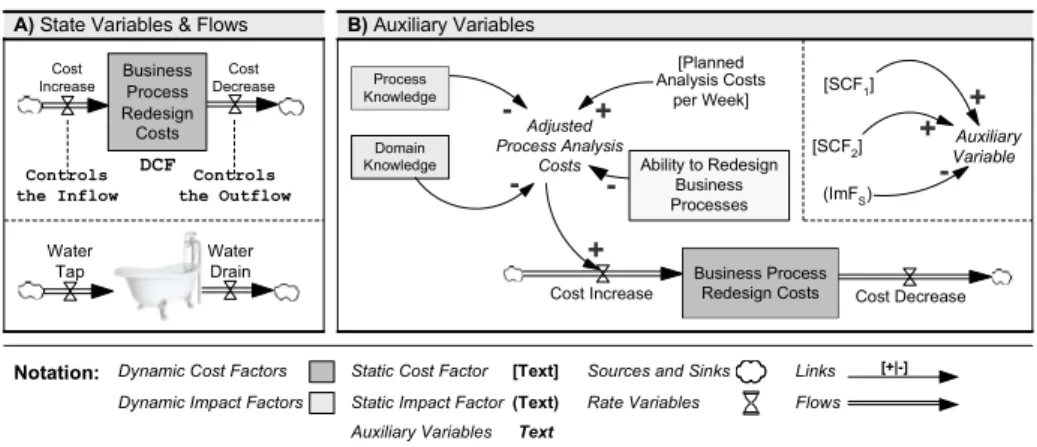
In EcoPOST, dynamic cost/impact factors are captured and analyzed by evaluation models which are specified using the System Dynamics [8] notation (cf. Fig. 2). An evaluation model comprises SCFs, DCFs, and ImFs corresponding to model variables.
Different types of variables exist. State variables can be used to represent dynamic factors, i.e., to capture changing values of DCFs (e.g., the ”Business Process Redesign Costs”; cf. Fig. 2A) and dynamic ImFs (e.g., ”Process Knowledge”). A state variable is graphically denoted as rectangle (cf. Fig. 2A), and its value at time t is determined by the accumulated changes of this variable from starting point t0to present moment t (t>t0) – similar to a bathtub which accumulates at a defined moment t the amount of water poured into it in the past. Typically, state variables are connected to at least one source or sink which are graphically represented as cloud-like symbols (except for state variables connected to other ones) (cf. Fig. 2A). Values of state variables change through inflows and outflows. Graphically, both flow types are depicted by twin-arrows which either point to (in the case of an inflow) or out of (in the case of an outflow) the state variable (cf. Fig. 2A). Picking up again the bathtub image, an inflow is a pipe that adds water to the bathtub, i.e., inflows increase the value of state variables. An outflow, by contrast, is a pipe that purges water from the bathtub, i.e., outflows decrease the
value of state variables. The DCF ”Business Process Redesign Costs” shown in Fig.
2A, for example, increases through its inflow (”Cost Increase”) and decreases through its outflow (”Cost Decrease”). Returning to the bathtub image, we further need ”water taps” to control the amount of water flowing into the bathtub, and ”drains” to specify the amount of water flowing out. For this purpose, a rate variable is assigned to each flow (graphically depicted by a valve; cf. Fig. 2A). In particular, a rate variable controls the inflow/outflow it is assigned to based on those SCFs, DCFs, and ImFs which influence it. It can be considered as an interface which is able to merge SCFs, DCFs, and ImFs.
A) State Variables & Flows
Costs Business
Process Redesign
Controls the Inflow
Controls the Outflow DCF
Cost Increase
Cost Decrease
Auxiliary Variables
Rate Variables
Dynamic Cost Factors Sources and Sinks
Dynamic Impact Factors
Text Static Cost Factor [Text]
Static Impact Factor(Text) B) Auxiliary Variables
Cost Increase Cost Decrease
Adjusted Process Analysis
Costs
- -
+
Analysis Costs per Week]
+
Water Tap
Water Drain
[SCF1]
[SCF2] (ImFS)
Auxiliary Variable
+ + - -
Business Process Redesign Costs Ability to Redesign
Business Processes [Planned
Notation:
Flows Links [+|-]
Process Knowledge
Domain Knowledge
Fig. 2. Evaluation Model Notation and Initial Examples.
Besides state variables, evaluation models may comprise constants and auxiliary vari- ables. Constants are used to represent static evaluation factors, i.e., SCFs and static ImFs. Auxiliary variables, in turn, represent intermediate variables and typically bring together – like rate variables – cost and impact factors, i.e., they merge SCFs, DCFs, and ImFs. As example consider the auxiliary variable ”Adjusted Process Analysis Costs” in Fig. 2B. It merges the three dynamic ImFs ”Process Knowledge”, ”Domain Knowl- edge” and ”Ability to Redesign Business Processes”, and the SCF ”Planned Analysis Costs per Week”. Both constants and auxiliary variables are integrated into an evalu- ation model with labeled arrows denoted as links (not flows). A positive link (labeled with ”+”) between x and y (with y as dependent variable) indicates that y will tend in the same direction if a change occurs in x. A negative link (labeled with ”-”) expresses that the dependent variable y will tend in the opposite direction if x changes.
EcoPOST evaluation models are useful for EIS engineers and project managers.
However, the evolution of DCFs and dynamic ImFs is still difficult to comprehend.
Thus, we added a simulation component to our evaluation framework (cf. Fig. 1).
2.2 Understanding Model Dynamics through Simulation
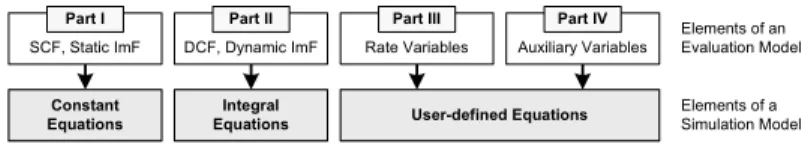
To enable simulation of an evaluation model we need to formally specify its behavior by means of a simulation model. We use mathematical equations for this purpose. Thereby, the behavior of each model variable is specified by one equation (cf. Fig. 3), which
describes how a variable is changing over time from simulation start. Details on the specification of simulation models can be found in [3, 9].
Constant Equations
Integral
Equations User-defined Equations SCF, Static ImF DCF, Dynamic ImF Rate Variables Auxiliary Variables
Elements of an Evaluation Model
Elements of a Simulation Model
Part I Part II Part III Part IV
Fig. 3. Elements of a Simulation Model.
Generally, results of a simulation enable EIS engineers to gain insights into causal dependencies between organizational, technological, and project-specific factors. This helps them to better understand resulting effects and to develop a concrete ”feeling” for the dynamic implications of EcoPOST evaluation models. To investigate how a given evaluation model ”works” and what might change its behavior, we simulate the dynamic implications described by it – a task which is typically too complex for human mind. In particular, we conduct ”behavioral experiments” based on a series of simulation runs.
During these simulation runs selected parameters are changed in a controlled manner to systematically investigate their effects within an evaluation model, i.e., to investigate how the output of a simulation will vary if its initial condition is changed. This proce- dure is also known as sensitivity analysis. Simulation outcomes can be further analyzed using graphical charts (generated by the used simulation tool).
2.3 Applying EcoPOST in Practice: Experiences and Lessons Learned
We applied the EcoPOST framework in several case studies in the automotive domain.
This has made us aware of a number of critical success factors which foster the transfer of the EcoPOST framework into practice.
First, it is important that EcoPOST users get enough time to become familiar with the provided evaluation concepts. Note that EcoPOST exhibits a comparatively large number of different concepts and tools, such that it will need some time to effectively apply them. In practice, this can be a barrier for potential users. However, this complex- ity quickly decreases through gathered experiences.
Second, it is crucial that results of EcoPOST evaluations are carefully documented.
This does not only enable their later reuse, it also allows to reflect on past evaluations and lessons learned as well as to reuse evaluation data. For that purpose, the EcoPOST Cost Benefit Analyzer can be used, which is a tool we developed to support the use of EcoPOST [3]. For example, it enables storage of complete evaluation scenarios, i.e., evaluation models and their related simulation models.
Third, evaluation models should be validated in an open forum where stakehold- ers such as policy makers, project managers, EIS architects, software developers, and consultants have the opportunity to contribute to the model evolution process.
Finally, the use of EcoPOST has shown that designing evaluation models can be a complicated and time-consuming task. Evaluation models can become complex due to the high number of potential cost and impact factors as well as the many causal dependencies that exist between them. Evaluation models we developed to analyze a
large EIS engineering project in the automotive domain, for example, comprise more than ten DCFs and ImFs and more than 25 causal dependencies [3]. Taking the approach described so far (cf. Section 2), each evaluation and each simulation model would have to be designed from scratch. Besides additional efforts, this results in an exlusion of existing modeling experience, and prevents the reuse of both evaluation and simulation models. In response to this problem, we introduce a set of reusable evaluation patterns.
3 EcoPOST Evaluation Patterns
EIS engineering projects often exhibit similarities, e.g., regarding the appearance of cer- tain cost and impact factors. We pick up these similarities by introducing customizable patterns. This shall increase model reuse and facilitate practical use of our EcoPOST framework. Evaluation patterns (EPs) do not only ease the design and simulation of evaluation models, but also enable reuse of evaluation information. This is crucial to foster practical applicability of the EcoPOST framework.
Specifically, we introduce an evaluation pattern (EP) as a predefined, but customiz- able EcoPOST model, i.e., EPs can be built based on same elements as introduced in Section 2. An EP consists of an evaluation model and an associated simulation model.
More precisely, each EP constitutes a template for a specific DCF or ImF as it typically exists in many EIS engineering projects. Moreover, we distinguish between primary EPs (cf. Section 3.2) and secondary ones (cf. Section 3.3).
A primary EP describes a DCF whereas a secondary EP represents an ImF. We denote an EP representing an ImF as secondary as it has a supporting role regarding the design of EcoPOST cost models based on primary EPs.
The decision whether to represent cost/impact factors as static or dynamic factors in EPs also depends on the model designer. Many cost and impact factors can be modeled both as static or dynamic factors. Consequently, EPs can be modeled in alternative ways.
This is valid for all EPs discussed in the following.
3.1 Research Methodology and Pattern Identification
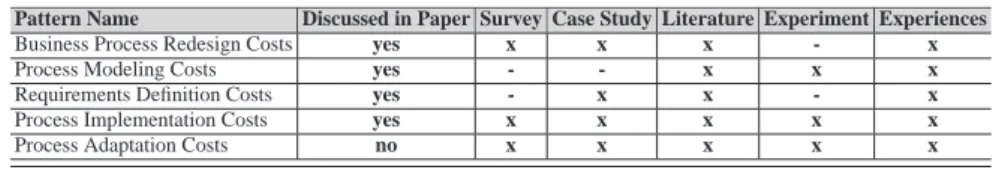
As sources of our patterns (cf. Tables 3 and 4) we consider results from surveys [5], case studies [3, 10], software experiments [4], and profound experiences we gathered in EIS engineering projects in the automotive domain. These projects addressed a variety of typical settings in enterprise computing which allows us to generalize our experiences.
Pattern Name Discussed in Paper Survey Case Study Literature Experiment Experiences
Business Process Redesign Costs yes x x x - x
Process Modeling Costs yes - - x x x
Requirements Definition Costs yes - x x - x
Process Implementation Costs yes x x x x x
Process Adaptation Costs no x x x x x
Table 3. Overview of primary Evaluation Patterns and their Data Sources.
To ground our patterns on a solid basis we first create a list of candidate patterns. For generating this initial list we conduct a detailed literature review and rely on our ex- perience with EIS-enabling technologies, mainly in the automotive industry. Next we
thoroughly analyze the above mentioned material to find empirical evidence for our candidate patterns. We then map the identified evaluation data to our candidate patterns and - if necessary - extend the list of candidate patterns.
Pattern Name Discussed in Paper Survey Case Study Literature Experiment Experiences
Process Knowledge yes x - x x x
Domain Knowledge yes x - x x x
Process Evolution yes x - x - x
Process Complexity yes - - x - -
Process Maturity no - - x - x
Work Profile Change no x - x x x
End User Fears no x x x - x
Table 4. Overview of secondary Evaluation Patterns and their Data Sources.
A pattern is defined as a reusable solution to a commonly occurring problem. We re- quire each of our evaluation patterns to be observed at least three times in different settings of literature and our empirical research. Only those patterns, for which enough empirical evidence exists, are included in the final list of patterns, which is presented in the following. Also note that these patterns represent a first baseline which clearly needs to be extended in future. This includes a deeper analysis of additional cost areas such as data modelling or system configuration efforts.
3.2 Primary Evaluation Patterns
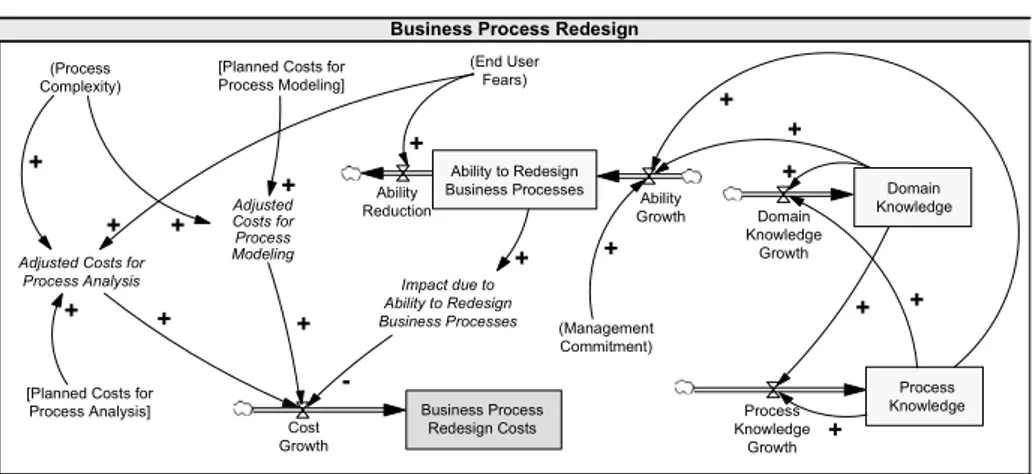
Business Process Redesign Costs. The EP shown in Fig. 4 deals with the costs of business process redesign activities. Prior to EIS development such activities become necessary for several reasons. As examples consider the need to optimize business pro- cess performance or the goal of realizing a higher degree of process automation.
Business Process Redesign
Business Process Redesign Costs Cost
Growth
Process Knowledge Ability
Growth (End User
Fears)
(Management Commitment) Adjusted Costs for
Process Analysis
Adjusted Costs for Process Modeling
+ +
Domain Knowledge
Growth
Process Knowledge
Growth
+ +
+
+
(Process Complexity)
[Planned Costs for Process Analysis]
[Planned Costs for Process Modeling]
+ +
+
+ +
+ +
Ability Reduction
Impact due to Ability to Redesign Business Processes
Ability to Redesign
Business Processes Domain
Knowledge
+
+
-
+
Fig. 4. Primary Evaluation Pattern: Business Process Redesign Costs.
This EP is based on our experiences (from several process redesign projects) that busi- ness process redesign costs are primarily determined by two SCFs: ”Planned Costs for Process Analysis” and ”Planned Costs for Process Modeling”. While the former SCF
represents planned costs for accomplishing interviews with process participants and costs for evaluating existing process documentation, the latter SCF concerns costs for transforming gathered process information into a new process design. Process redesign costs are thereby assumed to be varying, i.e., they are represented as DCF.
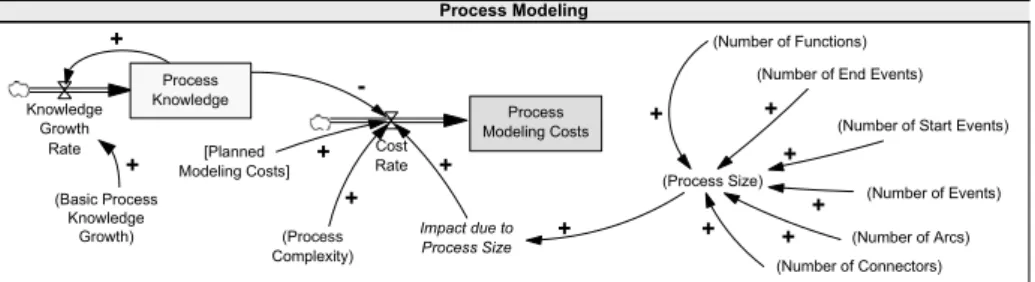
Process Modeling Costs. The EP shown in Fig. 5 deals with the costs of process mod- eling activities in EIS engineering projects. Such activities are typically accomplished to prepare the information gathered during process analysis, to assist software devel- opers in implementing the EIS, and to serve as guideline for implementing the new process design (in the organization). Generally, there exist many notations that can be used to specify process models. Our EP, for example, assumes that process models are expressed as event-driven process chains (EPC).
Process Modeling
Process Modeling Costs Cost
Rate [Planned
Modeling Costs]
(Process Size)
(Process Complexity) Knowledge
Growth Rate
-
(Number of Events) (Number of Functions)
(Number of Connectors) (Number of Arcs)
+ +
+ +
(Number of Start Events) (Number of End Events)
+ +
Impact due to Process Size
+
Process Knowledge
+ +
+
+
(Basic Process Knowledge
Growth)
+
Fig. 5. Primary Evaluation Pattern: Process Modeling Costs.
Basically, this EP (cf. Fig. 5) reflects our experiences that ”Process Modeling Costs” are influenced by three ImFs: the two static ImFs ”Process Complexity” and ”Process Size”
(whereas the impact of process size is specified based on a table function transforming a given process size into an EcoPOST impact rating [3]) and the dynamic ImF ”Process Knowledge” (which has been also confirmed by our survey described in [3]). The ImF
”Process Complexity” is not further discussed here. Instead, we refer to [3] where this ImF has been introduced in detail. The ImF ”Process Size”, in turn, is characterized based on (estimated) attributes of the process model to be developed. These attributes depend on the used modeling formalism. As aforementioned, the EP from Fig. 5 builds on the assumption that the EPC formalism is used for process modeling. Taking this formalism, we specify process size based on the ”Number of Functions”, ”Number of Events”, ”Number of Arcs”, ”Number of Connectors”, ”Number of Start Events”, and
”Number of ”End Events”. Finally, the DCF ”Process Modeling Costs” is also influ- enced by the dynamic ImF ”Process Knowledge” (assuming that increasing process knowledge results in decreasing modeling costs). Level of process knowledge increases with costs (the comprehensiveness of the modeled process increases over time).
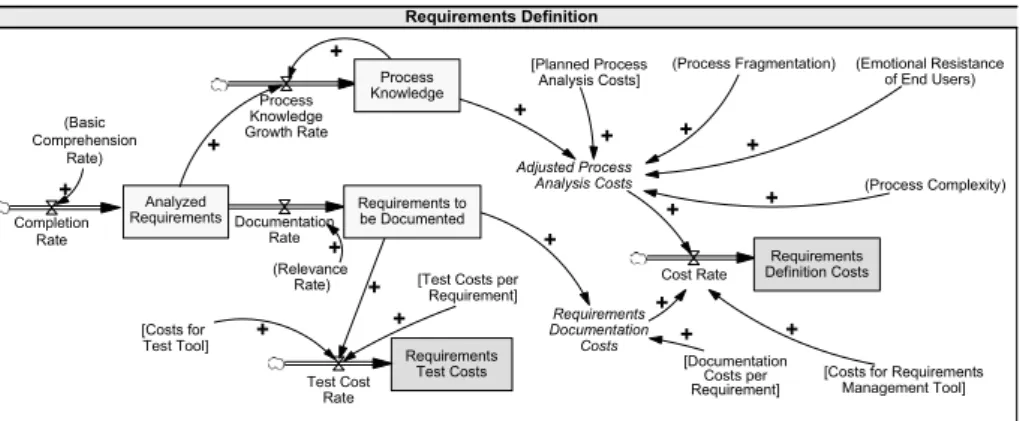
Requirements Definition Costs. The EP from Fig. 6 deals with costs for defining and eliciting requirements [3]. It is based on the two DCFs ”Requirement Definition Costs”
and ”Requirement Test Costs” as well as on the ImF ”Requirements to be Documented”.
This EP reflects our observation from practice that the DCF ”Requirements Definition Costs” is determined by three main cost factors: costs for a requirements management
tool, process analysis costs, and requirements documentation costs. Costs for a require- ments management tool are constant and are therefore represented as SCF. The auxiliary variable ”Adjusted Process Analysis Costs”, in turn, merges the SCF ”Planned Process Analysis Costs” with four process-related ImFs: ”Process Complexity”, ”Process Frag- mentation”, ”Process Knowledge”, and ”Emotional Resistance of End Users” (whereas only process knowledge is represented as dynamic ImF).
Requirements Definition
Cost Rate [Planned Process
Analysis Costs]
Adjusted Process Analysis Costs
+
+
(Process Complexity) (Process Fragmentation) (Emotional Resistance
of End Users)
+ +
Process Knowledge Growth Rate
+
+
Requirements Documentation
Costs
[Costs for Requirements Management Tool]
Analyzed Requirements Completion
Rate
Documentation Rate (Basic
Comprehension Rate)
+
[Documentation Costs per Requirement]
(Relevance Rate)
Requirements Test Costs Test Cost
Rate
[Test Costs per Requirement]
[Costs for Test Tool]
Requirements to be Documented
Process Knowledge
Requirements Definition Costs
+
+ + + +
+ + +
+ +
Fig. 6. Primary Evaluation Pattern: Requirements Definition Costs.
Costs for documenting requirements (represented by the auxiliary variable ”Require- ments Documentation Costs”) are determined by the SCF ”Documentation Costs per Requirement” and by the dynamic ImF ”Requirements to be Documented”. The lat- ter ImF also influences the dynamic ImF ”Process Knowledge” (resulting in a positive link from ”Analyzed Requirements” to the rate variable ”Process Knowledge Growth Rate”). ”Requirements Test Costs” are determined by two SCFs (”Costs for Test Tool”
and ”Test Costs per Requirement”) and the dynamic ImF ”Requirements to be docu- mented” (as only documented requirements need to be tested). Costs for a test tool and test costs per requirement are assumed to be constant (and are represented as SCFs).
Process Implementation
Process Implementation Costs Cost
Rate Adjusted Process
Modeling Costs [Data Modeling
Costs]
Adjusted Form Design Costs
Adjusted User/Role Management Costs
[Test Costs] [Miscellaneous Costs]
- +
+
+ + +
Domain Knowledge Growth Rate
Process Knowledge Growth Rate
+
+
(Process Complexity)
[Planned Process Modeling Costs]
[Planned User/Role Management Costs]
+
+ +
(Technical Maturity of Process Management Platform)
(Experiences in using Process Management Platform)
(Usability of Process Management Platform)
(Quality of Product Documentation) [Planned Form
Design Costs]
- + -
-
-
Process Knowledge Domain Knowledge
-
- -
Fig. 7. Primary Evaluation Pattern: Process Implementation Costs.
Process Implementation Costs. The EP shown in Fig. 7 deals with costs for imple- menting a process and the interference of these costs through impact factors [3]. An additional EP (not shown here) deals with the costs caused by adapting the process(es) supported by an EIS. This additional EP is identical to the previous EP ”Process Imple- mentation Costs” – except for the additional ImF ”Process Evolution”.
3.3 Secondary Evaluation Patterns
Process Knowledge. Fig. 8 shows an EP which specifies the ImF ”Process Knowl- edge”, i.e., causal dependencies on knowledge about the process(es) to be supported.
Process Knowledge
Process Knowledge Growth Rate +
+
Ability
+ Rate Domain
Knowledge Growth Rate
+ (Emotional Resistance of End Users)
-
(Process Complexity)
(Process Fragmentation)
- + -
Domain Knowledge
Ability to Acquire Process Knowledge
Process Knowledge
Fig. 8. Secondary Evaluation Pattern: Process Knowledge.
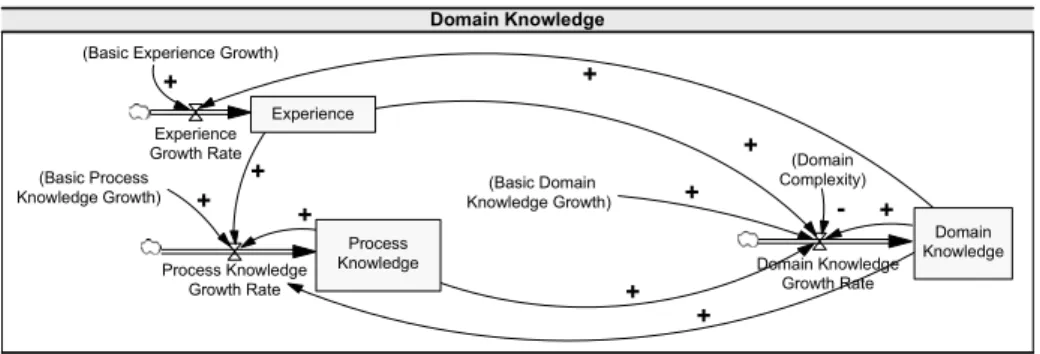
Domain Knowledge. The EP from Fig. 9 deals with the evolution of domain knowledge along the course of an EIS engineering project. Our practical experiences allow for the conclusion that ”Domain Knowledge” is a dynamic ImF influenced by three other ImFs:
the period an EIS engineer is working in a specific domain (captured by the dynamic ImF ”Experience”), the dynamic ImF ”Process Knowledge”, and the complexity of the considered domain (represented by the static ImF ”Domain Complexity”).
Domain Knowledge
Domain Knowledge Growth Rate
+
Process Knowledge Growth Rate
+
+
(Domain Complexity)
+ -
Experience
Growth Rate +
(Basic Experience Growth)
+ +
(Basic Process
Knowledge Growth) + (Basic Domain
Knowledge Growth) +
Experience
Process Knowledge
Domain Knowledge
+
Fig. 9. Secondary Evaluation Pattern: Domain Knowledge.
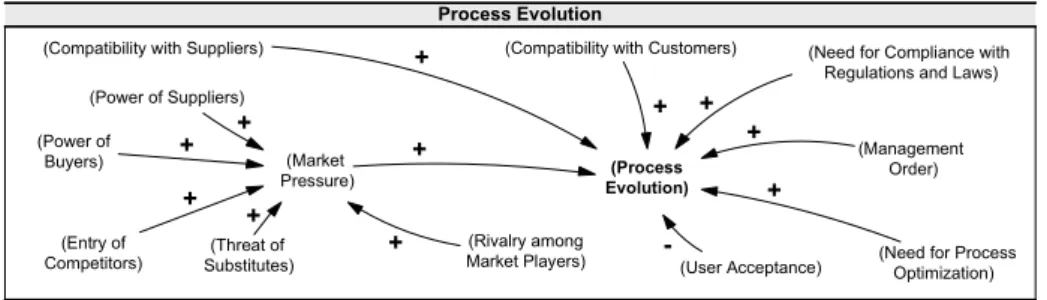
Process Evolution. The EP shown in Fig. 10 covers the static ImF ”Process Evolu- tion”. Specifically, it describes origins of process evolution. Basically, this EP reflects
the assumption that business process evolution is caused by various drivers. Note that arbitrary drivers of evolution can be included in the EP.
Process Evolution
(Entry of Competitors)
(Threat of Substitutes) (Power of
Buyers)
(Power of Suppliers)
(Rivalry among Market Players) (Market
Pressure)
+ +
+ +
+
(Need for Compliance with Regulations and Laws)
(Need for Process Optimization) (Process
Evolution)
+
+
+
(User Acceptance) (Compatibility with Suppliers) (Compatibility with Customers)
+
+
-
(Management Order)
+
Fig. 10. Secondary Evaluation Pattern: Business Process Evolution.
Process Complexity. The EP from Fig. 11 deals with the ImF ”Process Complexity”.
Note that this EP does not specify process complexity itself, but defines it based on an easier manageable replacement factor. In our context, this replacement factor cor- responds to the complexity of the process model describing the business process to be supported [11]. Thus, we extend process complexity to ”Process Complexity / Process Model Complexity”. The EP from Fig. 11 further aligns with the assumption that re- spective process models are formulated using EPC notation. According to the depicted EP, the static ImF ”Process Complexity/Process Model Complexity” is determined by four other static ImFs: ”Cycle Complexity”, ”Join Complexity” (JC), ”Control-Flow Complexity” (CFC), and ”Split-Join-Ratio” (SJR) (whereas the latter ImF is derived from the SCFs ”Join Complexity” and ”Control-Flow Complexity”).
Process Complexity (based on the Complexity of EPC Process Models) (Process
Complexity/
(Cycle Complexity)
(Control Flow Complexity )
(Join Complexity)
(Split-Join- Ratio)
+ +
+ +
+
Process Model +
Complexity)
Fig. 11. Secondary Evaluation Pattern: Process Complexity.
The complexity driver ”Cycle Complexity” is confirmed in [12, 13]. Arbitrary cycles, for example, can lead to EPC models without clear semantics (cf. [14] for examples).
The ImF ”Control-Flow Complexity” is characterized by [11]. It is based on the ob- servation that the three split connector types in EPC models introduce a different de- gree of complexity. According to the number of potential post-states an AND-split is weighted with 1, an XOR-split is weighted with the number of successors n, and an OR-split is weighted with 2n−1. The sum of all connector weights of an EPC model is then denoted as ”Control-Flow Complexity” [15]. The ImF ”Join Complexity” can be defined as the sum of weighted join connectors based on the number of potential pre-states in EPC models [16, 17]. Finally, the mismatch between potential post-states of splits and pre-states of joins in EPC models is included as another driver of complex- ity. This mismatch is expressed by the static ImF ”Split-Join-Ratio” (= JC/CFC) [16,
17]. Based on these four static ImFs (or drivers of complexity), we derive the EP from Fig. 11. Thereby, an increasing cycle complexity results in higher process complexity.
Also, both increasing CFC and increasing JC result in increasing process complexity.
A JSR value different from 1 increases error probability and thus process complexity.
It is important to mention that – if desired – other drivers of process complexity can be considered as well. Examples can be found in [13, 17].
Work Profile Change. This EP (not shown here, but discussed in [3]) deals with change of end user work profiles (and the effects of work profile changes). More specifically, it relates the perceived work profile change to changes emerging in the five job dimen- sions of Hackman’s job characteristics model [18, 19]: (1) skill variety, (2) task identity, (3) task significance, (4) autonomy, and (5) feedback from the job. For each of these five core job dimensions, the emerging change is designated based on the level before and after EIS introduction.
End User Fears. This EP (not shown here, but discussed in [3] and [6]) is based on experiences which allow to conclude that the introduction of an EIS may cause end user fears, e.g., due to work profile change (i.e., job redesign) or changed social clues.
Such fears can lead, for example, to emotional resistance of end users. This, in turn, can make it difficult to get needed support from end users, e.g., during process analysis.
4 Working with Patterns: Customization and Composition
Using EcoPOST evaluation patterns starts with the identification of those patterns which are relevant in a given context. After selecting a pattern, it might have to be customized.
Note that EPs are applied in different evaluation context. Thereby, we have to distin- guish between customization of an evaluation model (Step I) and of its corresponding simulation model (Step II). The former always requires the subsequent adaptation of the underlying simulation model, while the latter is also possible without customiz- ing the associated evaluation model. Adapting an evaluation model can be achieved by adding or removing model variables, flows, or links. An example can be found in [3].
Correctness of customized EPs is ensured through EcoPOST-specific design rules [7].
Customizing a simulation model, by contrast, means to adapt functions of the sim- ulation model, e.g. changes of SCF values. Customizing an EP can be quickly realized as a single EP does not require complex adaptations.
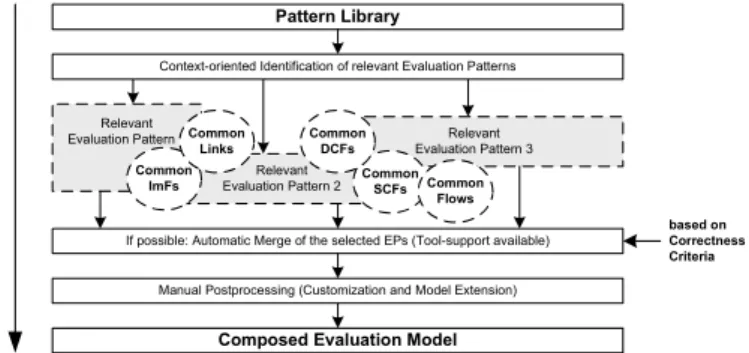
Another important feature with respect to the practical applicability of the EcoPOST framework concerns pattern composition (cf. Fig. 12). In particular, EcoPOST enables EIS engineers to compose new evaluation models by merging EPs. Unlike pattern cus- tomization, composing patterns is typically more complex and costly. Note that the number of composition variants might be quite large. Indeed, composition can be partly automated, but usually manual postprocessing becomes necessary. Respective concepts and merge algorithms are introduced in [3].
In a large case study [3] in the automotive domain, we have successfully applied EPs when designing complex evaluation and simulation models (see [3] for details).
Relevant Evaluation Pattern 1
Relevant Evaluation Pattern 2
Composed Evaluation Model Relevant Evaluation Pattern 3 Pattern Library
based on Correctness Criteria Common
ImFs Common
SCFs
Context-oriented Identification of relevant Evaluation Patterns
If possible: Automatic Merge of the selected EPs (Tool-support available)
Manual Postprocessing (Customization and Model Extension) Common
DCFs Common
Links
Common Flows
Fig. 12. Composition of Patterns.
5 Related Work
Boehm et. al [20] distinguish six categories of cost estimation techniques. They dis- tinguish between model-based approaches (e.g., COCOMO, SLIM), expertise-based approaches (e.g., the Delphi method), learning-oriented approaches (using neural net- works or case based reasoning), regression-based approaches (e.g., the ordinary least squares method), composite approaches (e.g., the Bayesian approach), and dynamic- based approaches (explicitly acknowledging that cost factors change over project du- ration). Picking up this classification, EcoPOST can be considered as an example of a dynamic-based approach (the other categories rely on static analysis models).
There are other formalisms that can be applied to unfold the dynamic effects caused by causal dependencies in EIS engineering projects. Causal Bayesian Networks (BN) [21], for example, promise to be a useful approach. BN deal with (un)certainty and focus on determining probabilities of events. A BN is a directed acyclic graph which represents interdependencies embodied in a given joint probability distribution over a set of variables. In our context, we are interested in the interplay of the components of a system and the effects resulting from this. BN do not allow to model feedback loops as cycles in BN would allow infinite feedbacks and oscillations that prevent sta- ble parameters of the probability distribution. Agent-based modeling provides another promising approach. Resulting models comprise a set of reactive, intentional, or social agents encapsulating the behavior of the various variables that make up a system [22].
During simulation, the behavior of these agents is emulated according to defined rules [23]. System-level information (e.g., about intangible factors being effective in a EIS engineering project) is thereby not further considered. However, as system-level infor- mation is an important aspect in our approach, we have not further considered the use of agent-based modeling.
Patterns were first used to describe best practices in architecture [24]. However, they have also a long tradition in computer science, e.g., in the fields of software architec- ture (conceptual patterns), design (design patterns), and programming (XML schema patterns, J2EE patterns, etc.). Recently, the idea of using patterns has been also applied to more specific domains like workflow management [25, 26] or inter-organizational
control [27]. Generally, patterns describe solutions to recurring problems. They aim at supporting others in learning from available solutions and allow for the application of these solutions to similar situations. Often, patterns have a generative character. Gen- erative patterns (like the ones we introduce) tell us how to create something and can be observed in the environments they helped to shape. Non-generative patterns, in turn, describe recurring phenomena without saying how to reproduce them.
Reusing System Dynamics models has been discussed before as well. On the one hand, authors like Senge [28], Eberlein and Hines [29], Liehr [30], and Myrtveit [31]
introduce generic structures (with slightly different semantics) satisfying the capability of defining ”components”. On the other hand, Winch [32] proposes a more restrictive approach based on the parameterization of generic structures (without providing stan- dardized modeling components). Our approach picks up ideas from both directions, i.e.
we address both the definition of generic components as well as customization.
6 Summary and Future Work
This paper extends our EcoPOST framework, a model-based methodology to systemati- cally investigate the complex cost structures of EIS engineering projects, by introducing the notion of evaluation pattern (EP). Each EP constitutes a template for specific cost or impact factors we encounter in typical EIS engineering projects. All EPs have been derived based on different pillars: results from two surveys [5], case studies [3, 10], a controlled software experiment [4], and practical experiences gathered in EIS engineer- ing projects.
In future work we will extend available EPs and apply them in a broader context in order to gather detailed experiences in applying EcoPOST. This includes the perfor- mance of additional experiments to analyze different use cases (e.g., customization and composition) for our patterns.
References
1. Reijers, H.A., van der Aalst, W.M.P.: The Effectiveness of Workflow Management Systems - Predictions and Lessons Learned. Int’l. J. of Inf. Mgmt., 25(5), pp.457-471 (2005) 2. Boehm, B., Abts, C., Brown, A.W., Chulani, S., Clark, B.K., Horowitz, E., Madachy, R.,
Reifer, D., Steece, B.: Software Cost Estimation with Cocomo 2. Prentice Hall (2000) 3. Mutschler, B.: Analyzing Causal Dependencies on Process-aware Information Systems from
a Cost Perspective. PhD Thesis, University of Twente (2008)
4. Mutschler, B., Weber, B., Reichert, M.: Workflow Management versus Case Handling: Re- sults from a Controlled Software Experiment. Proc. ACM SAC 2008, pp.82-89 (2008) 5. Mutschler, B., Reichert, M., Bumiller, J.: Unleashing the Effectiveness of Process-oriented
Infomation Systems: Problem Analysis, Critical Success Factors and Implications. IEEE Transactions on Systems, Man, and Cybernetics, 38(3), pp.280-291 (2008)
6. Mutschler, B., Reichert, M., Rinderle, S.: Analyzing the Dynamic Cost Factors of Process- aware Information Systems: A Model-based Approach. Proc. 19th CAiSE, LNCS 4495, pp.589-603 (2007)
7. Mutschler, B., Reichert, M.: On Modeling and Analyzing Cost Factors in Information Sys- tems Engineering. Proc. 20th CAiSE, LNCS 5074, pp.510-524 (2008)
8. Richardson, G.P., Pugh, A.L.: System Dynamics - Modeling with DYNAMO. (1981) 9. Mutschler, B., Reichert, M.: Exploring the Dynamic Costs of Process-aware IS through
Simulation. Proc. 12th Int’l. EMMSAD Workshop at CAiSE 2007, pp.173-182 (2007) 10. Mutschler, B., Rijkpema, M., Reichert, M.: Investigating Implemented Process Design: A
Case Study on the Impact of Process-aware Information Systems on Core Job Dimensions.
Proc. 8th Int’l. BPMDS Workshop at CAiSE 2007, pp.379-384 (2007)
11. Cardoso, J.: Control-flow Complexity Measurement of Processes and Weyuker’s Properties.
Proc. Int’l. Enformatika Conference, Volume 8, pp.213-218 (2005)
12. Cardoso, J., Mendling, J., Neumann, G., Reijers, H.: A Discourse on Complexity of Process Models. Proc. Int’l. Workshop on Business Process Design (BPI ’06), pp.115-126 (2006) 13. Latva-Koivisto, A.: Finding a Complexity Measure for Business Process Models. Research
Report, Helsinki University of Technology (2001)
14. Kindler, E.: On the Semantics of EPCs: Resolving the Vicious Circle. Data Knowledge Engineering, 56(1), pp.23-40 (2006)
15. Gruhn, V., Laue, R.: Complexity Metrics for Business Process Models. Proc. 9th Int’l. Conf.
on Business Information Systems (BIS ’06) (2006)
16. Mendling, J., Moser, M., Neumann, G., Verbeek, H.M.W., van Dongen, B.F., van der Aalst, W.M.P.: Faulty EPCs in the SAP Reference Model. Proc. 4th Int’l. Conf. on Business Process Management (BPM ’06), LNCS 4102, pp. 451-457 (2006)
17. Mendling, J., Moser, M., Neumann, G., Verbeek, H.M.W., van Dongen, B.F., van der Aalst, W.M.P.: A Quantitative Analysis of Faulty EPCs in the SAP Reference Model. BPM Center Report, BPM-06-08, BPMcenter.org (2006)
18. Hackman, R.J., Oldham, G.R.: Development of the Job Diagnostic Survey. Journal of Ap- plied Psychology, 60(2), pp.159-170 (1975)
19. Hackman, R.J., Oldham, G.R.: Motivation through the Design of Work: Test of a Theory.
Organizational Behavior & Human Performance, 16(2), pp.250-279 (1976)
20. Boehm, B., Abts, C., Chulani, S.: Software Development Cost Estimation Approaches - A Survey. Technical Report, USC-CSE-2000-505 (2000)
21. Jensen, F.V.: Bayesian Networks and Decision Graphs. Springer (2002)
22. Brassel, K.H., Mhring, M., Schumacher, E., Troitzsch, K.G.: Can Agents Cover All the World? Simulating Social Phenomena, LNEMS 456, pp.55-72 (1997)
23. Scholl, H.J.: Agent-based and System Dynamics Modeling: A Call for Cross Study and Joint Research. Proc. 34th Hawaii Int’l. Conf. on System Sciences (HICSS ’01) (2001)
24. Alexander, C., Ishikawa, S., Silverstein, M.: A Pattern Language. Oxford Press (1979) 25. van der Aalst, W.M.P., ter Hofstede, A.H.M., Kiepuszewski, B., Barros, A.P.: Advanced
Workflow Patterns. Proc. 7th CoopIS, LNCS 1901, pp.18-29 (2000)
26. Weber, B., Reichert, M., Rinderle-Ma, S.: Change Patterns and Change Support Features - Enhancing Flexibility in Process-Aware Information Systems. Data and Knowledge Engi- neering, Vol.66, No.3, pp. 438-466 (2008)
27. Kartseva, V., Hulstijn, J., Tan, Y.H., Gordijn, J.: Towards Value-based Design Patterns for Inter-Organizational Control. Proc. 19th Bled E-Commerce Conference (2006)
28. Senge, P.M.: The 5th Discipline - The Art and Practice of the Learning Organization (1st Edition). Currency Publications (1990)
29. Eberlein, R.J., Hines, J.H.: Molecules for Modelers. Proc. 14th SD Conference (1996) 30. Liehr, M.: A Platform for System Dynamics Modeling - Methodologies for the Use of
Predefined Model Components. Proc. 20th Int’l. System Dynamics Conference (2002) 31. Myrtveit, M.: Object-oriented Extensions to System Dynamics. Proc. 18th Int’l. System
Dynamics Conference (2000)
32. Winch, G., Arthur, D.J.W.: User-Parameterised Generic Models: A Solution to the Conun- drum of Modelling Access for SMEs? System Dynamics Review, 18(3), pp.339-357 (2003)