Obesity-linked dysfunction of hypothalamic and pituitary circuits
in regulation of energy homeostasis
Inaugural-Dissertation zur
Erlangung des Doktorgrades
der Mathematisch-Naturwissenschaftlichen Fakultät der Universität zu Köln
vorgelegt von
Bengt-Frederik Belgardt aus Köln
Köln 2009
Berichterstatter: Prof. Dr. Jens C. Brüning Prof. Dr. Peter Kloppenburg
Prof. Dr. Tamas Horvath
Tag der mündlichen Prüfung: 14.01.2010
“By three methods we may learn wisdom:
First, by reflection, which is noblest;
second, by imitation, which is easiest;
and third, by experience, which is the bitterest.”
-Confucius
Table of contents
4
Table of contents
Table of contents_________________________________________4 Figure index ____________________________________________8 Table index ____________________________________________10 Abbreviations __________________________________________11 1 Introduction __________________________________________15
1.1 The obesity pandemic and associated diseases __________________ 15 1.2 Energy homeostasis ________________________________________ 15 1.3 The adipokine leptin _______________________________________ 16 1.4 Leptin signalling __________________________________________ 16 1.5 The pancreatic hormone insulin______________________________ 18 1.6 Insulin signalling __________________________________________ 18 1.7 The brain as a regulator of energy homeostasis _________________ 20 1.8 The hypothalamus as a regulator of energy homeostasis _________ 21 1.9 Leptin, insulin and the melanocortin circuit____________________ 23 1.10 Lipid-induced insulin and leptin resistance ___________________ 26 1.11 The role of NFκB and JNK signalling in energy homeostasis _____ 27 1.12 Central and peripheral inflammation and energy homeostasis ___ 30 1.13 ER stress and energy homeostasis ___________________________ 31 1.14 Objectives _______________________________________________ 32
2 Materials and Methods _________________________________33
2.1 Chemicals and Biologicals __________________________________ 33 2.2 Molecular Biology _________________________________________ 35
2.2.1 Isolation of genomic DNA ___________________________________________ 35 2.2.2 Quantification of nucleic acids________________________________________ 35 2.2.3 Polymerase chain reaction ___________________________________________ 35 2.2.4 RNA extraction, RT-PCR and Quantitative Real-Time PCR ________________ 362.3 Cell Biology ______________________________________________ 38
2.3.1 Histological analysis and immunohistochemistry _________________________ 38
Table of contents
5
2.4 Biochemistry _____________________________________________ 39
2.4.1 Enzyme-linked Immunosorbent Assay (ELISA) __________________________ 39 2.4.2 Protein extraction __________________________________________________ 39 2.4.3 Western Blotting __________________________________________________ 40 2.4.4 C-jun N-terminal kinase assay ________________________________________ 40 2.4.5 Hepatic lipid content analysis ________________________________________ 41
2.5 Mouse experiments ________________________________________ 41
2.5.1 Animal care ______________________________________________________ 42 2.5.2 Mice ____________________________________________________________ 42 2.5.3 Blood collection and determination of glucose levels ______________________ 43 2.5.4 Food intake and indirect calorimetry ___________________________________ 43 2.5.5 Glucose, insulin and pyruvate tolerance test _____________________________ 43 2.5.6 Analysis of body composition ________________________________________ 44 2.5.7 Restraint stress ____________________________________________________ 44 2.5.8 Intracerebroventricular indwelling catheter implantation ___________________ 44 2.5.9 Intraperitoneal leptin sensitivity tests___________________________________ 45 2.5.10 Implantation of osmotic minipumps __________________________________ 45 2.5.11 Behavioural analysis ______________________________________________ 46
2.6 Cell culture_______________________________________________ 46 2.7 Computer analysis_________________________________________ 47
2.7.1 Densitometrical analysis ____________________________________________ 47 2.7.2 Statistical methods _________________________________________________ 473 Results ______________________________________________48
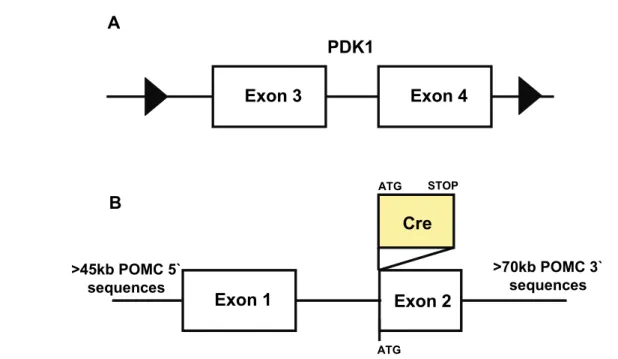
3.1 Generation of POMC cell-specific PDK1 knockout mice _________ 48
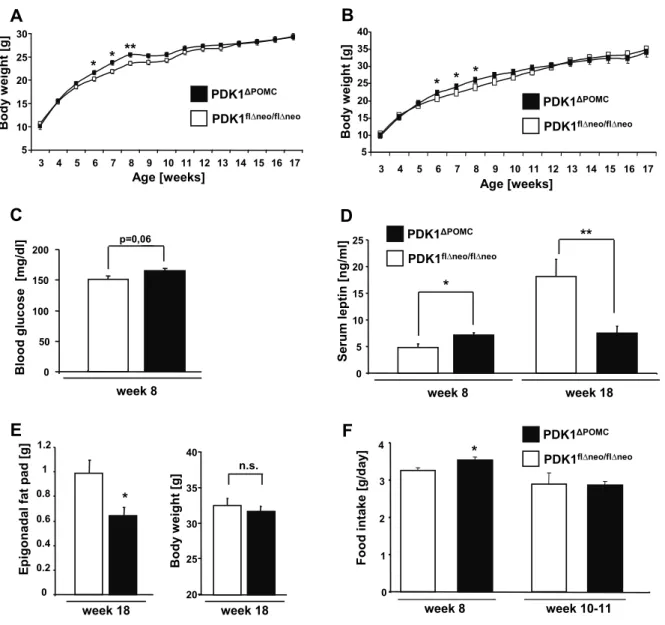
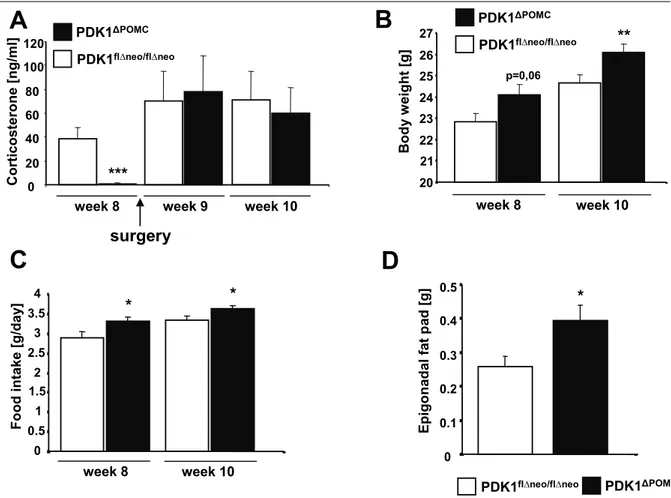
3.2 Increased body weight and hyperphagia in young PDK1
ΔPOMCmice 51
3.3 Secondary hypocortisolism in PDK1
ΔPOMCmice _________________ 53
3.4 Corticosterone replacement prolongs hyperphagia and increased body
weight in PDK1
ΔPOMCmice _____________________________________ 57
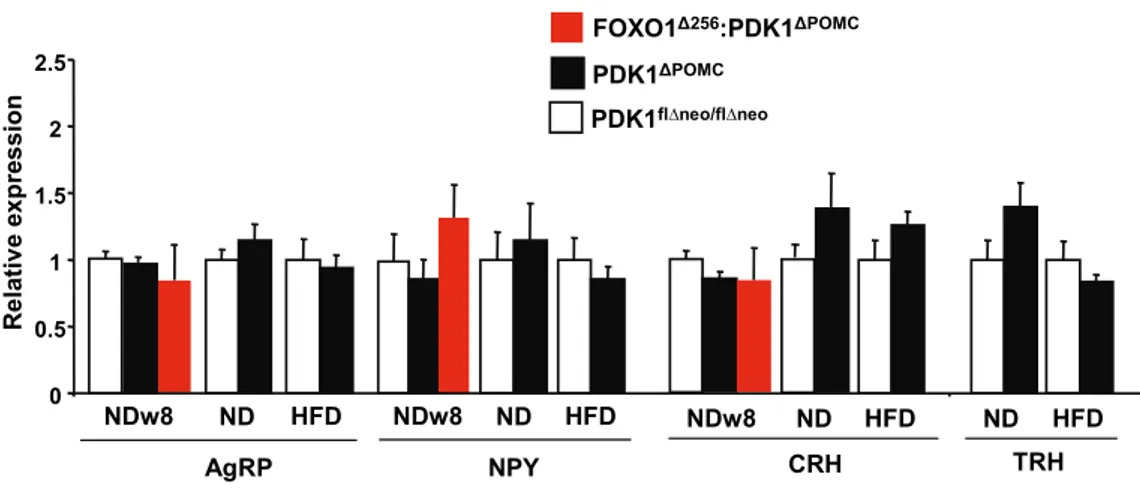
3.5 Restoration of energy homeostasis in PDK1
ΔPOMCmice by FOXO1
inhibition in vivo _____________________________________________ 58
3.6 Corticotroph cell loss in PDK1
ΔPOMCmice is FOXO1-independent _ 62
3.7 Hypothalamic JNK activity is increased by HFD________________ 64
3.8 HFD induces an inflammatory response in the hypothalamus _____ 65
3.9 TNFα has both anorexigenic and orexigenic properties in the CNS 66
3.10 HFD-induced hypothalamic expression of cytokines is not readily
reversible ___________________________________________________ 67
3.11 Generation of JNK1
ΔNESmice _______________________________ 68
Table of contents
6
3.12 JNK activity is increased in pituitaries of diet-induced obese mice 70
3.13 Unchanged behaviour in JNK1
ΔNESmice______________________ 71 3.14 Decreased weight but unchanged body composition in JNK1
ΔNESmice ____________________________________________________________ 73 3.15 Improved glucose homeostasis in JNK1
ΔNESmice under ND
conditions ___________________________________________________ 74 3.16 JNK1
ΔNESmice show decreased body weight but are not protected from diet-induced obesity ______________________________________ 75 3.17 Improved glucose homeostasis in obese JNK1
ΔNESmice _________ 76 3.18 JNK1
ΔNESmice show increased hypothalamic insulin but not leptin sensitivity ___________________________________________________ 77 3.19 Unchanged hypothalamic expression of neuropeptides, cytokines and ER stress mediators in JNK1
ΔNESmice ___________________________ 80 3.20 HFD induces ER stress in the pituitary in a JNK1-independent
manner _____________________________________________________ 81 3.21 JNK1
ΔNESmice show decreased activation of the somatotrophic axis
____________________________________________________________ 82 3.22 JNK1
∆NESmice show increased activation of the thyroid axis_____ 85 3.23 JNK1
∆Nesmice are protected from hepatic dysfunction upon HFD 88 3.24 JNK1
∆Nesmice are protected from HFD-induced adipose tissue
inflammation and dysfunction __________________________________ 91
4 Discussion ___________________________________________96
4.1 Inactivation of PDK1 in POMC cells__________________________ 97
4.2 PDK1 in POMC cell function ________________________________ 97
4.3 The PDK1-FOXO1 axis in hypothalamic POMC expression ______ 98
4.4 The PDK1-FOXO1 axis in corticotroph cell survival ____________ 99
4.5 Hypothalamic cytokine expression in diet-induced obesity_______ 100
4.6 Hypothalamic/pituitary JNK activation in obesity______________ 102
4.7 JNK1 as a regulator of somatic growth_______________________ 102
Table of contents
7
4.8 JNK1 as a negative regulator of the thyrotrophic axis __________ 104
4.9 JNK1 action and hypothalamic insulin sensitivity ______________ 105 4.10 Systemic effects of CNS/pituitary JNK1 signalling ____________ 105 4.11 Caloric restriction, aging and JNK1 ________________________ 108 4.12 Perspective _____________________________________________ 109
5 Summary ___________________________________________110
6 Zusammenfassung____________________________________111
7 References __________________________________________112
8 Acknowledgements ___________________________________121
9 Erklärung___________________________________________122
10 Curriculum vitae ____________________________________123
Figure index
8
Figure index
Figure 1: Canonical leptin signalling. ... 17
Figure 2: Canonical insulin signalling. ... 19
Figure 3: The melanocortin system regulates energy homeostasis. ... 26
Figure 4: Multiple pathomechanisms of insulin resistance... 29
Figure 5: Targeted genomic loci in PDK1flΔneo/flΔneo and POMC-Cre mice. ... 48
Figure 6: Ablation of the PDK1 protein in POMC neurons... 49
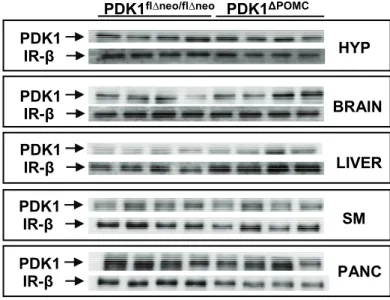
Figure 7: Unchanged PDK1 protein content in peripheral tissues and total brain... 50
Figure 8: PDK1 deletion follows endogenous POMC expression... 50
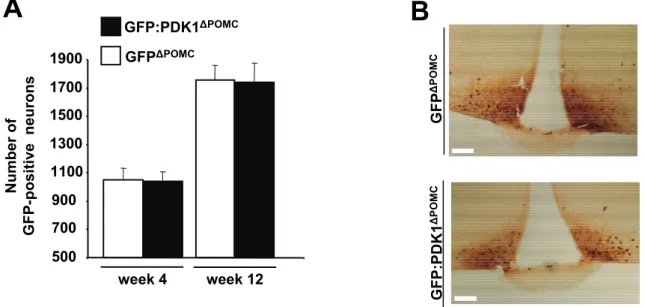
Figure 9: PDK1 deletion does not affect generation and survival of POMC neurons. ... 51
Figure 10: Increased body weight and hyperphagia in young PDK1ΔPOMC mice. ... 52
Figure 11: POMC mRNA expression is impaired in PDK1ΔPOMC mice ... 53
Figure 12: Elevated insulin sensitivity in PDK1ΔPOMC mice... 54
Figure 13: Reduced plasma corticosterone and adrenal ACTH insensitivity in PDK1ΔPOMC mice. ... 55
Figure 14: Loss of POMC cells in pituitaries of PDK1ΔPOMC mice. ... 56
Figure 15: Corticosterone restoration maintains hyperphagia and increased body weight in PDK1ΔPOMC mice... 58
Figure 16: Generation of mice with inducible FOXO1Δ256 expression. ... 59
Figure 17: Expression of FOXO1Δ256 rescues the hypothalamic phenotype of PDK1ΔPOMC mice. ... 60
Figure 18: Unchanged orexigenic and PVN neuropeptide expression in PDK1ΔPOMC mice. .. 62
Figure 19: Corticotroph loss is not FOXO1-dependent in PDK1ΔPOMC mice. ... 63
Figure 20: Pituitary pro-apoptotic gene expression in young PDK1ΔPOMC mice ... 64
Figure 21: High-fat diet induces hypothalamic JNK activation... 65
Figure 22: High-fat diet induces hypothalamic transcription of cytokines... 66
Figure 23: TNFα elicits orexigenic and anorexigenic effects in a dose-dependent manner .... 67
Figure 24: Diet-induced up-regulation of cytokine expression is not readily reversible by diet modulation... 68
Figure 25: Nestin cell-specific deletion of JNK1... 69
Figure 26: Generation of JNK1ΔNes mice ... 70
Figure 27: Pituitary JNK activation upon high-fat feeding... 71
Figure index
9
Figure 28: Unchanged locomotor control and anxiety in JNK1ΔNes mice... 72
Figure 29: Unchanged water maze performance by JNK1ΔNes mice... 73
Figure 30: Decreased weight but unchanged body composition in JNK1ΔNES mice on Normal Diet ... 74
Figure 31: Improved insulin sensitivity and glycemic control in JNK1ΔNES mice on Normal Diet ... 75
Figure 32: Decreased weight but unchanged body composition in JNK1ΔNES mice on HFD.. 76
Figure 33: Improved glucose tolerance and insulin sensitivity in obese JNK1ΔNES mice... 77
Figure 34: Unaltered leptin sensitivity in JNK1ΔNES mice ... 78
Figure 35: Elevated hypothalamic insulin sensitivity in JNK1ΔNES mice... 79
Figure 36: Hypothalamic neuropeptide, cytokine and ER stress marker expression is unchanged in JNK1ΔNES mice... 81
Figure 37: HFD induces ER stress marker expression in the pituitary ... 82
Figure 38: Serum IGF-1 is reduced in JNK1ΔNES mice ... 83
Figure 39: Somatic growth is reduced at the control level of the pituitary in JNK1ΔNES mice 84 Figure 40: Pituitary expression of PIT-1 and its target GHRHR is regulated in JNK1ΔNES mice ... 85
Figure 41: Corticosterone levels are normal in JNK1ΔNES mice... 86
Figure 42: JNK1∆NES mice show increased activation of the thyrotropic axis ... 86
Figure 43: Elevated pituitary activation of the thyrotropic axis in JNK1∆NES mice ... 87
Figure 44: JNK inhibition increases TRHR expression in vitro... 88
Figure 45: JNK1∆NES mice are protected from diet-induced hepatosteatosis ... 89
Figure 46: Reduced hepatic triglyceride content in HFD-fed JNK1∆NES mice... 89
Figure 47: Ameliorated hepatic glucose production in diet-induced obese JNK1∆NES mice.... 90
Figure 48: Elevated hepatic insulin sensitivity in diet-induced obese JNK1∆NES mice... 90
Figure 49: Increased eWAT mass in diet-induced obese JNK1∆NES mice ... 91
Figure 50: Obese JNK1∆NES mice are protected from adipocyte hypertrophy ... 92
Figure 51: JNK1∆NES mice show ameliorated lipid metabolism enzyme expression in eWAT93 Figure 52: JNK1∆NES mice are protected from obesity-induced WAT inflammation ... 94
Figure 53: GLUT4 expression in eWAT is increased in obese JNK1∆NES mice ... 95
Figure 54: Model of post-developmental POMC neuron activity and POMC mRNA expression... 99
Table index
10
Table index
Table 1: Chemicals... 33
Table 2: Enzymes ... 35
Table 3: Primer sequences... 36
Table 4: Real-Time analysis probes ... 37
Table 5: Custom Real-Time analysis probes... 38
Abbreviations
11
Abbreviations
°C degrees Celsius
3’ three prime end of DNA sequences 5’ five prime end of DNA sequences
A adenosine
ACTH adrenocorticotrophin AgRP agouti-related peptide AKT proteinkinase B Arc arcuate nucleus
Avertin tribromoethyl alcohol and tert-amyl alcohol BAT brown adipose tissue
BMI body mass index
C cytosine
CART cocaine-and-amphetamine-related transcript cAMP cyclic adenosine monophosphate
cDNA complementary DNA CNS central nervous system Cort corticosterone
Cre site specific recombinase from phage P1 (causes recombination)
Da Dalton
DAPI 4',6-diamidino-2-phenylindole ddH2O double destilled water
DG diglyceride
DMH dorsomedial hypothalamic nucleus DMSO dimethylsulfoxide
DNA desoxyribonucleic acid DNase desoxyribonuclease
dNTP desoxyribonucleotide-triphosphate DTT Dithiothreitol
e.g. exempli gratia
ECL enhanced chemiluminescence EDTA ethylendiamine tetraacetate
eGFP enhanced green fluorescent protein ELISA enzyme-linked immunosorbent assay EtBr ethidium bromide
EtOH ethanol FFA free fatty acid floxed loxP flanked fMol femto-Mol
FOXO1 forkhead-O transcription factor 1
g gram
G guanine
G6P glucose-6-phosphatase GABA gamma-aminobutyric acid GFP green fluorescent protein GH growth hormone
GHRH GH-releasing hormone GHRHR GHRH receptor
Abbreviations
12
GLUT4 glucose transporter 4 GTT glucose tolerance test Gusb glucuronidase beta
h hour
H&E hematoxylin/eosin HCl hydrochloric acid
HEPES N-2-hydroxyethylpiperazine-N’-2-ethansulfonic acid HFD high-fat diet
HGP hepatic glucose production
Hprt hypoxanthine guanine phosphoribosyl transferase-1 HSL hormone sensitive lipase
icv intracerebroventricular IGF-1 insulin-like growth factor-1 IL1β interleukin 1 beta
IL6 interleukin 6 ip intraperitoneal
IR-β insulin receptor, beta subunit IRES internal ribosome entry site IRS insulin receptor substrate ITT insulin tolerance test JAK Janus kinase
JNK c-Jun N-terminal kinase
k kilo
kb kilobase pairs KCl potassium chloride kDa kilodalton
KOH potassium hydroxide
l liter
lacZ gene encoding the enzyme beta-galactosidase LH lateral hypothalamic area
loxP recognition sequence for Cre (locus of x-ing over phage P1) LPL lipoprotein lipase
m milli
M molar
MAPK mitogen-activated protein kinase MCR melanocortin receptor
ME median eminence MgCl2 magnesium chloride min minute
mRNA messenger RNA
MSH melanocyte-stimulating hormone
n nano
Na2HPO4 disodium hydrogen phosphate Na3O4V sodium orthovanadate
NaCl sodium chloride NaF sodium fluoride
NaH2PO4 monosodium phosphate NaHCO3 sodium bicarbonate NaOH sodium hydroxide ND normal diet
NFκB nuclear factor kappa-light-chain-enhancer of activated B cells
Abbreviations
13
NMR nuclear magnetic resonance NPY neuropeptide Y
ObRb leptin receptor, long isoform OD optical density
p/P phospho-
PAGE polyacrylamid gel electrophoresis PB phosphate buffer
PBS phosphate buffered saline PCR polymerase chain reaction
PDK1 3-phosphoinositide-dependent protein kinase 1 PFA paraformaldehyde
PH pleckstrin homology
PI3K phosphatidylinositol 3-kinase
PIP2 phosphatidylinositol-4,5-bisphosphate PIP3 phosphatidylinositol-3,4,5-trisphosphate PIT-1 Pituitary-specific positive transcription factor 1 PKC protein kinase C
pMol pico-Mol
POMC proopiomelanocortin PTB phosphotyrosine binding
PTEN phosphatase and tensin homolog PTT pyruvate tolerance test
PVN paraventricular nucleus
Raf proto-oncogene serine/threonine protein kinase Ras small GTPase (Rat sarcoma)
RNA ribonucleic acid RNAi RNA interference RNase ribonuclease RT room temperature SDS sodiumdodecylsulfate sec second
SEM standard error of the mean
SGK1 serum- and glucocorticoid regulated kinase 1 SH src homology
Shp-2 tyrosine phosphatase-2
SOCS suppressor of cytokine signalling
STAT signal transducer and activator of transcription T3 triiodothyronine
T4 thyroxine
TAE Tris-acetic acid-EDTA buffer TBS Tris buffered saline
TG triglyceride
TNFα tumor necrosis factor alpha TRH thyrotrophin releasing hormone TRHR TRH receptor
Tris 2-amino-2-(hydroxymethyl-)1,3-propandiole TSHβ thyroid stimulating hormone beta
Tyr/Y tyrosine
U units
UV ultraviolet
V Volt
Abbreviations
14
v/v volume per volume
VMH ventromedial nucleus of the hypothalamus VO2 volume of oxygen
w/v weight per volume WAT white adipose tissue WHO World Health Organisation ZnSO4 zinc sulfate
β-M β-mercaptoethanol
µ micro
Introduction
15
1 Introduction
1.1 The obesity pandemic and associated diseases
The worldwide increase in obesity has reached pandemic proportions, as indicated by more than 1.6 billion people being overweight and 400 million being obese (1).
Approximately 50% of American citizen have a body mass index (BMI = weight/size in meters²) higher than 25 and are thus considered overweight; a steady increase of average BMI has also been reported in Europe, Asia and even Africa (2, 3). In Germany, more than 20% of adult men and women are obese as indicated by an BMI greater than 30 (4). Importantly, increases in BMI are not only seen in people already overweight or obese. Analysis of the BMI distribution over the last 60 years indicates a significant shift among lean, normal weight and overweight people of all ages towards an increased BMI, emphasising the reach of the obesity pandemic (5). Obesity is the principal consequence of increased neutral lipid storage in adipocytes in the white adipose tissue due to either increased energy intake, reduced energy expenditure, or both (6-8). In addition to psychosocial effects such as stigmatisation and social isolation, obesity increases the risk for contracting a variety of diseases such as cancer, atherosclerosis, dyslipidemia, retinopathy, renal failure, neuropathy and especially diabetes mellitus (DM), establishing the “metabolic syndrome” (9-14). Economic costs are immense;
estimated 20% of the US health care budget is spent on patients with DM (15). Chronic obesity shortens life span; being obese at the age of 40 reduces the predicted life time by up to 7 years (16). Furthermore, there is evidence that maternal obesity during pregnancy has profound effects on body weight of newborns during their adult life, underlining the necessity to combat obesity (17-20). In light of these alarming epidemiological findings, considerable efforts have been undertaken to understand how body weight and glucose homeostasis are regulated in humans.
1.2 Energy homeostasis
In healthy humans and mice, a specific body weight is perpetuated, since both experimental underfeeding and overfeeding will lead to compensatory changes in food intake and energy expenditure (21-24). Therefore, physiological signals exist which contain fat mass gain during overabundance, or increase feeding in case of depleted energy stores. These physiological signals and circuits are therefore responsible for maintaining energy homeostasis. Owing to the obesity pandemic, it has been deducted that body weight gain
Introduction
16
indicates malfunctioning of these counterregulatory systems, possibly due to genetic predisposition, environmental factors or most likely, both (25-27). From an evolutionary point of view, the ability to sustain body weight in a scarce environment has been very important, since energy surplus was ultimately very rare until the middle of the 20th century (the “thrifty gene” hypothesis) (28). The hypothesis that signals, for example hormones, secreted by peripheral tissues might have an effect on central/neuronal circuits to control body weight has been highlighted by findings from the late 20th century. These studies indicated that multiple feedback loops between the brain and peripheral tissues regulating energy homeostasis exist, with the hormones insulin and leptin implicated as the most important regulators of body weight and glucose metabolism (29-32).
1.3 The adipokine leptin
The gene of the critical regulator of energy homeostasis, leptin, was cloned in 1995 (33). Leptin is expressed mainly in the adipose tissue in relation to the stored fat content, and released into the circulation (34). It was identified after genetic screening of a mouse strain called the obese/obese (ob/ob) mouse, which was revealed to completely lack leptin protein due to a homozygous mutation (33). Later on, human patients were identified which also lack circulating leptin and hence show early-onset morbid obesity, underscoring the importance of leptin in human physiology (35). The leptin receptor (ObR) was subsequently cloned, and mice lacking the signalling isoform of the leptin receptor (ObRb) show massive obesity, and develop early onset DM, and are thus called db/db mice (from diabetic) (36, 37). Application of recombinant leptin to ob/ob mice or human patients lacking leptin rapidly normalises body weight and glucose homeostasis (33). Nonetheless, the overwhelming majority of obese patients cannot be treated by leptin, since obese patients (and obese animal models) show increased levels of leptin in the circulation, indicating a leptin resistant state. So far, the search for an leptin sensitizing drug with efficacy in patients has been fruitless (38).
1.4 Leptin signalling
Leptin signals by activation of its receptor which is expressed at high levels in several brain regions, especially the hypothalamus (36, 39). It has been demonstrated that the weight- reducing effects of leptin are predominantly mediated by its action on neurons (40).
Activation of its receptor leads to recruitment of janus kinases (JAK) 2, which phosphorylate the intracellular domain on specific residues (41). JAK2 is able to phosphorylate the
Introduction
17
transcription factor signal transducer and activator of transcription (STAT) 3 , which after homodimerisation enters the nucleus to activate or inactivate transcription of leptin-regulated genes by recruitment of histone acetylases or deacetylases, respectively (37, 42). Besides several phosphatases implicated in dephosphorylation of leptin signalling cascade proteins (43), suppressor of cytokine signalling (SOCS) 3 has been shown to be crucial for leptin signalling. Its expression is positively regulated by leptin stimulation, thus leptin increases expression of its own negative regulator, which subsequently reduces interaction of STAT3 with the ObRb and thus enables a new round of stimulation (41, 43). Importantly, it has been shown that a chronic hyperleptinemic state induces a disproportional increase in SOCS3 expression, possibly indicating that chronic leptin signalling by itself induces leptin resistance (44). In addition to JAK2/STAT3 signalling, leptin is able to activate insulin´s main signalling cascade phosphatidyl-inositol-3-kinase (PI3K) through the adapter protein SH2-B (45), although duration and signal strength of PI3K activation is considerably lower compared to insulin (46-50).
PIP3
AKT
IRS
P P
P P
PIP3
PDK1
P
p85 p110 PI3K PIP3
Leptin ObRb
P P P P
PP
JAK2 JAK2
P P
P
P P P
nucleus
STAT3P STAT3P
STAT3P STAT 3
P
SOCS3
SOCS3
Figure 1: Canonical leptin signalling.
Binding of leptin leads to recruitment of Jak2, autophosphorylation and phosphorylation of ObRb. After Jak2- mediated phosphorylation of STAT3, pSTAT3 dimers activate transcription of target genes by recruitment of histone acetylases. One of these genes is SOCS3, and the SOCS3 protein in a feedback loop binds to JAK2 and thereby inhibits STAT3 phosphorylation. In addition, JAK2 is able to directly activate IRS/PI3K signalling, leading to AKT activation. IRS, insulin receptor substrate; JAK2, Janus kinase 2; ObRb, long form of leptin receptor; PDK1, 3-phosphoinositide-dependent protein kinase 1; PI3K, phosphatidylinositol-3-kinase; PIP2, phosphatidyl-inositol-4,5-bisphosphate; PIP3, phosphatidylinositol-3,4,5-triphosphate; SOCS3, suppressor of cytokine signalling 3; STAT3, signal transducer and activator of transcription 3.
Introduction
18
1.5 The pancreatic hormone insulin
The notion that a pancreatic hormone is able to acutely reduce glucose concentration in the blood has been known for more than 80 years, following extraction of insulin from dog pancreas by Banting and Best (51). In pancreatic β-cells, insulin is translated as a 51 amino acid preproprotein, which after cleavage of a signalpeptide as well as generation of disulfide bridges in the endoplasmatic reticulum (ER), is stored in cytoplasmatic vesicles (52, 53). If ambient glucose concentrations rise, glucose enters the cell via glucose transporter (GLUT) 2 and is metabolised into adenosine triphosphate (ATP). Rising intracellular ATP concentrations are sensed by ATP-dependent potassium (KATP) channels, which close at a certain ATP concentration threshold. Closure of KATP channels depolarises the membrane of the β-cell, resulting in the opening of calcium channels, allowing Ca2+ ion influx. The increasing intracellular Ca2+ concentrations induce vesicle exocytosis and thus release of insulin into the bloodstream (52, 54).
1.6 Insulin signalling
The insulin signalling cascade is activated by binding of insulin to the insulin receptor (IR), which is almost ubiquitously expressed in mammalian tissues, including hepatocytes, myocytes, adipocytes, pancreatic cells, several lineages of the immune system, and the brain (55-60). It consists of two heterodimers of the α- and β-chain, wherein the α-chain is located extracellular, while the β-chain spans from the extracellular through the membrane into the intracellular space (61). Binding of insulin to the IR elicits a conformational change, which actives the tyrosine kinase activity of the β-chain (61). After trans phosphorylation of the β- chains at seven tyrosine residues, maximal kinase activity is achieved (61). Insulin receptor substrates (IRS) bind to the IR via their phosphotyrosine binding domains (PTB) (62-64).
Most of the IRS proteins also contain a pleckstrin homology (PH) domain, which allows interaction with phospholipids in the membrane, ensuring co-localization of the IR and its downstream targets (62). There are at least five known IRS proteins, although the role of IRS1 and IRS2 is best described (65). After phosphorylation, IRS proteins serve as docking platforms for proteins containing a Rous sarcoma virus (Src)-homology (SH) 2 domain, for example growth factor receptor-bound protein (Grb), the SH2 domain containing protein tyrosine phosphatase 2 (Shp2) , and importantly, the regulatory subunit p85 of PI3K (66-68).
While Grb subsequently mediates activation of the mitogen activated protein kinase (MAPK) pathway which regulates cell growth and mitosis (69), PI3K activation mediates the majority of insulin´s effects on glucose and lipid metabolism (68, 70, 71). Activity of the catalytic
Introduction
19
subunit p110 is inhibited by the regulatory subunit p85, until p85 binds to phosphorylated tyrosine residues of IRS protein by its SH2 domain (68, 70). This leads to conformational changes, allowing activation of the p110 subunit. Subsequently, PI3K mediates the conversion of the membrane lipid phosphatidyl-inositol-4,5-bisphosphate (PIP2) to phosphatidyl-inositol-3,4,5-trisphosphate (PIP3) (68). Accumulation of PIP3 in the plasma membrane leads to recruitment of 3-phosphoinositide-dependent protein kinase (PDK) 1, which binds to PIP3 by its PH domain (72). PDK1 phosphorylates protein kinase B (PKB, also known as AKT) isoforms, which regulates the activation of downstream targets such as glycogen-synthase-kinase (GSK) 3, tuberin, S6 and mouse double minute (mdm) 2, which are themselves crucial regulators of glycogen synthesis, translation and cell survival, respectively (72-76).
PI3K
K+
PIP3
IR
AKT
Insulin
P P P
P P P
IRS
P P
P PGrb
Sos Ras PIP3
MAPK PIP3
PTEN PIP2
PDK1
P
Gene transcription Protein synthesis Gene transcription Glycogen synthesis
Glucose uptake
p85 p110 PI3K
PIP2 PIP2
Figure 2: Canonical insulin signalling.
Binding of insulin leads to a conformational change of the IR, ending in activation of the endogenous kinase ability. After autophosphorylation of the IR, IRS proteins bind to the phosphorylated residues by their SH2 domains, and are themselves phosphorylated by the IR. Grb binds via its SH2 domain, eliciting activation of the Ras-Raf-MAPK signalling pathway, which mediates some of insulin´s effects on growth. Phosphorylation of IRS proteins allows binding of p85, the regulatory subunit of the PI3K complex. This de-inhibits p110, the catalytic subunit of PI3K, which subsequently phosphorylates the membrane lipid PIP2 to generate PIP3. PIP3 accumulation in turn will recruit and allow binding of both PDK1 and AKT via their PH domains. After co- localisation induced by PIP3 binding, PDK1 phosphorylates and thereby activates AKT, which mediates most of insulin´s effect on glucose and glycogen metabolism, as well as activating protein translation and gene transcription. Grb, growth factor receptor bound; IR, insulin receptor; IRS, insulin receptor substrate; MAPK, mitogen-activated protein kinase; P, activating phosphorylation at threonine or tyrosine residues; PDK1, 3- phosphoinositide-dependent protein kinase 1; PI3K, phosphatidylinositol-3-kinase; PIP2, phosphatidyl-inositol- 4,5-bisphosphate; PIP3, phosphatidylinositol-3,4,5-triphosphate; Ras, Rat sarcoma protein; Sos, son of sevenless.
Introduction
20
Besides the important role in activation of AKT, PDK1 has been shown to be essential for maturation and activation of several kinases, including protein kinase C (PKC) isoforms (72, 77). The crucial role for PDK1 in development and cell cycle control is highlighted by the finding that unlike mice null for any one of the AKT isoforms, PDK1 null mice are embryonic lethal (78-81).
Insulin signalling plays a critical role for glucose and lipid dispersal into adipose tissue and skeletal muscle. In white adipose tissue (WAT) and muscle, insulin stimulates translocation and merge of vesicles containing GLUT4 with the plasma membrane, and increases expression of GLUT1 expression in WAT (58, 82). Insulin has a very prominent anti-lipolytic effect; it decreases activity of hormone sensitive lipase (HSL) and expression of adipocyte triglyceride lipase (ATGL) in WAT (83, 84). In parallel to this anti-lipolytic effect, insulin increases expression of key regulators of lipogenesis and lipid uptake, such as fatty acid synthase (FAS), and lipoprotein lipase (LPL) (85, 86).
Besides increasing glucose uptake, insulin also stimulates muscle glycogen synthesis, protein synthesis, and inhibits protein breakdown, which is in line with its potent anabolic effect on muscle mass (73, 74, 87).
The transcription factor forkhead box 01 (FOXO1) is a key target of insulin signalling (88). FOXO1 directly controls hepatic expression of genes important for gluconeogenesis, such as glucose-6-phosphatase (G6P) and phosphoenolpyruvate carboxykinase (PEPCK) (89- 92). Besides glucose homeostasis, FOXOs modulate expression of genes involved in apoptosis, cell cycle progression, oxidative stress response, and DNA repair (88). In line with a conserved role of FOXO1, forkhead transcription factors were originally found in Drosophila melanogaster, and homologues also exist in Caenorhabditis elegans (93-95). In all of these animals as well as in humans, insulin or insulin-like peptides regulate forkhead/FOXO localisation by phosphorylation, inducing nuclear export of these proteins (88, 93, 94). Interestingly, FOXO homologues also regulate life span in invertebrates (94, 96).
Here, FOXO homologues induce a transcriptional program which limits growth, increases life span and oxidative stress resistance (88). In turn, it has been shown that multiple stressors such as starvation activate stress kinases, e.g. JNKs, which positively modulate FOXO function by assuring nuclear localisation (88, 97, 98). Importantly, it has been reported, that FOXO1 signalling in mice is also important for control of energy homeostasis (see below).
1.7 The brain as a regulator of energy homeostasis
Each physiological activity is directly or indirectly controlled by neuronal circuits.
Experiments including retrograde tracers studies have demonstrated, that organs involved in
Introduction
21
regulation of energy homeostasis, such as liver, muscle, adipose tissue, gut or the pancreas, are under direct control of the central nervous system (CNS) (99-104). Since the advent of the obesity and diabetes pandemic, considerable efforts are underway to understand where homeostatic signals such as leptin or insulin act in the CNS to influence feeding behaviour and glucose metabolism. Extensive experimental evidence points to a crucial role for the hypothalamus in regulation of energy homeostasis (30, 32, 105). Additionally, neurons in other brain centers (and neuropeptides/neurotransmitters expressed therein) such as in the ventral tegmental area (dopamine) or the raphe nucleus (serotonin) regulate feeding and feeding-related behaviour, such as foraging or the rewarding effects of food (106-110). It should be noted that all of these neuronal circuits are not isolated from each other, but instead are connected by direct synaptic input or via inter-neurons (111-114).
1.8 The hypothalamus as a regulator of energy homeostasis
The finding that neuronal populations located in the hypothalamus regulate food intake and energy expenditure stems from historical experiments, in which different hypothalami nuclei were disrupted by chemical agents or mechanical destruction (115).
Besides introduction of lesions, the effect of electrical stimulation in different hypothalamic nuclei was also studied in animal models (116, 117). These studies defined the lateral hypothalamus as a “hunger center” and the ventromedial hypothalamus as a “satiety center”, since stimulation of the first increases and of the latter decreases food intake (118-120). In addition to regulation of body weight, lesion experiments in rabbits demonstrated that the hypothalamus also controls blood glucose levels (121). Nonetheless, it has been noted that in these experiments, during the introduction of the chemicals or electrodes into the hypothalamus, brain regions located above the hypothalamus may be damaged, chemicals may diffuse into other brain nuclei, and cell types apart from neurons are potentially affected (122).
Although it was then noted that hypothalamic neurons are regulators of feeding, the exact efferent and afferent signals to peripheral tissues were still unknown. Following cloning of leptin and its receptor, it was established that the hypothalamus shows very high levels of ObRb expression (123, 124), and the same is true for insulin receptor mRNA (125, 126). In line with this, application of leptin, insulin or insulin mimetics into the hypothalamus or intracerebroventricular (icv) injection into the adjacent third ventricle acutely reduced food intake and body weight, whereas ablation of the leptin or insulin receptor in this region
Introduction
22
increased body weight (46, 127-129). Henceforth, it was attempted to identify the neuron population(s) involved in mediating insulin´s and leptin´s effect on energy homeostasis.
The hypothalamus consists of several nuclei, including the arcuate nucleus (Arc), the ventromedial nucleus of the hypothalamus (VMH), the dorsomedial nucleus (DMH), and the paraventricular nucleus (PVN). The Arc located next to the third ventricle is privileged among these nuclei due to its close contact with the median eminence, a site characterized by an incomplete blood brain barrier (BBB) (130). Thus, this location allows neurons to sense acute fluctuations of hormones or other signals in the blood. Accordingly, peripheral injection of hormones induces rapid (<10 minutes) activation of their signalling cascades in the Arc.
Possibly the most extensively studied neuronal populations in the Arc are the proopiomelanocortin (POMC) and agouti-related protein (AgRP) / neuropeptide Y (NPY) expressing neurons. Several human patients have been found to have mutations in the POMC gene, which inhibit normal expression or processing of the preproprotein (131-133). These patients suffer from massive early-onset obesity. Conventional POMC knockout mice demonstrated the same phenotype, which suggested a conserved role in control of energy homeostasis both in animal models and humans (132-135). In the hypothalamus, POMC is expressed in ~3000 neurons in the Arc (with very few in the PVN), which are consequently called POMC neurons. In these neurons, the POMC pro-protein is cleaved to generate the neuropeptide alpha-melanocyte stimulating hormone (α-MSH), which after secretion binds to and activates the melanocortin receptor 4 (MC4R), which is expressed on secondary neuronal populations, located in the PVN of the hypothalamus, among other nuclei (136, 137). Thus, electrical stimulation leads to membrane depolarisation of POMC neurons, α-MSH release, MC4R activation and ultimately decreases food intake and increases energy expenditure. In line with these findings, mutations in all proteins involved in processing, release or signalling of the so-called melanocortin pathway have been found in humans, which usually lead to early-onset obesity (138-140). However, both the downstream pathways and the nature of the MC4R expressing neurons are only incompletely understood.
POMC is also expressed in two cell types of the pituitary, namely corticotrophs and melanotrophs. Upon stress stimuli, PVN neurons release corticotrophin releasing hormone (CRH) onto pituitary corticotrophs, which produce and secrete the POMC cleavage product adrenocorticotrophic hormone (ACTH). ACTH stimulates release of glucocorticoids, i.e.
corticosterone (in rodents) or cortisol (in humans) by the adrenal gland (141-143).
Glucocorticoids have profound effects on physiological circuits which include antagonistic effects on insulin signalling and immune cell function. Importantly, glucocorticoids are
Introduction
23
necessary to prevent exaggerated stress response (144). In turn, human patients (and mice) without circulating glucocorticoids will die from extreme stressors such as surgery (144).
Melanotroph-released α-MSH modulates hair and skin pigmentation (145). Since POMC null mice show only very faint changes in skin color, the relative importance of melanocortins in mice with regard to pigmentation appears to be smaller compared to the situation in humans (134).
In contrast to the anorexigenic effect of melanocortin neuropeptides, NPY and AgRP release by AgRP/NPY neurons procure orexigenic effects. As the name suggests, these neurons co-express AgRP/NPY and are located in close vicinity to POMC neurons in the Arc (146). While NPY binds to one of five different receptors on target neurons and thus can indirectly counteract the anorexigenic action of leptin or insulin, AgRP as an inverted agonist directly blocks α-MSH mediated activation of the MC4R, thus inhibiting α-MSH action (147, 148). Supporting the critical role of AgRP/NPY on food intake, acute ablation of AgRP/NPY neurons in adult mice leads to starvation (149, 150). Many hormones implicated in control of energy homeostasis such as leptin and insulin have been shown to affect POMC and AgRP neuron function, for example by modulating POMC/AgRP mRNA expression or POMC/AgRP neuron excitability (48, 151-154).
1.9 Leptin, insulin and the melanocortin circuit
In 1979, Woods and colleagues demonstrated insulin´s ability to decrease food intake and body weight in baboons when injected icv, and 21 years later mice lacking insulin receptors only in the central nervous system were found to develop diet-sensitive obesity (56, 155). When it was demonstrated that insulin´s ability to decrease food intake was dependent on the melanocortin system, attention was directed to the molecular underpinnings of insulin´s regulation of neurons and neuropeptides in the melanocortin circuit (156). Icv injection of insulin increases POMC mRNA expression levels in fasted animals, while mice lacking IRS2 show a decrease in hypothalamic POMC expression (156-158). Moreover, insulin negatively modulates NPY mRNA expression (159). In line with these findings, insulin activates PI3K signalling in identified POMC and AgRP neurons (154). Kitamura and colleagues suggested, that FOXO1 is a negative regulator of POMC and a positive regulator of AgRP expression, and that PI3K activation led to FOXO1 phosphorylation and nuclear export, therefore allowing POMC transcription to take place and blocking AgRP expression in vitro (42). Another group independently presented the same results, but also provided evidence for a modulating role of FOXO1 in expression of NPY (50). Additionally, it has
Introduction
24
been reported that FOXO1 negatively regulates the expression of Carboxypeptidase E (CPE), which is involved in POMC cleavage into α-MSH (160). Nonetheless, most of these findings were based on either short-term studies following icv injections, or on cell line-based in vitro experiments.
Könner and colleagues therefore decided to ablate the insulin receptor in POMC (denoted as IRΔPOMC mice) or AgRP neurons (IRΔAgRP mice) using the Cre/loxP system.
Interestingly, mice lacking IR on POMC or on AgRP neurons did not show differences in body weight, food intake, leptin levels, hypothalamic POMC mRNA expression or glucose tolerance, possibly due to compensation for the lack of insulin input by unknown mechanisms (151). On the other hand, the authors demonstrated an important role for IR signalling in AgRP neurons in control of glucose metabolism, since IRΔAgRP mice showed incomplete suppression of HGP under hyperinsulinemic conditions (151). This effect was not detected in glucose tolerance tests because of compensation by an increase in adipose tissue glucose uptake (151). The considerable effect of hypothalamic insulin action on hepatic glucose output and peripheral glucose uptake has been independently demonstrated several times, although species differences concerning direct hepatic effects and indirect CNS effects of insulin on glucose production might exist (161-166).
Plum and colleagues decided to further examine the role of insulin-activated, PI3K- mediated signalling by generating mice lacking the negative regulator of PI3K signalling, the phosphatase and tensin homologue (PTEN) in POMC neurons (PTENΔPOMC mice). PTEN dephosphorylates PIP3 to generate PIP2 (167). These mice demonstrated increased PIP3 levels in identified POMC neurons, even under conditions of starvation when circulating insulin concentration was low (168). In line with previous results which suggested PI3K signalling in control of POMC expression, POMC mRNA levels were increased in young PTENΔPOMC mice (168). Surprisingly, these mice unexpectedly developed sex-dimorphic, diet-dependent obesity (168). Further analysis revealed that POMC neurons from PTENΔPOMC mice were electrically silent, which was due to potassium outflow mediated by KATP channels (168). Previously, it had been shown that these KATP channels are sensitive to adjacent PIP2/PIP3 concentrations, with PIP3 increasing the probability of KATP channels to open (169, 170). The physiologic role of insulin in KATP channel opening was further demonstrated by insulin´s ability to hyperpolarize POMC neurons ex vivo (168). This effect is not specific to POMC neurons, as AgRP neurons and neuronal cell lines also show hyperpolarisation after insulin stimulation (47, 151). Therefore, it was deducted that chronic, high level insulin stimulation might lead to hyperpolarisation and electrical silencing of both
Introduction
25
POMC and AgRP neurons, which challenged the role of these two neuron populations in control of energy homeostasis (105, 171). Taken together, although the effect of chronic high levels of PI3K activation has thus been studied in a mouse model, the contribution of signalling components acting downstream of PI3K, e.g. PDK1 has not been analysed.
Concurrent with the finding that insulin stimulation leads to nuclear export of FOXO1, leptin stimulation was found to increase STAT3 localisation on the POMC promoter, and FOXO1 and STAT3 were found to compete for binding on adjacent sites on the POMC promoter (42, 50). The physiologically relevant role of leptin signalling on POMC, AgRP and NPY expression is well established (48, 152, 172). Interestingly, leptin´s ability to regulate energy homeostasis was shown to be dependent on CNS PI3K signalling, and leptin has been shown to be able to activate neuronal PI3K signalling (47, 129, 173).
Experiments on leptin´s effect on electrical activity have led to conflicting results.
Leptin was originally shown to induce POMC firing, whereas others have found no effect or inhibition of leptin on neuronal firing (47, 49, 173-175). Adding to the confusion, it was demonstrated that leptin´s ability to increase firing of POMC neurons was dependent on PI3K signalling (173). It is unknown how activation of the same signalling pathway (PI3K) either leads to hyperpolarisation (KATP channel activation, by insulin) or depolarisation (channel(s) unknown, by leptin), although magnitude or duration of PI3K stimulation might play into this phenomenon (105). Nonetheless, insulin´s ability to hyperpolarise POMC neurons appears to be specific to the postnatal adolescent period in mice, since insulin-induced hyperpolarisation cannot be detected in POMC neurons of adult mice (A. Husch & P. Kloppenburg, unpublished observation). Since virtually all electrophysiological experiments so far have been performed on brain slices derived from mice before the time of weaning, the effect of leptin and insulin on neuronal excitation in adult mice remains unresolved (105).
Introduction
26
3v
ME ARC
PVN
POMC PVN
MC4R α-MSH
AgRP NPY
3v
ME ARC
GABA AgRP
Insulin Leptin
Hepatic glucose production
Energy expenditure/
Lipid metabolism
Food intake
WAT
BAT
Hormones Lipids Glucose
Hormones and Nervous system
Figure 3: The melanocortin system regulates energy homeostasis.
Adiposity signals such as insulin and leptin signal to proopiomelanocortin neurons in the arcuate nucleus of the hypothalamus to enhance expression of POMC and/or induce release of α-MSH onto second-order neurons, some of which are located in the PVN. α-MSH binds to and activates these neurons via its receptor MC4R. At the same time, activation of orexigenic neurons such as AgRP/NPY neurons is inhibited. This de-inhibits POMC neurons by a reduction of inhibitory GABAergic input by AgRP/NPY neurons. Hormone and nerve outflow of circuits activated by PVN neurons and other second-order neurons inhibits hepatic glucose production, increases energy expenditure in BAT, reduces food intake and modulates lipid metabolism in WAT. This leads to fat mass loss, which subsequently affects circulating concentrations of the adiposity signals. 3v, third ventricle; α-MSH, α-melanocyte stimulating hormone; AgRP, agouti-related protein; ARC, arcuate nucleus of the hypothalamus;
BAT, brown adipose tissue; GABA, γ-aminobutyric acid; MC4R, melanocortin receptor 4; ME, median eminence; NPY, neuropeptide Y; POMC, proopiomelanocortin; PVN, paraventricular nucleus of the hypothalamus; WAT, white adipose tissue. Green, POMC neurons; red, AgRP/NPY neurons; yellow, PVN neurons.
1.10 Lipid-induced insulin and leptin resistance
During analysis of leptin´s and insulin´s role in control of neuronal excitation and expression of neuropeptides, it has become clear that during conditions of high-energy
Introduction
27
feeding such as high-fat diet, both signalling cascades show decreased efficacy. Hence, high- fat feeding for five days leads to a decrease in hypothalamic phospho-STAT3 immunoreactivity after leptin stimulation (176). In line with this, chronic leptin signalling has been shown to induce high levels of SOCS3 expression, which will further exacerbate leptin resistance (177, 178). Elevated expression of the phosphatase PTP-1B by high-fat feeding have also been implicated in inducing leptin and insulin resistance (179, 180). Although there is currently no pharmacological agent known to act as an leptin sensitiser, experimental evidence ascribes a high lipid-containing diet to cause CNS leptin and insulin resistance, and in turn, a reduction in dietary lipid content is thought to be beneficial for leptin and insulin sensitivity in the CNS (181-184). Here, especially saturated fatty acids such as palmitate may activate several signalling cascades to reduce leptin and insulin signalling. Several isoforms of protein kinase C (PKC) have been shown to negatively modulate insulin sensitivity, which are directly activated by diacylglycerols, and hypothalamic diacylglyerol concentration is aggravated by a high-fat diet (182, 185). Besides PKC activation, the ability of fatty acids to induce leptin and insulin resistance in the CNS and the periphery has been shown to be mediated by toll-like receptor (TLR) 2 and 4 signalling. Fatty acids are thought to bind to TLRs, although an indirect activation has also been described (186, 187). The evolutionary conserved role of TLRs is the recognition of pathogen-associated molecular patterns (PAMPS) such as bacterial lipopolysaccharides, and thus TLRs are crucial sensors of the innate immune system (188, 189). Mice with loss-of-function mutations in TLR4 have been shown to be protected from diet-induced glucose intolerance, and although protection from diet-induced obesity has also been reported, some find increased obesity (190-195). Of note, activation of TLRs will lead to activation of nuclear factor κ-light chain enhancer of B cells (NFκB) as well as c-Jun N-terminal kinase (JNK) signalling (192, 194, 195).
1.11 The role of NFκB and JNK signalling in energy homeostasis
The transcription factor NFκB plays an integral part in cells of the immune system (196). Consisting of two subunits, the NFκB complex is bound to the inhibitor of NFκB (IκB) and thus sequestered in the cytoplasm. Upon divergent stimuli such as cytokines, foreign substances or UV irradiation, IκB is phosphorylated by the IκB kinase (IKK) complex, which subsequently leads to degradation of IκB. The NFκB complex will now translocate to the nucleus, where it regulates transcription of hundreds of genes (196). Under obese conditions, NFκB signalling is mildly, but chronically activated (197, 198). IKK signalling can induce insulin resistance by serine phosphorylation of IRS proteins, but NFκB activation will also
Introduction
28
lead to increased production of cytokines such as tumor necrosis factor (TNF) α (197). In line with this, mice with increased activation of NFκB signalling in the liver develop glucose intolerance and insulin resistance (197). Importantly, NFκB signalling in the hypothalamus is a negative regulator of insulin and leptin sensitivity, partially by inducing SOCS-3 expression (184, 198).
Besides NFκB signalling, the JNK signalling cascade has been shown to be activated by diet-induced obesity (199). There are three known JNK homologues, denominated JNK1, JNK2 and JNK3 (200). Whereas JNK1 and JNK2 are ubiquitously expressed, JNK3 is most abundant in the brain and less in peripheral tissues (200). JNKs are able to regulate transcription, survival, apoptosis and other cellular events in response to diverse stimuli such as UV irradiation or cytokine stimulation (200). Interestingly, JNK1 plays a role in obesity- associated pathologies, since conventional JNK1 but not JNK2 knockout mice are protected from obesity-induced hyperglycemia, hyperinsulinemia and insulin resistance (199). In this context, insulin resistance is caused by JNK1-mediated phosphorylation of specific serine residues of IRS proteins (199, 201). These inhibitory phosphorylation events block recruitment of IRS proteins to the insulin receptor and thereby activation of downstream signalling, causing insulin resistance (202, 203). In addition to protection against diet-induced obesity, several physiologic processes are altered in JNK1 null mice, including bone remodelling and breeding efficiency, and the outward phenotype of JNK1 mice is likely a combination of all of these phenotypes, with most of them unexplored yet (200, 204)
Several groups have aimed to define the peripheral tissues in which JNK1 ablation is crucial for the protection from high-fat diet (HFD)-mediated impairment of glucose metabolism. Recently, mice with JNK1 ablation in the hematopoietic compartment were shown to be resistant to diet-induced insulin resistance due to reduced inflammation (205). In contrast, other investigators could not find any improvement in systemic glucose homeostasis in mice with JNK1 ablation in the hematopoietic compartment or specifically in the myeloid lineage (206, 207). Strikingly, fat cell-specific disruption of JNK1 provided evidence for a crucial role of adipose tissue JNK1 in systemic glucose metabolism (207). In the light of these findings, a role for JNK1 signalling in not yet defined tissues in control of glucose homeostasis seems likely, as neither adipose tissue nor myeloid cell-specific JNK1-deficient mice exhibit a phenotype comparable to conventional JNK1 knockout mice.
Introduction
29
K
+IR Insulin
P P P
PP P
IRS
PP
P
JNK1
IKK complex
TLRs
O OH
Fatty acids
Cytokines TNFα
ER Unfolded
proteins
PS
Obesity
Insulin resistance
Figure 4: Multiple pathomechanisms of insulin resistance.
Obesity induces hyperlipidemia and chronic, low-level inflammation. This leads to fatty acid-mediated activation of TLRs and activates cytokine signalling. In addition, overabundance of lipids and glucose as well as the physiologic response to obesity will increase protein synthesis. When the folding capacity of the ER is surpassed, unfolded proteins will aggregate, thereby inducing ER stress. These stress response pathways eventually lead to activation of JNK1 and IKK signalling, which act as stress sensors. Both JNK and IKK have been shown to phosphorylate serine residues on IRS proteins, blocking IR/IRS binding and downstream signalling, thus inducing insulin resistance. ER, endoplasmatic reticulum; IKK, IκB kinase; IR, insulin receptor;
IRS, insulin receptor substrate; JNK1, c-Jun n-terminal kinase 1; TLR, toll-like receptor; TNFα, tumor necrosis factor α.
Introduction
30
1.12 Central and peripheral inflammation and energy homeostasis
Obesity induces a chronic, low-grade state of inflammation both in animal models and in human patients. Levels of cytokines such as TNFα, interleukin (IL) 6, or acute phase proteins such as C-reactive protein (CRP) are increased in the circulation of obese rodents and humans (202, 203, 208). WAT and WAT-invading immune cells such as macrophages have been shown to be responsible for this low-grade inflammation (203, 208). It is thought that at a certain stage during obesity, adipocytes are overloaded with lipids, and activate programmed cell death (apoptosis). This attracts circulating macrophages into WAT, which can be visualised as so-called crown-like structures in adipose tissue biopsies (209). These activated macrophages are distinct from resident macrophages, as indicated by a more pro- inflammatory expression pattern (210). Cytokine signalling has been shown to induce insulin resistance in tissues crucial for energy homeostasis such as liver and adipose tissue, resulting in hyperglycemia and hyperlipidemia, which in a feed-forward loop can induce expression of pro-inflammatory cytokines (211, 212).
Cytokines can pass the BBB (213). Moreover, certain brain nuclei such as the Arc lack a dense blood brain barrier, which might imply that circulating cytokines engage pro- inflammatory signalling in these regions (130). Therefore, it has been investigated if increased inflammatory signalling can be detected in hypothalamic tissue from obese animal models.
These experiments have shown that hypothalamic pro-inflammatory cytokine content is increased in diet-induced obesity, although it was not determined if these cytokines are produced in an endocrine or paracrine fashion or both (214). In line with this, NFκB signalling is increased in the hypothalamus of diet-induced obese mice, and ablation of IKK2 ameliorates diet-induced obesity (184, 198). Nonetheless, it has not been reported if local expression of pro-inflammatory cytokines is increased, for example by microglia, resident immune cells akin to macrophages (215).
Analysis of the effects of centrally applied TNFα on energy homeostasis has shown conflicting results; whereas some investigators find an anorexigenic effect, some do not (216, 217). It has been noted that during infection, TNFα levels rise by several magnitudes, and that this increase might signal in unknown brain regions to induce infection-associated anorexia (216-218).
The role of IL6 in control of energy homeostasis appears to be highly complex.
Several groups have reported that IL6, which is released by macrophages/microglia, adipocytes, during/after physical activity by muscle tissue, and at very low levels by neurons, induces hepatic insulin resistance in vivo and in vitro, while others report a crucial role for
Introduction
31
hepatic IL6 signalling in improving whole body glucose dispersal (151, 219, 220).
Nonetheless, conventional IL6 knockout mice show adult-onset obesity, which might indicate a role for IL6 in central regulation of body weight control, although CNS-specific IL6 or IL6- receptor knockout mice have not been generated yet (221).
1.13 ER stress and energy homeostasis
Hotamisligil and colleagues first reported that obesity induces hepatic ER stress (222).
During normal cellular function, protein folding in the endoplasmatic reticulum is assisted by chaperones such as glucose-regulated protein (Grp) 78 (223). Under conditions of cellular stress, the amount of misfolded and unfolded proteins in the ER rises, which activates the unfolded protein response (UPR), an indicator of ER stress (224, 225). At least three different signalling pathways are activated by ER stress: the Protein kinase-like Endoplasmic Reticulum Kinase (PERK), the endoribunuclease/kinase inositol-requiring (IRE) 1α, and the activating transcription factor (ATF) 6 (226). Under normal conditions, these sensors are located in the ER membrane and held in an inactive state by bound chaperones. When unfolded proteins aggregate in the ER, the chaperones are sequestered into the ER lumen, which allows activation of the ER stress sensors. Activation of the UPR signalling pathways leads to a reduction in total protein translation, and transcription factors such as C/EBP- homologous protein (CHOP) and x-box binding protein (XBP) 1 are activated, which increase expression of chaperones and enzymes required for protein folding (227). If ER stress persists, the UPR can induce apoptosis (227). ER stress can be caused by viral infections, protein misfolding diseases such as Huntingtons, toxic chemical agents, and as previously mentioned, by obesity (203). Mechanistical insight into how obesity induces ER stress is limited, although oversupply of amino acids, glucose and lipids as well as hyperinsulinemia are known to stimulate transcription and translation, which might overwhelm the protein folding capacity of the ER (228-230). Tissues such as liver, pancreas and WAT, which are crucial for lipid and glucose metabolism and are directly affected by rising glucose and lipid levels, have repeatedly been shown to show high levels of ER stress under obese conditions (202, 203, 223). Importantly, hepatic ER stress was shown to induce insulin resistance by activation of JNK and NFκB signalling (201, 203, 223, 231, 232).
Ozcan and colleagues reported, that partial ablation of neuronal UPR signalling cascades leads to severe leptin resistance and in turn, icv injection of chemical chaperones ameliorates diet-induced obesity (233). In line with this, NFκB signalling is activated by neuronal ER stress, whereas ablation of NFκB signalling also reduces neuronal ER stress by
Introduction
32
unknown mechanisms (184). Taken together, neuronal ER stress induces insulin and leptin resistance, although the specific signalling cascades both upstream as well as downstream of ER stress in the CNS are poorly understood.
1.14 Objectives
The first aim of this study was to analyse the role of PI3K downstream signalling in a defined neuronal population critical for energy homeostasis (POMC neurons) under both ND and HFD conditions. The second aim of this study was to understand the role of inflammatory mediators such as cytokines and lipids partially acting through the stress kinase JNK1 on PI3K signalling in the hypothalamus as well as on a pan-neuronal level.
Besides wild type C57BL/6 mice, the following mutant mouse models were used in this study:
- Mice with POMC cell-specific PDK1 deletion
- Mice with POMC cell-specific PDK1 deletion and overexpression of FOXO1Δ256 - Mice with Nestin cell-specific JNK1 deletion
Materials & Methods
33
2 Materials and Methods
2.1 Chemicals and Biologicals
Size markers for agarose gel electrophoresis (Gene Ruler DNA ladder mix) and for SDS- PAGE (Prestained protein ladder Mix) were purchased from Fermentas, St. Leon-Rot, Germany. For polymerase chain reactions, RedTaq polymerase (Sigma-Aldrich, Seelze, Germany) or DreamTaq (Fermentas, St. Leon-Rot, Germany) were used. Chemicals and enzymes used in this work are listed in Table 1 and 2, respectively.
Table 1: Chemicals
β-Mercaptoethanol (β-M) AppliChem, Darmstadt, Germany ε-aminocaproic acid Sigma-Aldrich, Seelze, Germany 0.9% saline, sterile Delta Select, Pfullingen, Germany 2,2,2-Tribromethanol (Avertin) Sigma-Aldrich, Seelze, Germany
Acrylamide Roth, Karlsruhe, Germany
Agarose (Ultra Pure) Invitrogen, Karlsruhe, Germany
Ammoniumpersulfat Sigma-Aldrich, Seelze, Germany
Aprotinin Sigma-Aldrich, Seelze, Germany
Avidin Biotin Complex – Vectastain Elite Vector, Burlingame, USA
Bacillol Bode Chemie, Hamburg, Germany
Benzamidine Sigma-Aldrich, Seelze, Germany
Bovine serum albumin (BSA) Sigma-Aldrich, Seelze, Germany
Bromphenol blue Marck, Darmstadt, Germany
Calcium chloride Merck, Darmstadt, Germany
Chloroform Merck, Darmstadt, Germany
Diaminobenzidin (DAB) Dako, Denmark
Dimethylsulfoxide (DMSO) Merck, Darmstadt, Germany di-Natriumhydrogenphosphat Merck, Darmstadt, Germany Enhanced chemiluminescence (ECL) kit Perbio Science, Bonn, Germany Ethanol, absolute Applichem, Darmstadt, Germany Ethidium bromide Sigma-Aldrich, Seelze, Germany