hypothalamic neurons that control energy homeostasis in the mouse
I n a u g u r a l - D i s s e r t a t i o n
zur Erlangung des Doktorgrades
der Mathematisch-Naturwissenschaftlichen Fakultät der Universität zu Köln
vorgelegt von
Moritz Paehler
aus Bonn
Köln 2009
Sondern laßt uns angenehmere anstimmen und freudenvollere.
Freude! Freude!
Ludwig van Beethoven
Prof. Dr. Ansgar Büschges
Tag der mündlichen Prüfung: 02.02.2010
Abbreviations 7
Zusammenfassung 10
Abstract 13
1 Introduction 14
1.1 Detailed background . . . 17
1.1.1 Energy homeostasis . . . 17
1.1.2 The hypothalamic energy balance network . . . 18
1.1.3 The PVH and SIM1 neurons . . . 21
1.1.4 Importance of calcium . . . 24
1.1.5 Voltage-gated calcium channels . . . 26
1.1.6 Calcium hypothesis of brain aging . . . 27
2 Methods 29 2.1 Animal care . . . 29
2.2 Preparation of brain slices . . . 30
2.3 Electrophysiology . . . 31
2.4 Fluorimetric calcium measurements . . . 34
2.4.1 Imaging setup . . . 34
2.4.2 Experimental procedures . . . 36
2.4.3 Data analysis of fluorimetric calcium measurements . . . 36
2.5 Single cell labeling and microscopy . . . 47
3.1 POMC neuron morphology . . . 49
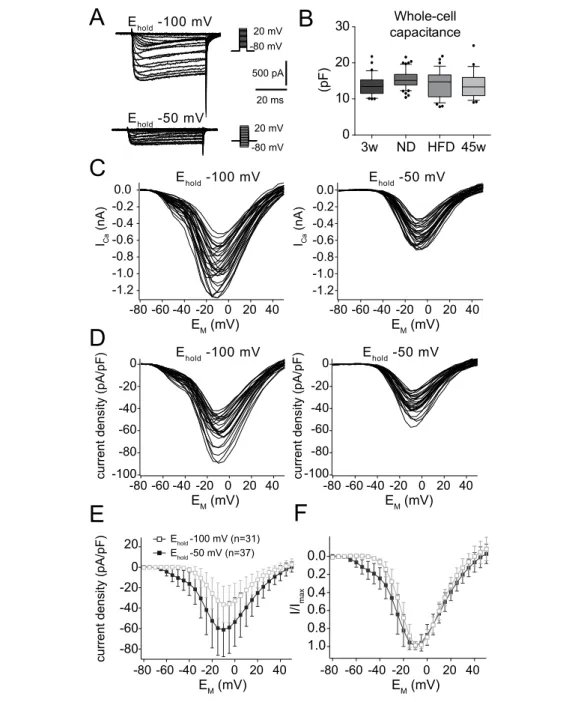
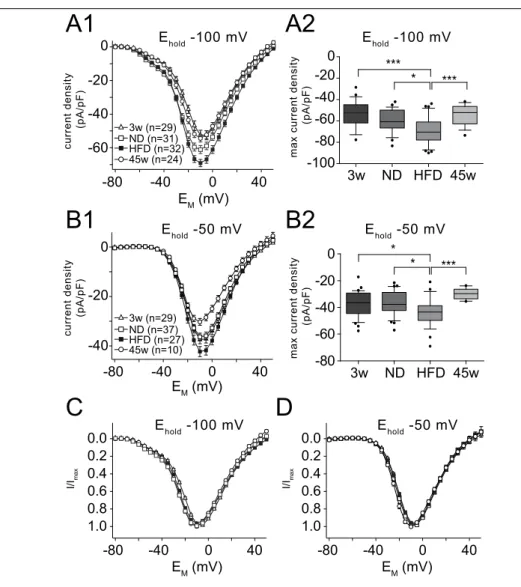
3.2 Voltage-activated calcium currents in POMC neurons . . . 52
3.2.1 Current/voltage relationship . . . 52
3.2.2 Steady-state inactivation . . . 61
3.2.3 Inactivation kinetics of the calcium current during a sustained pulse . . . 63
3.3 Calcium handling in POMC neurons in the ARC . . . 66
3.3.1 Calcium resting level . . . 66
3.3.2 Dye concentration from loading curves . . . 69
3.3.3 Calcium handling properties . . . 72
3.4 POMC and SIM1 neurons in the PVH . . . 77
3.5 Comparison of cellular parameters from SIM1 labeled parvocellular neurons in the PVH . . . 79
3.5.1 Spike frequency adaptation . . . 82
3.5.2 Slow afterhyperpolarization . . . 82
3.5.3 Tolbutamide sensitivity . . . 84
4 Discussion 88 4.1 POMC neurons . . . 88
4.1.1 General properties . . . 89
4.2 Voltage-activated calcium currents in POMC neurons . . . 90
4.2.1 Changes of calcium current parameters . . . 90
4.2.2 Methodical implications . . . 92
4.3 Intracellular calcium handling in POMC neurons . . . 94
4.3.1 Changes in intracellular calcium handling . . . 94
4.3.2 Individual parameters . . . 96
4.3.3 Methodical implications . . . 98
4.3.4 Outlook . . . 99
4.4.1 Parvocellular SIM1 subtypes in the pvPVH and mpPVH . . . 101
List of Tables 104
List of Figures 105
References 107
Acknowledgements 124
Erklärung 126
Teilpublikationen 127
[ Ca 2+ ] i intracellular calcium concentration α-MSH α-melanocyte-stimulating hormone γ Ca 2+ extrusion rate
κ B Ca 2+ binding ratio
κ S endogenous Ca 2+ binding ratio
τ endo endogenous decay time constant of the Ca 2+ signal τ transient measured decay time constant of the Ca 2+ signal C M whole-cell membrane capacitance
E M resting membrane potential
I K ( Ca ) Ca 2+ -dependent potassium current K d dissociation constant
K d, f ura dissociation constant of fura-2 R s series resistance
R max fura-2 fluorescence ratio at saturating calcium concentrations R min fura-2 fluorescence ratio in calcium free conditions
s act slope factor of the Boltzmann equation V 0.5,act voltage where halfmaximal activation occurs
V max command voltage at maximal peak current amplitude 4-AP 4-aminopyridine
E hold holding potential I Ca calcium current
aCSF artificial cerebrospinal fluid
ADU analog-digital units
ARC arcuate nucleus of the hypothalamus ATP adenosine triphosphate
BS beam splitter
BST bed nucleus of the stria terminalis CART cocaine amphetamine related transcript CCD charge-coupled device
CEA central nucleus of the amygdala CNQX 6-cyano-7-nitroquinoxaline-2,3-dione D-AP5 D-2-amino-5-phosphonopentanoate
DMH dorsomedial nucleus of the hypothalamus EGFP enhanced green fluorescent protein
EGTA ethylene glycol tetraacetic acid
EM emission
EX excitation
FFA free fatty acids
GABA γ -aminobutyric acid
GaCSF glycerol-based artificial cerebrospinal fluid
HEPES 4-(2-hydroxyethyl)-1-piperazineethane sulfonic acid HFD high-fat diet
HVA high-voltage-activated ISI interspike interval
K ATP ATP-sensitive potassium channel LH lateral hypothalamic area
LPB lateral parabrachial nucleus LTS low-treshold spike
LVA low-voltage-activated
NA numerical aperture
ND normal diet
NPY neuropeptide Y
NS parvocellular neurosecretory NTS nucleus tractus solitarius PA parvocellular pre-autonomic POMC pro-opiomelanocortin
PTX picrotoxin
PVH paraventricular nucleus of the hypothalamus RET reticular nucleus
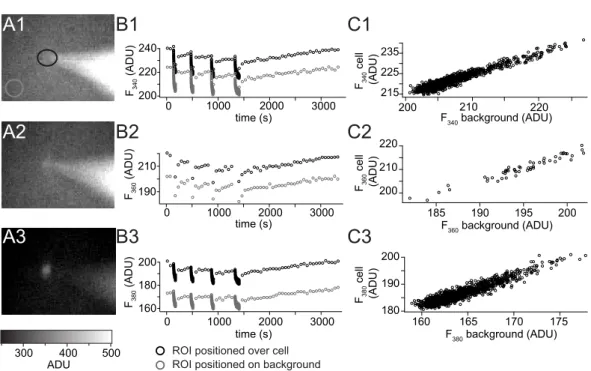
ROI region of interest
RT room temperature
RT-PCR reverse transcription polymerase chain reaction SD standard deviation
SEM standard error of mean SIM1 single-minded 1
TBS TRIS-HCl buffered solution TEA tetraethylammonium chloride
TRIS 2-amino-2-(hydroxymethyl)-1,3-propanediol VGCC voltage-gated calcium channels
VMH ventromedial nucleus of the hypothalamus
Die Fähigkeit, Nährstoffe aufzunehmen und zu verstoffwechseln, ist überlebenswich- tig für jeden Organismus. Höhere Lebewesen müssen ihre Energieaufnahme regu- lieren, da eine positive Energiebilanz über längere Zeit zu Fettleibigkeit und sogar zu frühzeitigem Tod führen kann. Die Energiehomöostase wird dem neurozentri- schem Modell zufolge von einem kleinen neuronalen Subnetzwerk im Hypothala- mus reguliert. Dieses Netzwerk umfasst, neben anderen, sattheitvermittelnde, pro- opiomelanocortin (POMC) exprimierende Neurone und hungervermittelnde, agouti- related protein (AgRP) exprimierende Neurone. Diese integrieren Signale aus der Pe- ripherie über den Nahrungszustand des Organismus und leiten diese Informationen auf Neurone zweiter Ordnung weiter (z.B. SIM1-Neurone im paraventrikulären Nu- kleus des Hypothalamus; PVH). Anhand von diät-induzierten, adipösen Mäuse, die eine Diät mit hohem Fettanteil (HFD) bekommen haben, können die Effekte einer längerandauernden, positiven Energiebilanz auf dieses Netzwerk studiert werden.
Im ersten Teil dieser Arbeit wurden die Effekte der HFD auf die Kalziumhomöostase
von POMC-Neuronen untersucht. Kalzium spielt eine äußerst wichtige Rolle als ’se-
cond messenger’ in vielen zellulären Funktionen wie z.B. der Zellmembranerregbar-
keit, der synaptischen Plastizität, Neurotransmitterfreilassung und aktivitätsabhängi-
ger Genaktivierung. Ableitungen mit der ’whole-cell patch-clamp’-Technik im ’volta-
ge clamp’-Modus wurden an POMC-Neuronen durchgeführt, um den spannungsab-
hängigen Kalziumeinstrom zu charakterisieren. Außerdem wurden die Parameter für
intrazelluläre Kalziumverarbeitung (Kalziumruhekonzentration, Kalizumpufferung,
Kalziumextrusion) bestimmt. Dazu wurden ’whole-cell patch-clamp’-Ableitungen und
schnelle optische Bildgebungsexperimente in Kombination mit dem ’added buffer’-
Kalziumverarbeitung in POMC-Neuronen veränderte. Die Kalziumstromdichte war
in POMC-Neuronen der Mäuse unter HFD erhöht (-69,50 pA/pF) im Vergleich zu
Mäusen, die eine normale Diät (ND) erhielten (-59,63 pA/pF). Zusätzlich war der
Quotient der Kalziumbindung in POMC-Neuronen der Mäuse unter HFD (220) höher
als bei ND-Mäusen (399). Die Kalziumruhekonzentration war in POMC-Neuronen
der HFD-Mäuse fast doppelt so hoch (0,040 µM) wie bei ND-Mäusen (0,021 µM). Die-
se beobachteten, diätabhängigen Veränderungen der Kalziumhomöostase könnten
die Funktion, synaptische Plastizität und synaptische Leistung von POMC-Neuronen
beeinträchtigen und dadurch direkt oder indirekt das Verhalten zur Energieaufnahme
des Tieres beeinflussen. Zum Beispiel könnte die erhöhte Kalziumruhekonzentration
durch die Aktivierung kalziumabhängiger Kaliumkanäle zu einem Verstummen der
POMC-Neurone führen und dadurch möglicherweise auch zu reduzierter Vermitt-
lung des Sattheitsgefühls. Im zweiten Teil der Arbeit wurden Kandidaten für mögli-
che Nachfolgeneurone zu POMC-Neuronen in einer genetisch definierten Population
(SIM1-Neurone) im PVH charakterisiert. Der PVH ist eine bekannte Zielregion von
POMC-Neuronen und es ist bekannt, dass SIM1-Neurone eine wichtige Rolle bei der
Regulation der Energieaufnahme spielen. ’Current clamp patch-clamp’-Ableitungen
in der ’whole-cell’-Konfiguration wurden an identifizierten SIM1-Neuronen durchge-
führt. Subtypen von SIM1-Neuronen im PVH konnten nach ihrem Antwortverhalten
auf Strominjektionen charakterisiert werden und bekannten PVH-Neurontypen zu-
geordnet werden. Es konnte gezeigt werden, dass SIM1-Neurone magnozellulär neu-
rosekretorische, ’bursting’, parvozellulär neurosekretorische (NS) und parvozellulär
prä-autonome (PA) PVH-Neuronsubtypen umfassen. Des weiteren konnte gezeigt
werden, dass die parvozellulären SIM1-Subtypen unterschiedlich sensitiv für den se-
lektiven Blocker des adenosintriphosphat-sensitiven Kaliumkanal (K ATP ) Tolbutamid
sind (22.23 % der abgeleiteten NS-Neuronen reagierten auf Tolbutamid und 92,31 %
der PA-Neurone). Dies könnte auf unterschiedliche Expression des K ATP -Kanals in-
nerhalb der jeweiligen SIM1-Subtypen und damit auf die Existenz verschiedener NS
und PA-Subpopulationen hindeuten.
The ability to take up and metabolize nutrients is vitally important for the survival of every living organism. Higher organisms need to control their energy uptake and expenditure as a positive energy balance over time can lead to obesity and even early death. The regulation of energy homeostasis, according to the neurocentric model, is performed by a small neuronal subnetwork in the hypothalamus. This network com- prises, among others, satiety mediating, pro-opiomelanocortin (POMC) expressing neurons and hunger mediating, agouti-related protein (AgRP) expressing neurons.
They integrate signals from the periphery about the nutritional status of the organ- ism and relay this information onto second order neurons (e.g. SIM1 neurons in the paraventricular nucleus of the hypothalamus; PVH). Diet-induced obese mice that have received a high-fat diet can be used to investigate the effects of a prolonged pos- itive energy balance on this network. In the first part of this thesis, the effects of a high-fat diet on the calcium homeostasis of POMC neurons were investigated. Cal- cium plays a crucial role as a second messenger in many important cellular functions such as membrane excitability, synaptic plasticity, neurotransmitter release and activ- ity dependent gene activation. Whole-cell patch-clamp recordings in voltage clamp were performed to characterize voltage-activated calcium influx in POMC neurons.
Further, to determine the intracellular calcium handling parameters (calcium resting
level, calcium buffering, calcium extrusion) whole-cell patch-clamp recordings and
fast optical imaging were used in combination with the ’added buffer’ approach. The
most important finding was that the high-fat diet affected calcium handling in POMC
neurons. The calcium current density was found to be increased in POMC neurons
Furthermore, the calcium binding ratio of POMC neurons in the high-fat diet cohort
was lower (220) compared to normal diet mice (399). Also, the calcium resting level
of POMC neurons was almost twice as high in the high-fat diet cohort (0.040 µM) as
in the normal diet mice (0.021 µM). These observed diet dependent changes in cal-
cium handling could impair the function, synaptic plasticity and synaptic output of
POMC neurons, thus directly or indirectly influencing the energy uptake behaviour
of the animal. For example, the increase in the calcium resting level could lead to a
silencing of POMC neurons from high-fat diet mice through the activation of calcium
dependent potassium channels, possibly reducing satiety signaling. In the second
part of this thesis, candidates for putative second order neurons to POMC neurons in
a genetically defined neuron population in the PVH (SIM1 neurons) were character-
ized. The PVH is a known target region of POMC neuron terminals and it was shown
by earlier studies that SIM1 neurons in the PVH play an important role in energy
uptake regulation. Current clamp patch-clamp recordings in the whole-cell configu-
ration were performed on identified SIM1 neurons. Subtypes of SIM1 neurons in the
PVH could be characterized according to their reaction to current injection protocols
and matched with neurontypes found in previous studies. It could be shown that the
SIM1 neuron population comprise the magnocellular neurosecretory, bursting, par-
vocellular neurosecretory (NS) and parvocellular pre-autonomic (PA) PVH neuron
subtypes. Additionally, it was found that the parvocellular SIM1 neuron subtypes
differ in their sensitivity to the adenosine triphosphate-sensitive potassium (K ATP )
channel blocker tolbutamide (Only 22.23 % of the recorded NS subtype neurons were
sensitive to tolbutamide and 92.31 % of the PA subtype) suggesting a possible differ-
ential expression of the K ATP channel for each subtype and the possible existence of
subpopulations of NS and PA neurons.
Every living organism needs to take up and metabolize nutrients. This behaviour needs to be tightly regulated. In mammals, the hypothalamus regulates energy up- take and expenditure by integrating afferent and humoral input that conveys infor- mation about the nutritional state of the body (Schwartz and Porte, 2005). Disregu- lation of this system can lead to obesity and the metabolic syndrome including type 2 diabetes and heart disease (Huxley et al., 2009). These are a major health risks and a great public health threat to western societies (World Health Organization, 2009;
Finkelstein et al., 2009). The current, neurocentric network model of energy home- ostasis proposes that antagonistic first-order neurons in the arcuate nucleus of the hypothalamus (ARC), such as pro-opiomelanocortin (POMC) neurons and agouti- related protein (AgRP) neurons, integrate information coming from, among others, peripheral tissues (e.g. adipose tissue, pancreas, gut). These neurons synapse onto second-order neurons (possibly SIM1 neurons; Balthasar et al., 2005) in many brain regions and subnuclei of the hypothalamus, e.g. the paraventricular nucleus of the hypothalamus (PVH; Swanson, 2000; Cone, 2005; Fig. 1.1).
In many neuronal processes, calcium plays an important role, such as synaptic plas-
ticity, release of neurotransmitter, membrane exictability, enzyme activation and ac-
tivity dependent gene activation. Its cytosolic concentration is elevated mainly by
influx through voltage-gated Ca 2+ channels (VGCC). Because of its many functions, Ca 2+ signaling has to be tightly regulated in duration and location inside the neuron (Augustine et al., 2003). Disregulation of Ca 2+ homeostasis can lead to impairment of neuronal function, synaptic activity and synaptic plasticity. For example, subtle changes in neuronal Ca 2+ homeostasis seem to be a major factor for the cognitive de- cline in old age. Interestingly, this can be attenuated by caloric restriction (Toescu and Verkhratsky, 2007; Murchison and Griffith, 2007).
To better understand hypothalamic energy balance, diet-induced obese (Archer and Mercer, 2007) and knockout mice (Sauer and Henderson, 1988; Gu et al., 1994) can be generated and studied by analyzing the performance of the animal in various tests.
However, comparatively little knowledge is gained about the properties of the neu-
rons within the hypothalamus and their cellular parameters. The difficulty of identi-
fying these neurons in the living tissue has hindered the study of single neurons with
whole-cell patch-clamp electrophysiology within this network for a long time. Re-
cent advances in genetics now allow to label specific neurons in the hypothalamus by
expressing fluorescent proteins, such as enhanced green fluorescent protein (EGFP),
under the control of neuron specific promoters. The mice used in this thesis express
EGFP under the transcriptional control of mouse Pomc and Sim1 genomic sequences
(Fig. 1.2, C & D; Fig. 3.12, B, C; Cowley et al., 2001; Balthasar et al., 2005). This al-
lows to distinguish POMC and SIM1 neurons unequivocally from other cells in the
living tissue by their EGFP fluorescence and perform whole-cell patch-clamp record-
ings from identified neurons. This further allows to investigate the cellular proper-
ties (e.g. neuroanatomy, active membrane properties, Ca 2+ handling) of genetically
identified neurons in the energy homeostatic network. In addition, these data can be
combined with insights gained from neuron specific knockout mice, joining two very
powerful analytical toolsets. Ultimately, this will help to gain a better understanding of energy homeostasis, its principal components and their properties that underlie the regulation of food intake and energy expenditure. This understanding will enable us to come up with novel solutions for the social and economic burden of obesity and obesity-related diseases.
Aim of this thesis
The aim of this thesis was to better comprehend the components (and their cellular properties) of the hypothalamic network that regulates energy balance and establish a framework for future studies. The goal was approached in two parts.
First, to better understand calcium handling in first order neurons of the energy homeostatic network, (a) the calcium influx in POMC neurons was characterized by performing whole-cell patch-clamp voltage clamp recordings in hypothalamic brain slices, from mice fed either a high fat or a normal diet, and (b) the calcium buffering capacity and extrusion rate of POMC neurons of these mice were determined using the ’added buffer’ approach. This was achieved by performing ratiometric calcium imaging experiments in combination with whole-cell patch-clamp recordings of iden- tified POMC neurons in hypothalamic brain slices.
Second, potential candidates for second-order neurons to POMC neurons in the
paraventricular nucleus of the hypothalamus were characterized performing whole-
cell patch-clamp current clamp recordings in a genetically identified subpopulation
of PVH neurons: SIM1 neurons.
1.1 Detailed background
In order to survive, every living organism needs to take up and metabolize nutrients.
In vertebrates this behaviour needs to be tightly regulated because even a minute imbalance in energy homeostasis can lead to obesity, disease and even early death.
In humans, being obese is a major risk factor for hypertension, stroke, cancer and metabolic syndrome including type 2 diabetes and heart disease (Must et al., 1999;
Huxley et al., 2009; Osmond et al., 2009). Currently, the increasing prevalence of obe- sity and obesity-related diseases in the western society are a great public health threat of pandemic proportions (World Health Organization, 2009; Finkelstein et al., 2009).
As obese people grow older, the risk of manifestation of these diseases increases, espe- cially in the second half of life (Thompson et al., 1999). Obesity also increases the risk of reduced cognitive function, accelerates cognitive aging and increases the risk neu- rodegenerative disease, such as dementia and Alzheimer’s disease (Luchsinger and Mayeux, 2007; Yaffe, 2007). In rodents, obesity can be elicited by feeding a high fat diet (diet-induced obesity) because it mimics the unnatural environment of modern society with minimal essential activity and access to highly-nutritious, energy-dense food (Surwit et al., 1988; West et al., 1992; Archer and Mercer, 2007). A better un- derstanding of energy homeostasis and its principal components will help to devise strategies to overcome this social and economic scourge.
1.1.1 Energy homeostasis
In healthy vertebrates, the brain regulates food intake and energy expenditure in re-
sponse to the body’s nutritional status (Figure 1.1). The nutritional status is conveyed
by peripheral signals of the pancreas, adipose tissue and the intestinal tract. These
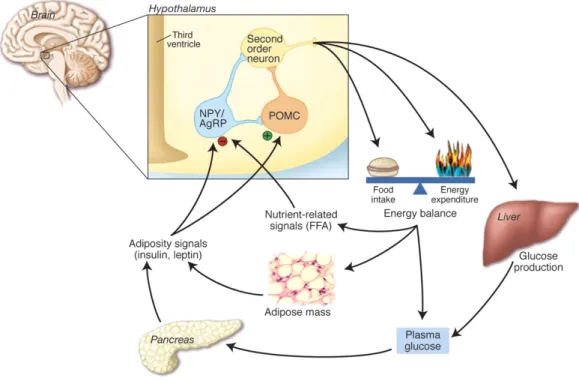
Figure 1.1: Diagram depicting the neurocentric model of energy homeostasis. Food intake and en- ergy expenditure are regulated by the brain in response to afferent input and signals from peripheral tissue. These signals include hormones, such as insulin and leptin, but also nutrient related signals, such as free fatty acids and glucose. A small neuronal subnetwork in the hypothalamus containing AgRP/NPY and POMC neurons integrates signals about the nutrient state of the organism and regu- lates substrate metabolism and food intake accordingly. AgRP: Agouti-related protein, FFA: free fatty acids, NPY: neuropeptide Y, POMC: pro-opiomelanocortin. Modified from Schwartz (2005).
signals are released into the blood and reach the brain together with afferent input (Arora and Anubhuti, 2006; Morton et al., 2006). Among others, two major signals are identified today: leptin (produced by adipose tissue) and insulin (produced by the pancreas). Both peptides are released into the blood proportionally to the amount of body fat and pass the blood-brain barrier in proportion to their plasma concentration (Saltiel and Kahn, 2001).
1.1.2 The hypothalamic energy balance network
Lesion studies in the 1940s showed that there are discrete regions of the hypothala-
mus that are essential in regulating food intake (Fig. 1.2, A & B). Destruction of the hy-
Bregma -1.70 mm
DMH
VMH
ME
ARC 3V
A B
C D
3V
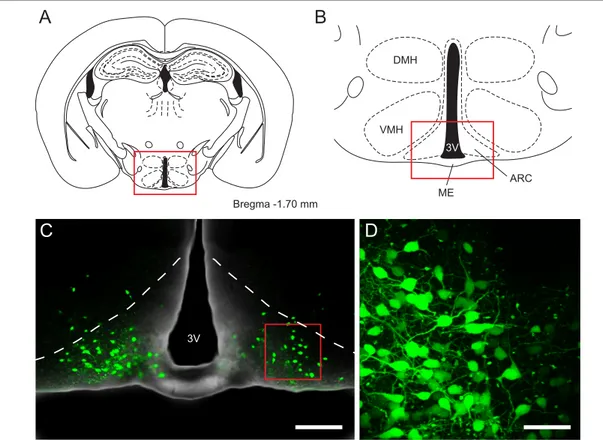
Figure 1.2: Overview of hypothalamic nuclei involved in energy homeostasis and the location of POMC neurons expressing enhanced green fluorescent protein (EGFP). (A) Schematic representa- tion of a coronal section of the mouse brain. The area of the red box is shown in B . (B) Overview of hypothalamic nuclei involved in energy homeostasis including the dorsomedial, ventromedial and ar- cuate nucleus of the hypothalamus. The area of the red box is shown in C. (C) Merged fluorescence and transmission image depicting the arcuate nucleus (outlined by the dashed line) and POMC neu- rons expressing EGFP. The area of the red box is shown in D. (D) Maximum intensity projection of a fluorescence image stack of POMC neurons expressing EGFP in the arcuate nucleus. Fluorescence images were acquired in the living slice using multiphoton microscopy. Scale bar in C: 200 µm, in D:
50 µm. 3V: third ventricle, ARC: arcuate nucleus of the hypothalamus, DMH: dorsomedial nucleus of the hypothalamus, ME: median eminence, VMH: ventromedial nucleus of the hypothalamus. A and B modified from Paxinos and Franklin (1997).
pothalamic arcuate (ARC), ventromedial (VMH), dorsomedial (DMH) and paraven- tricular (PVH) nuclei in rats resulted in severely obese animals. Contrarily, destruction of the lateral hypothalamic area (LH) lead to a decrease in food intake (Hetherington and Ranson, 1940; Miller et al., 1950; Stevenson, 1970).
In the mid-nineties, the discovery of leptin and the gene encoding it, by means of
obese, leptin deficient ob/ob mice, marked another great step in the understanding of
energy regulation (Zhang et al., 1994; Halaas et al., 1995; Pelleymounter et al., 1995;
Campfield et al., 1995). Additionally, leptin receptors could be cloned and localized in the ARC and the VMH (Tartaglia et al., 1995; Mercer et al., 1996). Apart from classical insulin target regions (in skeletal muscle, adipose tissue and the liver), insulin recep- tors are also found in the brain where specific insulin receptor knockout resulted in obese mice (Brüning et al., 2000). Injection of insulin into the cerebral ventricles of mice resulted in increased expression of the anorectic peptide precursor protein pro- opiomelanocortin (POMC) and reduction of food uptake (Benoit et al., 2002).
To this day, a model has emerged which involves two antagonistic types of hypotha- lamic neurons located in the ARC: neurons expressing the satiety mediating (orexi- genic) polypeptides pro-opiomelanocortin (POMC) and cocaine amphetamine regu- lated transcript (CART), and neurons which express the hunger mediating (anorexi- genic) peptides agouti-related protein (AgRP) and neuropeptide Y (NPY; Hahn et al., 1998; Cone, 2005). In the current model, POMC neurons are activated by leptin, trig- gering the release of α-melanocyte-stimulating hormone (α-MSH) from POMC axon terminals. α-MSH in turn activates the melanocortin 4 receptor (MC4R) in second- order neurons (e.g. in the PVH) leading to reduced food intake and increased en- ergy expenditure (Elias et al., 1999; Cowley et al., 2001). Secondly, leptin suppresses NPY/AgRP neuron activity, which in turn would antagonize the activity of α-MSH.
Furthermore, NPY/AgRP neurons also inhibit POMC activity through the action of NPY and γ-aminobutyric acid (GABA) releasing synapses onto POMC neurons lead- ing to increased food intake.
POMC neurons from the ARC project to a diverse range of locations in the brain.
These target areas include: the bed nucleus of the stria terminalis (BST), the central
nucleus of the amygdala (CEA), the lateral parabrachial nucleus (LPB), the lateral
hypothalamic area (LH), the nucleus tractus solitarius (NTS), the reticular nucleus
(RET) and the paraventricular nucleus of the hypothalamus (PVH; reviewed in Cone, 2005).
1.1.3 The PVH and SIM1 neurons
In addition to controlling ingestive behaviour of food and drink, the PVH is also thought to be involved in neuroendocrine and autonomous regulation of the car- diovascular system, water homeostasis, milk ejection and uterine contraction during child birth (Malpas and Coote, 1994; Stocker et al., 2004; Lincoln and Wakerley, 1974;
Summerlee and Lincoln, 1981). The PVH is a complex hypothalamic nucleus that can be divided into at least eight, clearly distinguishable subdivions and contains approx- imately 30 different putative neurotransmitters (Swanson and Sawchenko, 1983). The cellular parameters of PVH neurons have been studied previously in great detail and several neuron types could be characterized (Tasker and Dudek, 1991; Hoffman et al., 1991; Tasker and Dudek, 1993; Luther and Tasker, 2000; Luther et al., 2000; Stern, 2001;
Luther et al., 2002; Melnick et al., 2007). In these studies, the neuron types were found
to be confined to relatively discrete subdivisions of the PVH and could be classified
not only by their location but also by soma size, immunoreactivity and electrophysio-
logical response to current injection. The following classes of neuron types have been
identified so far and can be grouped into three main categories: (1) neurosecretory
magnocellular, (2) bursting and (3) parvocellular neurons. Magnocellular neurons are
located in the ventral and lateral subdivisions of the PVH and project to the neurohy-
pophysis. Bursting neurons are located laterally and ventrolaterally of the PVH and
the third ventricle. They are hypothesized to be inhibitory interneurons (Tasker and
Dudek, 1991). Parvocellular neurons are generally located in the more medial and
dorsal regions of the PVH. They can be subdivided into (a) parvocellular neurosecre-
A
B
D
C
Magnocellular Bursting Parvocellular,
neurosecretory Parvocellular, pre-autonomous
*
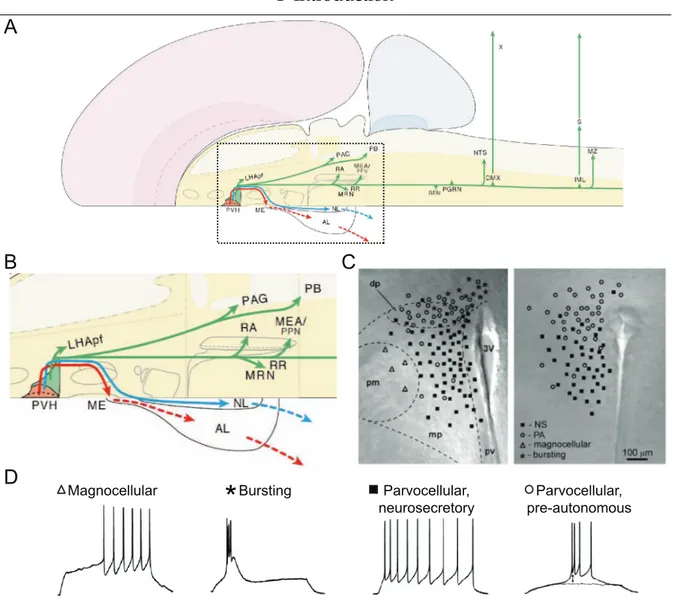
Figure 1.3: Output projections from the PVH and the corresponding neuron types. (A) Schematic
representation of a dorsal view on a mammalian brain hemisphere illustrating the output projections
originating from the PVH. (B) Enlarged view of area marked with a dotted line in A of the short range
projections originating from the PVH. The projections of magnocellular neurons are shown in blue,
of parvocellular neurosecretory neurons in red and those of parvocellular pre-autonomous neurons
are shown in green. (C) Schematic overlay of a transmission image of the PVH visualizing the dis-
tribution of the different neuron types. (D) Electrophysiological profiles of PVH neurons. Represen-
tative traces of the membrane potential during positive current injection. Magnocellular neurons are
characterized by a delayed onset in action potential firing upon depolarization. Bursting neurons dis-
play large, high-frequency bursts of action potentials superimposed on low-threshold spikes during
depolarization. Parvocellular neurosecretory neurons display tonic action potential firing and weak
spike-frequency adaptation. Parvocellular pre-autonomic neurons fire a low-threshold spike upon hy-
perpolarization or by depolarization from membrane potentials more hyperpolarized than the resting
membrane potential. 3V : third ventricle, AL : anterior lobe pituitary, dp : dorsal cap, DMX : dorsal motor
nucleus vagus, IML : intermediolateral preganglionic column, LHApf : perifornical lateral hypothalamic
area (tuberal level), mp : medial parvocellular subdivision, ME : median eminence, MEA : midbrain ex-
trapyramidal area, MRN : mesencephalic reticular nucleus, MZ : marginal zone, NL : neural (posterior)
lobe pituitary, NTS : nucleus of the solitary tract, PAG : periaqueductal gray, pm : posterior magnocellular
subdivision, pv : periventricular parvocellular subdivision, PB : parabrachial nucleus, PGRN : paragigan-
tocellular reticular nucleus (ventrolateral medulla), PPN : pedunculopontine nucleus, RA : raphe nuclei,
RR: retrorubral area, S: sympathetic ganglia, SSN: superior salivatory nucleus, X: vagus nerve. A and
B modified from Swanson (2000). C and D were modified from Melnick et al. (2007).
tory neurons that project to the median eminence regulating hormone release from the anterior pituitary gland and (b) parvocellular pre-autonomous neurons (PA) that send long projections to the autonomic brain centers in the brain stem and spinal cord (Swanson et al., 1980; Sawchenko and Swanson, 1982; Swanson and Sawchenko, 1983;
Swanson, 2000, Fig. 1.3, A – C). The classification of these neuron types correlates with their electrophysiological responses to current injection (Fig. 1.3, D). Magnocel- lular neurons are characterized by a delayed onset in action potential firing upon de- polarization and show weak spike-frequency adaptation. Bursting neurons display large, high-frequency bursts of action potentials superimposed on sometimes repet- itive low-threshold spikes during depolarization (Tasker and Dudek, 1991). Parvo- cellular neurosecretory neurons respond to depolarizing current injection with tonic action potential firing and weak spike-frequency adaptation (Luther et al., 2002). Par- vocellular pre-autonomic neurons fire a low-threshold spike upon hyperpolarization or by depolarization from membrane potentials more hyperpolarized than the resting membrane potential (Tasker and Dudek, 1991).
The periventricular (pv) and medial parvocellular (mp) subdivisions of the PVH
receive a dense innervation from POMC neuron fibers. The pv- and mpPVH are also
regions with a high density of α-MSH receptor (MC4R) expression, suggesting that
these are target regions where POMC neurons synapse onto second-order neurons
(Elmquist et al., 1997; Bagnol et al., 1999; Cowley et al., 1999; Bouret et al., 2004). Addi-
tionally, Balthasar and colleagues were able to show that hyperphagia induced by the
knockout of the MC4R could be rescued by selective restoration of MC4R in neurons
expressing SIM1 in the PVH. This finding suggests that there is (a) a divergence in the
pathway regulating energy uptake and energy expenditure and, more importantly,
(b) that SIM1 neurons in the PVH play an important role in this pathway (Balthasar et
al., 2005).
SIM1 was originally identified in the fruit fly Drosophila as part of the single-minded gene family where it plays a critical role in the development of the midline neuroep- ithelium during embryonic development (Nambu et al., 1991; Fan et al., 1997). Evi- dence also suggests that SIM1 is needed for proper axon targeting during the devel- opment of the mammalian CNS (Marion et al., 2005). In humans, haploinsufficiency of the SIM1 homolog is associated with hyperphagic obesity and Down syndrome (Fan et al., 1997; Holder et al., 2000; Faivre et al., 2002). In mice, SIM1 heterozygous ani- mals display hyperphagia, increased linear growth and susceptibility to diet-induced obesity (Ema et al., 1996).
Despite this amount of information, it is still unclear what the electrophysiological properties of SIM1 neurons are and which known PVH subtypes they contain.
1.1.4 Importance of calcium
Calcium plays a crucial role in many important cellular functions. In neurons, Ca 2+
contributes directly to the membrane potential as a charge carrier, but also as a second messenger that controls a variety of cellular processes. These include synaptic plastic- ity, release of neurotransmitter, membrane exictability, enzyme activation and activity dependent gene activation (Berridge et al., 2003). To selectively fulfill this multitude of important tasks, the cytosolic free calcium concentration needs to be tightly regulated in amplitude, location and duration (Augustine et al., 2003).
The single compartment model is a simplified model of intracellular calcium dy-
namics to describe the cellular parameters that shape an intracellular Ca 2+ signal
(these include kinetics of Ca 2+ sources, properties of intracellular Ca 2+ buffering pro-
teins, rate of Ca 2+ clearance; Fig. 1.4, A). It can also be used to better understand how
A
B control double
calcium influx double
calcium binding ratio half clearance rate
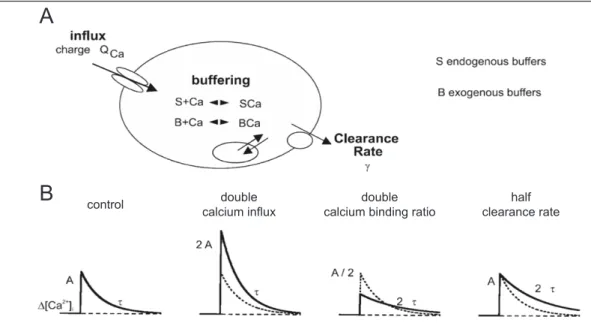
Figure 1.4: Schematic overview of the single compartment model. (A) Cellular parameters that shape the intracellular Ca 2+ signal. They are mainly determined by the calcium source (influx or release from intracellular stores), the properties of intracellular Ca 2+ buffers (calcium binding proteins) and the Ca 2+
extrusion from the cytosol (to extracellular space and internal stores). (B) Simulation demonstrating how the cellular calcium handling parameters influence the actual calcium signal. A stimulus under control conditions transiently increases the intracellular Ca 2+ concentration ( [ Ca 2+ ] i ) with a given am- plitude (A) that decays to baseline with a given time constant (τ). Doubling the calcium influx results in a doubling of the signal amplitude. Doubling the Ca 2+ binding ratio results in a bisection of the amplitude and a doubling of the time constant. Halving the clearance rate doubles the time constant of the decay. The control trace is drawn as a dashed curve for comparison. Modified from Helmchen and Tank (2005).
the relationship between influx, buffering and clearance influences the actual calcium signal (Fig. 1.4, B). This needs to be considered, because the fluorescent Ca 2+ indica- tor used to measure the Ca 2+ signal in whole-cell patch-clamp experiments acts as an added exogenous Ca 2+ buffer that distorts the endogenous calcium buffering of the cell. To determine the endogenous Ca 2+ handling parameters, such as endogenous de- cay time constant of the calcium signal, endogenous calcium binding ratio and extru- sion rate, we used the ’added buffer’ approach. The ’added buffer’ approach is based on the single compartment model and was used in combination with patch-clamp recording and fast optical imaging (Neher and Augustine, 1992; Helmchen et al., 1997;
Pippow et al., 2009).
1.1.5 Voltage-gated calcium channels
The main source for intracellular calcium is influx via voltage-gated calcium channels (VGCC). VGCCs are transmembrane proteins consisting of a pore forming main unit (α 1 or Ca v ) and auxiliary/regulatory subunits (the α 2 δ dimer, β and γ monomers).
The main unit consists of four homologous domains, each containing six membrane segments (S1 – S6). These segments are involved in forming the pore (S5 – S6) and voltage sensing (S4; reviewed in Catterall, 2000). Many types of VGCCs have been found in vertebrates that vary in their voltage sensitivity, conductance, kinetics and pharmacology. They can be categorized broadly into two main groups by their thresh- old of activation: high-voltage-activated (HVA) channels that are activated at more positve membrane potentials and low-voltage-activated (LVA) channels that are acti- vated at lower membrane potentials. A recent nomenclature proposes a classification into three structurally related families (Ca v 1, HVA; Ca v 2, HVA; Ca v 3, LVA; Ertel et al., 2000). The Ca v 1-family (Ca v 1.1 – 1.4) comprises the historically dubbed L-type channels that are ubiquitously expressed and can be selectively blocked by 1,4-dihy- dropyridines, phenylalkylamines and benzothiazepines (Triggle, 2006). They play an important role in activity dependent gene regulation, contraction in muscle cells and hormone secretion. The Ca v 2-family (Ca v 2.1 – 2.3) comprises the formerly named P/Q- (Ca v 2.1), N- (Ca v 2.2) and R-type channel (Ca v 2.3). These channels are promi- nently found in neurons, especially in dendrites and nerve terminals, but also in the soma (Ca v 2.3). They are mostly responsible for neurotransmitter release, dendritic calcium transients and the generation of Ca 2+ -dependent action potentials (Ca v 2.3).
Except for R-type channels (Ca v 2.3), the channel types of this group can be selec- tively blocked by toxins from either the grass spider Agelenopsis aperta (ω-agatoxins;
Ca v 2.1) or cone snails (Conus spec.; ω-conotoxins; Ca v 2.2; Randall and Tsien, 1995).
The Ca v 3-family (Ca v 3.1 – 3.3) comprises the formerly named T-type channels. T- type channels are found in muscle cells where they play an important part in smooth muscle contraction and in neurons where they are involved in pacemaking, repetitive firing and the generation of bursts or low-threshold spikes (Perez-Reyes, 2003). There are no highly selective blockers available for T-type channels. They are, however, sensitive to organic compounds, such as amiloride and mibefradil (Tang et al., 1988;
Mehrke et al., 1994).
1.1.6 Calcium hypothesis of brain aging
Impaired Ca 2+ handling in neurons of the central nervous system can have dramatic consequences. They range from altered neuronal output up to neuronal death, altered behaviour or even disease (Marambaud et al., 2009). Even if the changes in Ca 2+ home- ostasis are only subtle, the effect on the organism can be profound over time. This is the core idea of the ’calcium hypothesis’ of neuronal aging (Khachaturian, 1987;
Landfield, 1987). It proposes that during aging, the dysregulation of Ca 2+ handling increases the Ca 2+ load on the cell resulting in a sustained elevation of intracellu- lar free Ca 2+ and subsequently leading to neuronal cell loss through the neurotox- icity of Ca 2+ . The aspect of the neurotoxicity of increased free Ca 2+ proved to be incorrect for cognitive decline during aging but may still be valid for neurodegener- ative diseases associated with aging, such as Alzheimer’s (Mattson and Chan, 2003;
Verkhratsky and Toescu, 2003). Nevertheless, subtle changes in Ca 2+ homeostasis over
longer periods of time are still viewed as an important factor for impaired neuronal
function, synaptic activity and synaptic plasticity in old age (Toescu and Verkhratsky,
2007). Studies analyzing the Ca 2+ homeostasis in aged animals found that in most
aged neurons not only the resting Ca 2+ level does increase, but also the Ca 2+ influx via
voltage-gated Ca 2+ channels (Kirischuk et al., 1992; Kirischuk and Verkhratsky, 1996;
Murchison and Griffith, 1995; Thibault and Landfield, 1996). Further studies indicate that the Ca 2+ buffering capacity of neurons also seems to play an important role in the cognitive decline during aging (Tonkikh et al., 2006). However, the trend can vary between peripheral and central neurons or even within a region (Pottorf et al., 2002;
Murchison and Griffith, 1998; Murchison and Griffith, 2007; Bu et al., 2003). Interest- ingly, caloric restriction during aging had an impact on calcium buffering properties, dampening the effects of aging on central nervous neurons (Hemond and Jaffe, 2005;
Murchison and Griffith, 2007). This demonstrates a possible connection between
diet and neuronal calcium homeostasis. Most studies concerning changes in calcium
homeostasis and impairment of neuronal activity focus on neurons involved in mem-
ory formation and cognition. The disregulation of calcium homeostasis in neurons of
the hypothalamus (e.g. POMC neurons), however, is not well understood. Moreover,
it is tempting to ask whether a high caloric diet (e.g. high-fat diet) has an impact on
the calcium homeostasis in POMC neurons. This, in turn, would have a dramatic im-
pact on the organism considering the important role POMC neurons play in energy
balance behaviour.
2.1 Animal care
Care of all animals was within institutional animal care committee guidelines. All
animal procedures were approved by local government authorities (Bezirksregierung
Köln, Cologne, Germany) and were in accordance with NIH guidelines. Mice were
housed in groups of 3 – 5 at a temperature of 22 – 24 °C with a 12 h light/12 h dark cy-
cle. After weaning (P21), mice were either fed regular chow food (ND; Teklad Global
Rodent 2018; Harlan) containing 53.5 % carbohydrates, 18.5 % protein, and 5.5 % fat
(12 % of calories from fat) or a high-fat diet (HFD; C1057; Altromin) containing 32.7 %
carbohydrates, 20 % protein, and 35.5 % fat (55.2 % of calories from fat). Animals had
ad libitum access to water and chow at all times. Calcium handling was analyzed
in brain slices from P14 – P21 (3w), P105 – P140 (ND and HFD) and P304 – P334
(45w) old C57BL/6J mice expressing EGFP selectively in POMC neurons (Cowley et
al., 2001). The cellular properties of SIM1 neurons were determined in brain slices
from C57BL/6J mice expressing EGFP selectively in SIM1 neurons (Balthasar et al.,
2005). All mice used in this thesis were kindly provided by the lab of Jens Brüning.
2.2 Preparation of brain slices
The animals were anesthetized with halothane (B4388; Sigma-Aldrich, Taufkirchen,
Germany) and decapitated. The brain was rapidly removed from the skull cavity,
cut at the brainstem and glued to a holding plate with superglue (Pattex Blitz Kle-
ber gel, Henkel, Düsseldorf, Germany). Coronal slices (250 – 300 µm) were cut with
a vibrating microtome (Microm HM 650 V; Thermo Scientific, Walldorf, Germany) in
4 °C cold, carbogenated (95 % O 2 /5 % CO 2 ), glycerol-based, modified artificial cere-
brospinal fluid to enhance the viability of neurons (GaCSF; Ye et al., 2006). GaCSF con-
tained (in mM): 250 Glycerol, 2.5 KCl, 2 MgCl 2 , 2 CaCl 2 , 1.2 NaH 2 PO 4 , 10 4-(2-hydroxy-
ethyl)-1-piperazineethane sulfonic acid (HEPES), 21 NaHCO 3 , 5 Glucose, adjusted with
NaOH to pH 7.2, resulting in an osmolarity of 310 mOsm. All chemicals, unless
stated otherwise, were obtained from Sigma-Aldrich or Applichem (Darmstadt, Ger-
many) in analytical grade purity. The brain slices were then transferred into carbo-
genated artificial cerebrospinal fluid (aCSF). First, they were kept for at least 20 min
in a recovery bath at 35 °C and then kept at room temperature (24 °C, RT) for at
least 30 min prior to recording. The aCSF solution contained (in mM): 125 NaCl,
2.5 KCl, 2 MgCl 2 , 2 CaCl 2 , 1.2 NaH 2 PO 4 , 10 HEPES, 21 NaHCO 3 , 5 Glucose, adjusted
with NaOH to pH 7.2, resulting in an osmolarity of 310 mOsm. During the recordings,
slices were continuously superfused with aCSF at 2 – 3 ml/min. The slice was held in
place with a stainless steel slice hold-down with 1 mm thread spacing (SHD-26H/10,
Warner Instruments, Hamden, CT). Neurons were visualized by infrared differen-
tial interference contrast video-enhanced microscopy, with a charge-coupled device
(CCD) video camera (VX55, TILL Photonics, Planegg, Germany), mounted on a fixed
stage upright Olympus BX51WI microscope (Olympus, Hamburg, Germany) with 40x
LUMplan FI/IR 0.8 and 60x LUMplan FI/IR 0.9 water immersion objectives (Dodt and Zieglgänsberger, 1990). Healthy neurons were selected by the following criteria:
three-dimensional, non-transparent appearance, smooth and bright membrane. EGFP expressing cells were visualized with widefield fluorescence microscopy using an X- Cite 120 illumination system (EXFO Photonic Solutions, Ontario, Canada) in combi- nation with a Chroma 41001 fluorescence filter set (EX: HQ480/40x, BS: Q505LP, EM:
HQ535/50m, Chroma, Rockingham, VT).
2.3 Electrophysiology
Membrane potential and ionic currents of POMC neurons were measured in cur- rent and voltage clamp respectively using the patch-clamp technique in the whole- cell configuration (Hamill et al., 1981). Electrodes with a tip resistance between 3 – 4 MΩ were produced with a temperature controlled pipette puller (PP-830; Nar- ishige, London, UK) from borosilicate glass capillary tubing (GB150-8P, 0.86 x 1.5 x 80 mm, Science Products, Hofheim, Germany). Whole-cell patch-clamp recordings were performed with an EPC9 patch-clamp amplifier (HEKA) controlled by the soft- ware Pulse v8.63 (HEKA). The sample interval was 10 kHz; tail currents were sam- pled at 20 kHz. The signal was filtered with a series combination of two short-pass Bessel filters with a cut-off frequency of 2.9 kHz and 10 kHz. Pipette and membrane capacitance were compensated using the automatic compensation circuit of the EPC9.
Voltage errors due to series resistance (R S ) were minimized using the R S compen-
sation of the EPC9. R S compensation was set to 60 – 80% with a time constant (τ)
of 100 µs. To remove uncompensated leakage and capacitive currents, a p/6 pro-
tocol was used (Armstrong and Bezanilla, 1974). Stimulus protocols used for each
set of experiments are provided in the Results. The liquid junction potential against the extracellular solution (see Neher, 1992) was calculated for each pipette solution using Igor Pro v6.01 (WaveMetrics, Inc., Lake Oswego, OR) and Patcher’s Power- tools plug-in for Igor Pro, v2.04 (Mendez and Würriehausen, Max-Planck-Institut für biophysikalische Chemie, Abt. Membranbiophysik, Göttingen, Germany; http:
//www.mpibpc.mpg.de/groups/neher/core.php?page=software) and was compen- sated.
Current clamp electrophysiology
For pure current clamp electrophysiology experiments, the patch pipette was filled with a solution containing (in mM): 135 K-gluconate, 10 KCl, 2 MgCl 2 , 10 HEPES, 0.1 ethylene glycol tetraacetic acid(EGTA), 3 KATP, 0.3 NaGTP adjusted to pH 7.2 with KOH resulting in ∼ 300 mOsm. Tolbutamide (200 µm; Sigma) was dissolved in di- methyl sulfoxide (DMSO) and added to the normal aCSF with a final DMSO concen- tration of 0.25 %. The DMSO concentration had no obvious effect on the investigated neurons.
Calcium currents
To isolate Ca 2+ currents, a combination of pharmacological blockers and ion substitu-
tion was used. The extracellular solution for measuring Ca 2+ currents contained (in
mM): 103 choline-Cl, 2.5 KCl, 2 MgCl 2 , 3 CaCl 2 , 1.2 NaH 2 PO 4 , 10 HEPES, 21 NaHCO 3 ,
5 Glucose, 0.001 tetrodotoxin (TTX, T-550, Alomone, Jerusalem, Israel), 4 4-aminopyri-
dine (4-AP), 20 tetraethylammonium (TEA)-Cl, 0.1 Picrotoxin (PTX), 0.05 D-2-amino-
5-phosphonopentanoate (D-AP5), 0.01 6-cyano-7-nitroquinoxaline-2,3-dione (CNQX)
adjusted with NaOH to pH 7.2, resulting in an osmolarity of 310 mOsm. The pipette
solution contained in (mM): 133 CsCl, 2 MgCl 2 , 1 CaCl 2 , 10 HEPES, 10 EGTA, 3 KATP, 0.3 NaGTP adjusted to pH 7.2 with KOH, resulting in ∼ 290 mOsm.
Calcium imaging
For Ca 2+ imaging experiments, the extracellular solution contained (in mM): 125 NaCl, 2.5 KCl, 2 MgCl 2 , 2 CaCl 2 , 1.2 NaH 2 PO 4 , 10 HEPES, 21 NaHCO 3 , 5 Glucose, 0.1 PTX, 0.05 D-AP5, 0.01 CNQX adjusted with NaOH to pH 7.2, resulting in an osmolarity of 310 mOsm. The pipette solution contained (in mM): 135 K-gluconate, 10 KCl, 2 MgCl 2 , 10 HEPES, 0.2 fura-2 (F1200, Invitrogen, OR, USA) adjusted to pH 7.2 with KOH, re- sulting in ∼ 300 mOsm.
Data analysis
Steady-state, tail current activation data of the calcium currents were fit using a first- order and second-order (n = 1,2) Boltzmann equation:
I I max
= 1
( 1 + e
V−Vs0.5) n
(2.1) Steady-state inactivation data were fit using a sum of two first-order Boltzmann equa- tions (Wicher and Penzlin, 1997; Heidel and Pflüger, 2006):
I i I i,max
= 1
( 1 + e
V−Vi,0.5
si
)
, i = 1, 2 (2.2)
I max is the maximal current, V is the voltage of the test pulse, I is the current at volt- age V, s is the slope factor and V 0.5 is the voltage at which half maximal activation occurs. To describe the time course of calcium current inactivation kinetics, a sum of exponential functions with up to two time constants (i = 1,2) was used:
I i = A i ⋅ e
−t
τi