ORIGINAL! ARBEITEN
Joint Space Gap of Leptin-Def. ob/ob Mice in Response to Loading
GelenkspaLtweite Leptin-def. Mäuse unter biomechanischer Belastung
Das Hormon Leptin reguliert die Reifung und Entwicklung des Kno- chens. Unbekannt ist der Einfluß auf die Gelenke. Ziel der Studie war es, ohne die hormonelle Wirkung von Leptin die Auswirkung des Körpergewichtes auf den Gelenkspalt von Hüft- und Kniegelenk während des Wachstums zu untersuchen. Material und Methode:
Je 20 C57BL/6J-Lepob (ob/ob) weibliche leptindefiziente Mäuse wurden in eine Gruppe mit freier Futtermenge (Gruppe A) und ei- ne Gruppe mit einer kontrollierter Futtermenge (Guppe B) einge- teilt. Für die Analyse wurde ein Micro-CT (SkyScan 1072) verwen- det. Ergebnisse: Gruppe Α zeigte im Verlauf ab der 6. Lebenswoche ein signifikant höheres Körpergewicht als Gruppe B. Nach 20 Wo- chen betrug das Körpergewicht etwa das Doppelte. Statistisch sig- nifikante Unterschiede zeigten sich zwischen beiden Gruppen im Körpergewicht (A>B) und der Knochendichte (B>A); im Micro-Ct war die Anzahl der Trabekel (Tb.N.) nur im proximalen Femur der Gruppe Β erhöht. Einen signifikant weiteren Gelenkspalt des Hüft- gelenkes zeigte sich in coronarer, sagittaler und transversaler Ebe- ne der Gruppe Α und im Kniegelenk in der coronaren Ebene, im transversalen Querdurchmesser und in der subchondralen Slerose.
Signifikante Korrelationen konnten zwischen der Knochendichte und dem Querdurchmesser des Tibiaplateaus, zwischen der Anzahl der Trabekel des Hüft- und Kniegelenkes, dem Körpergewicht und zwischen der Anzahl der Trabekel des proximalen Femurs und dem Durchmesser des Hüftkopfes in coronarer, sagittaler und transver- saler Ebene gefunden werden. Zusammenfassung: Bei Leptindefi- zienz nimmt die Knochendichte bei zunehmendem Körpergewicht ab. Eine signifikante Änderung der Gelenkspaltweite lässt sich je- doch in beiden Gruppen im Micro-CT nicht nachweisen.
Autoren: Hansjoerg Heep1, Alexander Weg- ner1, Sebastian Hof- meister1, Christian We- demeyer1
Schlagworte: Leptin, Gelenkspalt, Mikro-CT, bomechanische Belas- tung
Keywords:leptin, joint space, microCT, biome- chanical loading Zitierweise dieses Bei- trages: BlOmaterialien 2010; 11 (November) S. 31-36
Introduction
It is a known fact that body fat regulates bone metabolism by means of hormonal factors, and furthermore, that the effects of muscle and loading are s i g n a l i n g factors in m e c h a n o t r a n s - duction [12, 40]. Leptin, a peptide h o r m o n e produced predo- minantly by white fat cells, is one of these hormonal factors [1, 13, 14, 18, 30, 42], Leptin inhibits appetite; consequently, lep- tin deficiency induces obesity. With regard to bone metabolism it is not clear w h e t h e r leptin is a stimulator or an inhibitor of bone growth. Some study authors noted a positive relationship between serum leptin levels and bone mineral density [16, 28],
'Department of Orthopaedics, University of Duisburg-Essen, Pattbergstr. 1-3, 45329 Essen
whereas others observed a negative or no relationship [4, 33, 24, 29], which further c o n f o u n d s the interpretation of the ef- fect of leptin on bone mass. Simha et al. concluded that the ro- le played by leptin in b o n e metabolism in h u m a n s m a y de- pend on the stage of life [35]. This might explain its positive ef- fect on b o n e f o r m a t i o n in the early stages of d e v e l o p m e n t . Leptin is also k n o w n to increase both proliferation and diffe- rentiation of the c h o n d r o c y t e population of skeletal growth centers in organ cultures [23, 26], All these findings strongly support the theory that leptin could stimulate b o n e growth in the early stages of life.
In a few recent reports the animal model was a useful surrogate to investigate the mechanism of leptin. Mice with deficiency of leptin (obese; ob/ob) or its receptor (diabetic; db/db) are obe-
2 ] B l O m a t e r i a l i e n 11 (November), 2010
ORIGINAL
"ARBEITEN
Hansjoerg Heep: Joint Space Gap of Leptin-Def. ob/ob Mice in Response to Loadingse [1]. Both leptin and its receptors were found in murine fe- tal cartilage and b o n e template, as well as in the growth pla- te [21]. Takeda et al. and Karsenty described t h e l e p t i n - d e - p e n d e n t central control of b o n e remodeling via the s y m p a - thetic nervous system [18, 19, 36, 37]. The sterility of ob/ob mice should increase bone resorption and indeed, osteoclast numbers and the parameters of bone resorption did increase in ob/ob mice. Nevertheless, leptin-deficient mice h a v e a higher bone mass t h a n wild-type mice and completely correct their high bone mass by intracerebroventricular infusion of leptin at a rate that does not result in any detectable leak of leptin in ge- neral circulation [10].
In general, mechanical loading stress on bones causes tissue de- formation within the bone and stimulates the b o n e to adapt and remodel, ultimately improving resistance to osteoporosis.
While previous studies have s h o w n that bone parameters im- proved with weight-bearing exercise in normal subjects, we were interested in the co-influence of biomechanical loading on body weight and bone metabolism in subjects with leptin deficiency. There is so far no agreement regarding the positi- ve effect of leptin in the early stages of life.
The ability of three-dimensional micro-computed tomography to detect changes in a rat model was evaluated for b o n e mass [2, 9, 22, 27, 32, 34, 38]. It is a method to image, q u a n t i f y and study trabecular b o n e and the bone remodeling [32], A f t e r induction of osteoarthritis by drugs in the murine knee, Botter et al. showed that significant changes in subchondral bo- ne architecture a n d could be detected and q u a n t i f i e d in 3D u s i n g micro-CT a n a l y s i s [5]. Ankle micro-CT a n a l y s e s de- monstrated b o n e destruction in a rat model [20].
The aim of this study was to investigate the differential effects of weight-bearing on j o i n t space in mice without the stimula- tion of leptin.
Materials and Methods
Animals
C57BL/6J-Lepo b (ob/ob) female mice were received f r o m the J a n v i e r Laboratory (Le Genest St Isle, France) at the age of fi- ve weeks. The animal experiment was approved by the local authorities according to the official guidelines.
The effects of dietaiy restriction in ob/ob and wild-type mice h a s been described in several studies [7, 15, 25]. The animals were housed one per cage with access to water ad libitum and a s t a n d a r d rodent diet (8640 Harlan Teklad 2 2 / 5 [ l ] ; Harlan Teklad, Madison, WI, USA) c o n t a i n i n g 1.13°/o c a l c i u m a n d 0.94% phosphorus. The animals were maintained u n d e r con- ditions of a t w e l v e - h o u r light and dark cycle w i t h the light switched on at 6.00 a.m.. Food intake and body weight were re- corded daily. There were two experimental groups divided ac- cording to the provision of food. Group A included 20 ob/ob mice with access to food ad libitum, the other 20 ob/ob mice in Group Β received a limited amount of food (6 gr. each day).
All the animals were euthanized by mechanical procedure at the age of twenty weeks.
Micro-CT
A high resolution micro-CT (SkyScan 1072, Aartselaar, Bel- gium) was used to perform qualitative and quantitative analysis of the hip and knee. All samples were scanned by a c o m m e r - cially available m i c r o c o m p u t e d t o m o g r a p h i c s c a n n e r at the Department of Cardiology of the West German Heart Centre at the University of Duisburg-Essen.
Technical specifications of the micro-CT
The micro-CT system is based on a scanner developed for high-
resolution imaging [up to 4 p m cubic voxels] of sample sizes up to 2 cm'. The scanner uses a field x - r a y tube with an 8 pm spot-seize and expected lifetime of > 10,000 hours. The tube is operated at between 20 and 100 kiloelectron volts and a cur- rent of up to 100 micro amperes. For scanning, the samples are placed between the micro-focus X-ray source and a Char- ge-Coupled-Device (CCD) detector (matrix size: 1024 χ 1024 pi- xels, field of view: 25 mm2). In order to prevent samples from moving during scanning, the limbs are placed in a tightly fit- ting rigid plastic tube. In the scanner's chamber the specimens are placed on a stack of computer-controlled precision stages which are rotated in equiangular steps of 0.9° around a n a n - gle of 180°. When the object is placed between the X-ray sour- ce and the CCD-detector, the c o n e - b e a m of X-rays passes the object a n d t h e n hits the CCD-detector p r o d u c i n g 2 D - X - r a y images. A personal computer is used to control the s c a n n e r and store the CCD image data recorded at each angle of view during the s c a n n i n g process.
Tomographic image reconstruction
The X - r a y projection data of the s c a n n e d samples are then submitted to the resident reconstruction program (Cone-beam Reconstruction, Skyscan, Aartselaar, Belgium), which is based on a Feldkamp filtered back projection algorithm [43] resulting in a volume image of up to 10,243 voxels, each cubic voxel being 4 - 1 9 p m on one side, depending on how much of the specimen has to be imaged.
Cancellous bone assessment by micro-CT
The regions of interest (ROIs) from the proximal femur and ti- bia were selected for structural analysis of the cancellous bo- ne. A cubic region of 0 . 5 x 0 . 5 x 0 . 5 m m 3 in the metaphysis of the tibia was adjacent to (1mm away from) the growth plate and femoral head. Trabecular thickness (Tb. Th) and trabecu- lar number (Tb.N) were based directly on the 3-D data using medial axis transformation and distance transformation.
Joint space measurement by micro-CT
The center of the head of the hip was detected by "data viewer".
The m e a s u r e m e n t s were m a d e in micrometers. The smallest j o i n t space was measured from the longitudinal, sagittal and transversal slices of the center. The j o i n t space of the knee was measured from the transverse and sagittal slices between the medial condyle and the tibial plateau.
Statistical analysis
The data were analyzed and assessed using SPSS software (ver- sion 15.0; SPSS Institute Inc, Chicago, USA). Descriptive sta- tistics of all variables were determined including the mean and standard deviation of each group. The difference of all p a r a - meters between the two groups was assessed using the Stu- dent's t-Test because all parameters were normally distribu- ted [which was tested u s i n g the Kolmogorov Smirnov test].
Pearson's correlation coefficient was used to assess the rela- tionship between all the trabecular b o n e parameters of the fe- mur and tibia. A v a l u e of ρ <0.05 was considered to be statis- tically significant.
Results
No death or health deterioration occurred during this study.
The body weight at each time point in the two groups is shown in Figure 1.
Animals with an ad libitum diet (Group A) were found to in- crease body weight significantly at the age of six weeks in com- i parison with the lean mice (Group B). From this time point on,
Hansjoerg Heep: Joint Space Gap of Leptin-Def. ob/ob Mice in Response to Loading
ORIGINAL· ARBEITEN
ο
Ξ 40 •
- GROUP A
- GROUP Β
9 11 13 15 17 A G E ( W E E K )
2,80
2
c Ü ä e CO
2,60
2,40
K-Qu»dra! = 0.1*
2900 3000 3100 Crossdiametcr of Tibial Plateau
Fig. 1: The curves show the change in body weight in the two groups. The animals in Group A had an ad libitum diet and reached a body weight of over 50 grams af- ter 20 weeks, the animals in Group Β with a controlled diet reached a body weight of over 35 grams after 20 weeks. Inter-group difference was already significant at the age of six weeks (p<0.05).
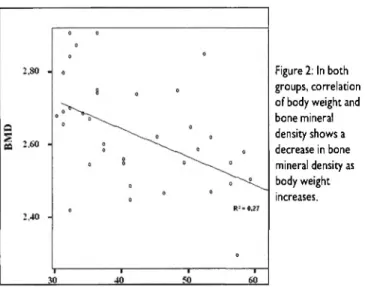
Figure 2: In both groups, correlation of body weight and bone mineral density shows a decrease in bone mineral density as body weight increases.
the difference increased c o n s t a n t l y . A t t h e age of t w e n t y w e e k s t h e o b e s e mice w e r e a l m o s t t w i c e as h e a v y as t h e l e a n mice.
In b o t h G r o u p A a n d G r o u p Β t h e m i c e w i t h a h i g h b o d y w e i g h t h a d a l o w e r b o n e m i n e r a l d e n s i t y (BMD) (Figure 2} a n d a lower t r a b e c u l a r n u m b e r (Tb.N) in t h e p r o x i m a l f e m u r a n d ti- b i a (Table 1, F i g u r e 3).
The a n i m a l s w i t h a n ad l i b i t u m diet (Group A) w e r e f o u n d t o h a v e a s i g n i f i c a n t l y i n c r e a s e d j o i n t s p a c e in t h e h i p in t h e c o -
Table 1: Statistically significant differences between the ad libitum diet Group A and controlled diet Group Β for bone mineral density (BMD), body weight and tra- becular number (TbN) in the ROI of the proximal femur (p < 0.05) and the statis- tical trend of the trabecular number (TbN) in the ROI of the proximal tibia (p = 0.058).
Figure 3: The correlation between bone mineral density and the cross-diameter of the tibial plateau shows that in both groups there was a significant decrease in bone mineral density as the cross-diameter of the tibial plateau increased (p < 0.01).
r o n a i y , s a g i t t a l a n d t r a n s v e r s e p l a n e s in c o m p a r i s o n with t h e l e a n m i c e ( G r o u p B) (Table 2).
The increase in t h e j o i n t s p a c e in t h e k n e e in t h e c o r o n a r y p l a - ne, f o r t h e t r a n s v e r s e d i a m e t e r of t h e tibial p l a t e a u a n d f o r t h e s u b c h o n d r a l sclerosis in t h e ad l i b i t u m diet G r o u p A w a s also s t a t i s t i c a l l y s i g n i f i c a n t .
Only o n e s i g n i f i c a n t c o r r e l a t i o n w a s f o u n d b e t w e e n b o n e m i - neral d e n s i t y ( m e a s u r e d b y micro-CT) a n d t h e c r o s s - d i a m e t e r of t h e tibial p l a t e a u (Figure 3).
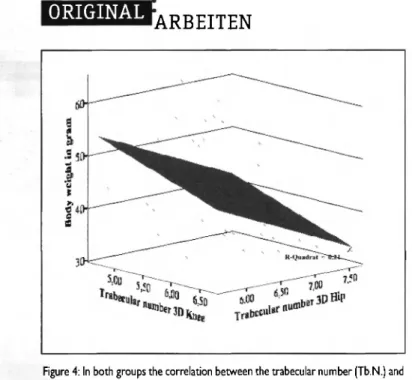
C o r r e l a t i o n w a s f o u n d b e t w e e n t h e t r a b e c u l a r n u m b e r (Tb.N.) o f t h e k n e e a n d f e m u r ( m e a s u r e d b y m i c r o - C T ) a n d b o d y w e i g h t (Fig. 4).
C o r r e l a t i o n w a s a l s o f o u n d b e t w e e n t h e t r a b e c u l a r n u m b e r (Tb.N.) of t h e f e m u r ( m e a s u r e d b y micro-CT) a n d t h e d i a m e t e r of t h e f e m o r a l h e a d in t h e s a g i t t a l , c o r o n a r y a n d t r a n s v e r s e p l a n e s (Fig. 5).
Discussion
The a i m of t h e present s t u d y w a s to e x a m i n e c h a n g e s in t h e j o - i n t s p a c e i n d u c e d b y a r e s p o n s e t o b i o m e c h a n i c a l l o a d i n g in l e p t i n - d e f i c i e n t m i c e . C o r r e l a t i o n of b o d y w e i g h t a n d b o n e m i n e r a l d e n s i t y s h o w s t h a t in b o t h g r o u p s b o n e m i n e r a l d e n - sity d e c r e a s e d as b o d y w e i g h t increased. H o w e v e r , this did n o t i n d u c e a n y s i g n i f i c a n t c h a n g e s in t h e j o i n t s p a c e in e i t h e r o f t h e g r o u p s . O n l y o n e s i g n i f i c a n t c o r r e l a t i o n w a s f o u n d b e t - w e e n b o n e m i n e r a l d e n s i t y a n d t h e c r o s s - d i a m e t e r of t h e t i b i - al p l a t e a u .
A g r e a t d e a l of r e s e a r c h h a s c o n f i r m e d t h a t g r e a t e r b i o m e - chanical l o a d i n g d u e to high b o d y w e i g h t c o n t r i b u t e s to t h e in- creased b o n e d i m e n s i o n s o b s e r v e d n o t o n l y in o u r a n i m a l m o -
Group BMD
mean SD Weight (grams)
mean SD T b N femur
mean SD T b N tibia
mean SD
Group A
(ad libitum diet) 2.57 0.147 52.53 6.36 6.42 0.45 5.63 0.34
Group Β
(controlled diet) 2.68 0.138 35.65 3.50 6.76 0.55 5.90 0.52
Ρ value <0.05 < 0.001 0.038 0.058
BlOmaterialien 11 (November), 2010
ORIGINAL
ARBEITEN
Hansjoerg Heep: Joint Space Gap of Leptin-Def. ob/ob Mice in Response to LoadingFigure 4: In both groups the correlation between the trabecular number (Tb.N.) and body weight shows a significant decrease in the trabecular number as body weight increases (p < 0.01).
J 700
1400 1450 1500 1550 Diameter of F e m o r a l Head SAG
1450 1475 1500 1525 1550 Diameter of Femoral Head COR
1400 1450 1500 1550 Diameter of F e m o r a l Head TRANS
del but also in obese h u m a n s [11]. At t h e s a m e time, it also contributes to an increased b o n e mass as a c o - i n f l u e n c e . In- creased loading of l o n g b o n e s p r o d u c e s t h e greatest m e c h a - nical stress on the subperiosteal s u r f a c e and stimulates b o n e f o r m a t i o n by subperiosteal e x p a n s i o n [41], A study of b o n e b i o m e c h a n i c s in adult rats with d i e t - i n d u c e d obesity s h o w e d s i g n i f i c a n t l y g r e a t e r b o n e strength in t h e obese rats t h a n in the controls [6], I w a m o t o et al. suggest that cancellous b o n e a d a p t a t i o n to treadmill exercise m a y be influenced by f a c t o r s such as mechanical l o a d i n g on t h e m e t a p h y s e a l b o n e a r c h i - tecture in the y o u n g g r o w i n g rat [17]. In a rat model of i m - mobilisation osteoporosis Laib at al. measured the p r o x i m a l part of the tibiae of t h e hind limbs in u n l o a d e d and control rats using 3D micro-CT. They show that most b o n e loss is c a u - sed by the t h i n n i n g of the trabeculae, a n d to a lesser e x t e n t by a decrease in their n u m b e r [5]. In the case of leptin-deficient mice o u r study shows in both g r o u p s a significant decrease in the t r a b e c u l a r n u m b e r as t h e d i a m e t e r s of t h e femoral h e a d increased.
With micro-CT it is possible to m o n i t o r p r o m i n e n t b o n y alte- rations such as o s t e o p h y t e f o r m a t i o n , t r a b e c u l a r remodeling, s u b c h o n d r a l b o n e plate thickening, a n d s u b c h o n d r a l sclerosis [39], Furthermore, micro-CT a r t h r o g r a p h y is a novel t e c h n i - que for indirect visualization of the distinct features and struc- tural analysis of t h e rat knee j o i n t in s m a l l - a n i m a l research [31]. Botter et al. and Chappard at al. showed significant c h a n - ges in s u b c h o n d r a l b o n e architecture a f t e r induction of oste- oarthritis or in advanced osteoarthritis [5, 8], Only Batiste et al.
d e m o n s t r a t e d p r o g r e s s i v e c a r t i l a g e d e g e n e r a t i o n a n d b o n e c h a n g e s using 4-T MRI and micro-CT correlated to m a c r o s c o - pic g r a d i n g [3]. However, n o n e of these a u t h o r s described t h e c h a n g e s which take place in the j o i n t space in hips and k n e e s affected by osteoarthritis.
In s u m m a r y , biomechanical loading leads to reduced b o n e mi- neral density due to a decrease in the number of trabeculae. De- creased body weight in leptin-deficient mice protects the mi- ce against b o n e loss. This finding is consistent with the p r i n - ciple of t h e light-weight construction of bone. With micro-CT is it not possible to d e m o n s t r a t e c h a n g e s in j o i n t space in res- ponse to biomechanical loading. Differences in cartilage and t h e b o n e in j o i n t spaces will be e x a m i n e d in later studies cor- related to h i s t o m o r p h o l o g y . It is not possible to conclude t h a t these results also apply to h u m a n beings.
Figure 5: The correlation between the trabecular number (Tb.N.) of the femur and the diameter of the femoral head in the sagittal, coronary and transverse planes shows in both groups a significant decrease in the trabecular number as the dia- meter of the femoral head increases (p < 0.01).
Abstract
Leptin w a s regulate b o n e d e v e l o p m e n t . However, there is so far no a g r e e m e n t c o n c e r n i n g the effect of leptin in t h e early stages of life. The aim of this study w a s to investigate t h e d i f - ferential effects of w e i g h t - b e a r i n g on j o i n t space in l e p t i n - d e - ficiency mice. Materials, Methods and Results: C57BL/6J-Lepob
(ob/ob) female mice with an a d - l i b i t u m - d i e t (Group A) w e r e f o u n d to increase b o d y weight significantly at t h e age of six weeks in c o m p a r i s o n with lean mice (Group B). At t h e age of twenty weeks the obese mice were almost twice as heavy as the lean mice. A high r e s o l u t i o n micro-CT (SkyScan 1072) w a s used to p e r f o r m q u a l i t a t i v e a n d q u a n t i t a t i v e analysis of t h e hip and knee. Significant statistical differences are shown bet- ween t h e two g r o u p s for b o d y weight and b o n e mineral d e n - sity, for the trabecular n u m b e r (Tb.N.) f o r t h e proximal femur, a increased j o i n t space in the hip in the coronary, sagittal a n d transverse planes for Group A, a increase in the j o i n t space in the knee in the c o r o n a r y plane, for t h e t r a n s v e r s e diameter of the tibial plateau and f o r the s u b c h o n d r a l sclerosis. Signifi- cant correlation was f o u n d between b o n e mineral density a n d the cross diameter of tibial plateau, between Tb.N. of k n e e / f e - Table 2: Statistically significant differences between the ad libitum diet Group A
and the controlled diet Group Β for joint space (JS) in the hip in the coronary, sa- gittal (p < 0.001) and transverse (p < 0,05) planes.
Group
JS hip sag
mean SD
JS hip cor
mean S D
JS hip trans
mean S D
Group A
(ad libitum diet) 85.99 19.44 103.56 38.14 142.85 91.28
Group Β
(controlled diet) 65.29 15.61 63.83 18.63 83.05 17.93
Ρ value < 0.001 < 0.001 <0.05
Hansjoerg Heep: Joint Space Gap of Leptin-Def. ob/ob Mice in Response to Loading
ORIGINAL· ARBEITEN
mur and body weight, between Tb.N. of femur and diameter of the femora] head in the sagittal, coronary and transverse pla- nes.
Conclusion
In both groups decreased bone mineral density as body weight increased. However, this did not induce any significant chan- ges in the joint space in either of the groups in micro-CT.
Literature
[1] Ahima RS, Flier JS: Leptin. Annu Rev Physiol 62:413-37, 2000
[2] Barou 0, Valentin D, Vico L, Tirode C, Barbier A, Alexan- dre C, Lafage-Proust MH: High-resolution three-dimensional micro-computed tomography detects bone loss and changes in trabecular architecture early: comparison with DEXA and bone histomorphometry in a rat model of disuse osteoporosis.
Invest Radiol 37:40-6, 2002
[3] Batiste DL, Kirkley A, Laverty S, Thain LM, Spouge AR, Holdsworth DW: Ex vivo characterization of articular cartila- ge and bone lesions in a rabbit ACL transection model of oste- oarthritis using MRI and micro-CT. Osteoarthritis Cartilage
12:986-96, 2004
[4] Blum M, Harris SS, Must A, Naumova EN, Phillips SM, Rand WM, Dawson-Hughes B: Leptin, body composition and bone mineral density in premenopausal women. Calcif Tissue
^ ^ m Dr. med.
^ ^ ^ ^ ^ ^ R B Hansjoerg Heep
^ ^ ^ P · " W Korrespondenzadresse:
^ H k i M u r Department of Orthopaedics, University of Duisburg-Essen Pattbergstr. 1-3
Essen
hansjoerg.heep@uni-due.de I f ^ ^ V ^ ^ · Phone.: 0201 /4089-2147
Fax: 0201/4089-2722 Akademischer Lebenslauf
Oberarzt, Orthopädische Klinik der Universität Duisburg- Essen im Evangel. Krankenhaus Essen-Werden
1986-1988 Studium der Chemie Universität Heidel- berg
1988-1994 Studium der Humanmedizin Heidelberg und München (LMU, Sommersemester
1988)
1997 Dissertation „Quantifizierung der RES- Clearance nach Reperfusion bei Leber- transplantation unter klinischen Bedin- gungen"
2001 Facharzt Chirurgie
2003 Schwerpunkt Unfallchirurgie
2006 Facharzt Orthopädie und Unfallchirurgie 2007 Zusatzbezeichnung Spezielle Orthopädi-
sche Chirurgie, Physikalische Therapie 2003 Oberarzt Unfallchir., Universität Düssel-
dorf
2006 Orthopädie Universität Duisburg-Essen
Int 73:27-32, 2003
[5] Botter SM, van Osch GJ, Waarsing JH, Day JS, Verhaar JA, Pols HA, van Leeuwen JP, Weinans H: Quantification of sub- chondral bone changes in a murine osteoarthritis model using micro-CT. Biorheology 43:379-88, 2006
[6] Brahmabhatt V, Rho J, Bernardis L, Gillespie R, Ziv I: The effects of dietaiy-induced obesity on the biomechanical pro- perties of femora in male rats. Int J Obes Relat Metab Disord 22:813-8, 1998
[7] Brochmann EJ, Duarte ME, Zaidi HA, Murray SS: Effects of dietary restriction on total body, femoral, and vertebral bone in SENCAR, C57BL/6, and DBA/2 mice. Metabolism 52:1265- 73, 2003
[8] Chappard C, Peyrin F, Bonnassie A, Lemineur G, Brunet-Im- bault B, Lespessailles E, Benhamou CL: Subchondral bone mi- cro-architectural alterations in osteoarthritis: a synchrotron micro-computed tomography study. Osteoarthritis Cartilage
14:215-23, 2006
[9] Ding M, Odgaard A, Hvid I: Changes in the three-dimen- sional microstructure of human tibial cancellous bone in ear- ly osteoarthritis. J Bone Joint Surg Br 85:906-12, 2003 [10] Ducy P, Amling M, Takeda S, Priemel M, Schilling AF, Beil FT, Shen J, Vinson C, Rueger JM, Karsenty G: Leptin in- hibits bone formation through a hypothalamic relay: a cen- tral control of bone mass. Cell 100:197-207, 2000
[11] Felson DT, Zhang Y, Hannan MT, Anderson JJ: Effects of weight and body mass index on bone mineral density in men and women: the Framingham study. J Bone Miner Res 8:567- 73, 1993
[12] Gross TS, Srinivasan S, Liu CC, Clemens TL, Bain SD: No- ninvasive loading of the murine tibia: an in vivo model for the study of mechanotransduction. J Bone Miner Res 17:493- 501, 2002
[13] Hamrick MW, Ding KH, Pennington C, Chao YJ, Wu YD, Howard B, Immel D, Borlongan C, McNeil PL, Bollag WB, Curl WW, Yu J, Isales CM: Age-related loss of muscle mass and bone strength in mice is associated with a decline in physical activity and serum leptin. Bone 39:845-53, 2006
[14] Hamrick MW, Ferrari SL: Leptin and the sympathetic con- nection of fat to bone. Osteoporos Int, 2007
[15] Hsieh EA, Chai CM, Hellerstein MK: Effects of caloric res- triction on cell proliferation in several tissues in mice: role of intermittent feeding. Am J Physiol Endocrinol Metab 288:E965- 72, 2005
[16] Iwamoto J, Takeda T, Ichimura S: Effect of exercise on ti- bial and lumbar vertebral bone mass in mature osteopenic rats:
bone histomorphometiy study. J Orthop Sei 3:257-63, 1998 [17] Iwamoto J, Yeh JK, Aloia JF: Differential effect of tread- mill exercise on three cancellous bone sites in the young gro- wing rat. Bone 24:163-9, 1999
[18] Karsenty G: Convergence between bone and energy ho- meostases: leptin regulation of bone mass. Cell Metab 4:341- 8, 2006
[19] Karsenty G: Leptin controls bone formation through a hy- pothalamic relay. Recent Prog Horm Res 56:401-15, 2001 [20] Kliwinski C, Kukral D, Postelnek J, Krishnan B, Killar L, Le- win A, Nadler S, Townsend R: Prophylactic administration of abatacept prevents disease and bone destruction in a rat mo- del of collagen-induced arthritis. J Autoimmun 25:165-71, 2005
[21] Kume K, Satomura K, Nishisho S, Kitaoka E, Yamanouchi K, Tobiume S, Nagayama M: Potential role of leptin in end- ochondral ossification. J Histochem Cytochem 50:159-69, 2002 [22] Laib A, Barou 0, Vico L, Lafage-Proust MH, Alexandre C, Rugsegger P: 3D micro-computed tomography of trabecular and cortical bone architecture with application to a rat model
35
BlOmaterialien 11 (November), 2010ORIGINAL
" a r b e i t e n
Hansjoerg Heep: Joint Space Gap of Leptin-Def. ob/ob Mice in Response to Loadingof immobilisation osteoporosis. Med Biol Eng Comput 38:326- 32, 2000
[23] Maor G, Rochwerger M, Segev Y, Phillip M: Leptin acts as a growth factor on the chondrocytes of skeletal growth centers.
J Bone Miner Res 17:1034-43, 2002
[24] Martini G, Valenti R, Giovani S, Franci B, Campagna S, Nuti R: Influence of insulin-like growth factor-1 and leptin on b o n e mass in healthy postmenopausal w o m e n . Bone 28:113-7, 2001
[25] Murase T, Mizuno T, Omachi T, Onizawa K, Komine Y, Kondo H, Hase Τ, Tokimitsu I: Dietary diacylglycerol suppres- ses high fat and high sucrose diet-induced body fat accumu- lation in C57BL/6J mice. J Lipid Res 42:372-8, 2001 [26] Nakajima R, Inada H, Koike T, Yamano T: Effects of lep- tin to cultured growth plate chondrocytes. Horm Res 60:91-8, 2003
[27] Nuzzo S, Peyrin F, Cloetens P, Baruchel J, Boivin G: Quan- tification of the degree of mineralization of bone in three di- mensions using synchrotron radiation microtomography. Med Phys 29:2672-81, 2002
[28] Odabasi E, Ozata M, Turan M, Bingol N, Yonem A, Cakir B, Kutlu M, Özdemir IC: Plasma leptin concentrations in post- menopausal women with osteoporosis. Eur J Endocrinol
142:170-3, 2000
[29] Rauch F, Blum WF, Klein K, Allolio B, Schönau Ε: Does leptin have an effect on bone in adult women? Calcif Tissue Int 63:453-5, 1998
[30] Reid IR: Relationships between fat and bone. Osteoporos Int, 2007
[31] Roemer FW, Mohr A, Lynch JA, Meta MD, Guermazi A, Genant HK: Micro-CT arthrography: a pilot study for the ex vi- vo visualization of the rat knee joint. AJR Am J Roentgenol
184:1215-9, 2005
[32] Ruegsegger P, Koller Β, Muller R: A microtomographic system for the nondestructive evaluation of bone architecture.
Calcif Tissue Int 58:24-9, 1996
[33] Sato M, Takeda N, Sarui H, Takami R, Takami K, Hayas- hi M, Sasaki A, Kawachi S, Yoshino K, Yasuda K: Association between serum leptin concentrations and bone mineral densi- ty, and biochemical markers of bone turnover in adult men. J Clin Endocrinol Metab 86:5273-6, 2001
[34] Schmidt C, Priemel M, Kohler T, Weusten A, Muller R, Amling M, Eckstein F: Precision and accuracy of peripheral quantitative computed tomography [pQCT] in the mouse ske- leton compared with histology and microcomputed tomogra- phy [microCT], J Bone Miner Res 18:1486-96, 2003
[35] Simha V, Zerwekh JE, Sakhaee K, Garg A: Effect of sub- cutaneous leptin replacement therapy on bone metabolism in patients with generalized lipodystrophy. J Clin Endocrinol Metab 87:4942-5, 2002
[36] Takeda S: Central control of bone remodeling. Biochem Biophys Res Commun 328:697-9, 2005
[37] Takeda S, Elefteriou F, Levasseur R, Liu X, Zhao L, Parker KL, Armstrong D, Ducy P, Karsenty G: Leptin regulates bone formation via the sympathetic nervous system. Cell 111:305-
17, 2002
[38] Waarsing JH, Day JS, van der Linden JC, Ederveen AG, Spanjers C, De Clerck N, Sasov A, Verhaar JA, Weinans H: De- tecting and tracking local changes in the tibiae of individual rats: a novel method to analyse longitudinal in vivo micro- CT data. Bone 34:163-9, 2004
[39] 39. Wachsmuth L, Engelke K: High-resolution imaging of osteoarthritis using microcomputed tomography. Methods Mol Med 101:231-48, 2004
[40] Warner SE, Sanford DA, Becker BA, Bain SD, Srinivasan S, Gross TS: Botox induced muscle paralysis rapidly degrades
bone. Bone 38:257-64, 2006
[41] Zhang P, Yokota H: Effects of surgical holes in mouse ti- biae on bone formation induced by knee loading. Bone 40:1320-8, 2007
[42] Zhang Y, Proenca R, Maffei M, Barone Μ, Leopold L, Friedman JM: Positional cloning of the mouse obese gene and its human homologue. Nature 372:425-32, 1994
[43] Zhao S, Yu H, Wang G: A unified framework for exact cone-beam reconstruction formulas. Med Phys 32:1712-21, 2005