Compensation and Performance - Empirical Studies on Wages, Bonus Payments, and
Intra-Firm Trainings
Inauguraldissertation zur
Erlangung des Doktorgrades der
Wirtschafts- und Sozialwissenschaftlichen Fakultät der
Universität zu Köln
2011
vorgelegt von
Diplom-Kaufmann Patrick Kampkötter
aus
Bielefeld
Referent: Professor Dr. Dirk Sliwka
Korreferent: Professor Dr. Bernd Irlenbusch
Tag der Promotion: 04.02.2011
Für meine Eltern
Danksagung
Die vorliegende Arbeit wäre nicht ohne den Beitrag ganz unterschiedlicher Menschen zustande gekommen. Mein erster und wichtigster Dank geht an meinen Doktorvater Dirk Sliwka, den ich nicht nur fachlich, sondern auch persönlich sehr schätze. Sein außergewöhnliches Verständnis von fachlicher Betreuung gepaart mit Neugier und ehrlichem Interesse habe ich als sehr positiv empfunden. Für die hilfreiche Unterstützung sowie die Übernahme des Korreferates danke ich Bernd Irlenbusch sehr herzlich.
Nicht minder wichtig war für mich die Arbeitsatmosphäre am Lehrstuhl.
Ich möchte ganz besonders meinen aktuellen und ehemaligen Kolleginnen
und Kollegen Johannes Berger, Torsten Biemann, Kathrin Breuer, Anasta-
sia Danilov, René Fahr, Petra Gerlach, Christine Harbring, Claus Herbertz,
Kathrin Manthei, Tom McKenzie, Alwine Mohnen, Petra Nieken und Nan-
nan Zhou für die sehr gute und kollegiale Zusammenarbeit danken. Sie sind
für mich in der zurückliegenden Zeit weit mehr als Kolleginnen und Kol-
legen, nämlich Freunde geworden. Weiterhin möchte ich mich bei unserer
Sekretärin Beate Ommer sowie unseren wissenschaftlichen und studentischen
Hilfskräften Tim Bartel, Isabella Cetnarowski, Paul Cibu-Deaconu, Alexan-
der Creson, Stefan Degen, Behnud Djawadi, Aurel Grau, Andrea Hammer-
mann, Thorsten Hormesch, Elmar Janssen, Susi Kusche, Katharina Laske,
Michael Lüttjohann, Christiane Schäfer, Verena Scherer, Ursula Schuh, Kai
Seifert, Julia Sohn und Timo Vogelsang für ihre tatkräftige Unterstützung
und Hilfsbereitschaft bedanken.
Auch den (ehemaligen) Mitarbeiterinnen und Mitarbeitern von Towers Watson, Martin Emmerich, Paul Fabiszak, Jens-Christian Hilse, Björn Hin- derlich, Michael Kramarsch, Marc Muntermann und insbesondere Andreas Enneking und Katharina Hessenauer danke ich für zahlreiche Diskussionen und die hervorragende Zusammenarbeit.
Ein ganz besonderer Dank geht an meine Eltern und meine Schwester Na- dine Wasser für ihre unabdingbare Unterstützung in all den zurückliegenden Jahren. Durch meinen Vater, mit dem ich schon früh unzählige Gespräche über ökonomische Themen geführt habe, prägte sich mein Interesse für die Wirtschaftswissenschaften. Ein ganz besonderer Dank gilt auch meiner Mut- ter für alles, was sie für mich getan hat. Es macht mich unendlich traurig, dass sie die Fertigstellung dieser Arbeit nicht mehr miterleben darf. Ihr ist diese Arbeit daher ganz besonders gewidmet. Meine Schwester hat mich schon all die Jahre, besonders auch durch das ganze Studium hindurch, be- gleitet.
Auch meinen "Augustiner" und "Kölner" Freundinnen und Freuden bin ich außerordentlich dankbar für die vielen schönen Stunden, in denen ich mich immer wieder gut von der Arbeit erholen konnte.
Mein letzter und herzlichster Dank geht an Annalena Scholz, die mich
durch alle Höhen und Tiefen meiner Promotionszeit begleitet hat. Ich danke
ihr für die grenzenlose Unterstützung und vor allem die Geduld mit mir,
besonders in Zeiten, die von Stata-Fehlermeldungen, Datenverlusten, und
nächtelangem Arbeiten an den Datensätzen geprägt waren (you know what I
mean...). Sie hat dadurch mindestens genau so viel in diese Arbeit investiert
wie ich selbst.
Contents
1 Introduction 1
2 The Impact of the Financial Crisis on Non-Executive Com-
pensation 10
2.1 Introduction . . . 10
2.2 Background and Related Literature . . . 14
2.3 The Data . . . 18
2.3.1 Data Set . . . 18
2.3.2 Empirical Strategy . . . 20
2.4 Descriptive Statistics . . . 22
2.4.1 Base Salary . . . 24
2.4.2 Individual vs. Average Wage Increases . . . 25
2.4.3 Bonus Eligibility and Non-Zero Bonus Payments . . . . 27
2.4.4 Bonus Payments . . . 30
2.4.5 Bonus to Base Ratio . . . 38
2.4.6 Pay Dispersion . . . 40
2.5 Determinants of Base Salary and Bonus Payments . . . 41
2.5.1 Base Salary . . . 41
2.5.2 Bonus Eligibility and Non-Zero Bonus Payments . . . . 43
2.5.3 Short-term Bonus Payments . . . 46
2.5.4 Di¤erences in Explanatory Power . . . 52
2.6 Conclusion . . . 56
2.7 Appendix to Chapter 2 . . . 58
3 Wage Premia for Newly Hired Employees 65
3.1 Introduction . . . 65
3.2 A Simple Model . . . 68
3.2.1 Description of the Model . . . 68
3.2.2 Equilibrium Analysis . . . 69
3.3 The Data . . . 72
3.4 Results . . . 73
3.4.1 The Aggregate E¤ect . . . 73
3.4.2 Hierarchical Levels . . . 75
3.4.3 Functional Areas . . . 78
3.4.4 Managers and Functional Experts . . . 80
3.4.5 Measuring the Importance of Firm-Speci c Human Cap- ital . . . 82
3.4.6 Di¤erences in Ability? . . . 84
3.5 Conclusion . . . 86
3.6 Appendix to Chapter 3 . . . 88
4 The E¤ects of Intra-Firm Training on Earnings and Job Per- formance 93 4.1 Introduction . . . 93
4.2 Background and Related Literature . . . 95
4.3 The Data . . . 99
4.3.1 Data Set . . . 99
4.3.2 Empirical Strategy . . . 100
4.4 Descriptive Statistics . . . 102
4.4.1 Training Participation . . . 102
4.4.2 Training Hours and Numbers of Training . . . 104
4.4.3 Training Behavior of Employees in New Job Positions . 105 4.5 Determinants of Training Participation . . . 106
4.5.1 Overall Training Participation . . . 106
4.5.2 Training Categories . . . 111
4.6 Performance E¤ects of Training Participation . . . 114
4.6.1 Number of Trainings and Training Diversity . . . 117
4.6.2 Absenteeism, Overtime Work and Turnover . . . 121
4.7 Conclusion . . . 123
4.8 Appendix to Chapter 4 . . . 126
5 The E¤ects of Di¤erentiation on Performance 129 5.1 Introduction . . . 129
5.2 Related Literature . . . 132
5.3 The Data . . . 136
5.4 Performance E¤ects of Di¤erentiation . . . 138
5.4.1 How much Di¤erentiation? . . . 138
5.4.2 The Aggregate E¤ect . . . 141
5.5 Levels, Functional Areas, and Career Ladders . . . 144
5.5.1 Hierarchical Levels . . . 144
5.5.2 Functional Areas . . . 147
5.5.3 Managers or Professionals . . . 151
5.6 Robustness of Results and the E¤ects of Di¤erentiation on Firm Performance . . . 152
5.7 Conclusion . . . 155
5.8 Appendix to Chapter 5 . . . 157
Bibliography 157
List of Tables
2.1 Overview of pay variables (mean values) . . . 23
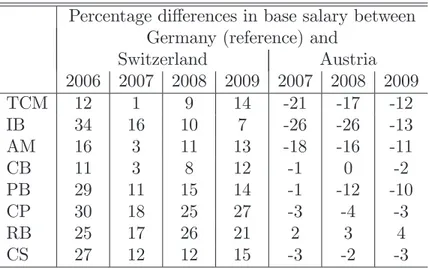
2.2 Percentage di¤erences in base salary between Germany (refer- ence) and other countries . . . 26
2.3 Average short-term bonus eligibility over level (Germany) . . . 28
2.4 Average short-term bonus eligibility over module (Germany) . 29 2.5 Average proportion of eligible employees receiving positive (non-zero) bonus payments over level (Germany) . . . 30
2.6 Average proportion of eligible employees receiving positive (non-zero) bonus payments over level (other countries) . . . . 30
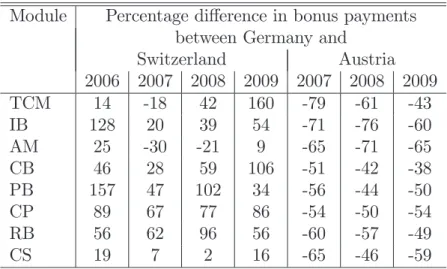
2.7 Percentage di¤erence in bonus payments between Germany (reference) and other countries . . . 37
2.8 Average bonus to base ratio over level (Germany) . . . 39
2.9 Average bonus to base ratio over module (Germany) . . . 39
2.10 Ratio of highest-level pay to entry-level pay . . . 41
2.11 Regression results for determinants of base salary (Germany) . 44 2.12 Regression results for determinants of base salary (Switzerland and Austria) . . . 45
2.13 Probit regression results for determinants of bonus eligibility and positive bonus payments (Germany) . . . 47
2.14 Regression results for determinants of bonus payments (Ger- many) . . . 49
2.15 Regression results for determinants of bonus payments (Switzer- land and Austria) . . . 51
2.16 Changes in R-squared over year and country . . . 55
2.17 Distribution by hierarchical level and year (Germany) . . . 58
2.18 Distribution by hierarchical level and year (Switzerland and
Austria) . . . 58
2.19 Distribution by functional area . . . 59
2.20 Overview of pay variables (median values) . . . 59
2.21 Average bonus to base ratio over level (Switzerland and Austria) 60 2.22 Average coe¢cient of variation of bonus payments over level (Germany) . . . 60
2.23 Average coe¢cient of variation of bonus payments over level (Switzerland and Austria) . . . 60
3.1 Baseline regressions . . . 74
3.2 OLS wage regressions with tenure classes . . . 75
3.3 Interaction with hierarchical level . . . 76
3.4 Interaction with functional area . . . 79
3.5 Interaction with career ladder . . . 81
3.6 Interaction with measure for speci city of human capital . . . 84
3.7 Bonus payments in subsequent year as proxy for ability . . . . 85
3.8 Descriptive statistics (levels 3 to 6) . . . 89
3.9 Proportion of newly hired and incumbent employees and dis- tribution of age over hierarchical level (all levels) . . . 90
3.10 OLS wage regressions regarding only entry levels 1 and 2 . . . 91
3.11 OLS wage regressions excluding employees covered by a col- lective wage agreement . . . 92
4.1 Distribution of employees by employee status and year . . . . 100
4.2 Average number of classroom training hours by employee sta- tus and year . . . 106
4.3 Training statistics by type of job change . . . 106
4.4 Probit regression results for determinants of classroom train- ing participation . . . 108
4.5 Robustness checks for selection into training participation . . . 110
4.6 Probit regression results for training categories . . . 113
4.7 Fixed e¤ects regression results for base salary and wage growth 115
4.8 Fixed e¤ects regression results for bonus payments and bonus
increase (baseline) . . . 116
4.9 Fixed e¤ects regression results for logarithm of bonus pay- ments by training category . . . 117
4.10 Fixed e¤ects regression results for number of trainings . . . 119
4.11 Fixed e¤ects regression results for training composition . . . . 121
4.12 Regression results for overtime work, absenteeism and turnover 123 4.13 Av. training participation (in at least one training) by em- ployee status and category . . . 127
4.14 Fixed e¤ects regression results for logarithm of bonus pay- ments (interactions with employee status) . . . 128
4.15 Composition of individual trainings . . . 128
5.1 Distribution by hierarchical level . . . 136
5.2 Descriptive statistics for measures of dispersion . . . 138
5.3 Di¤erentiation over year and hierarchical level . . . 139
5.4 Di¤erentiation over year and functional area . . . 140
5.5 Fixed e¤ects regression results with measures of dispersion for balanced panel 2005-2007 . . . 143
5.6 Interactions between measures of dispersion and hierarchical levels . . . 145
5.7 Fixed e¤ects regression results with measures of dispersion (retail banking excluded) . . . 148
5.8 Fixed e¤ects results for subgroups of functional areas (coe¢- cient of variation) . . . 149
5.9 Fixed e¤ects results for subgroups of functional areas (P90/P10 ratio) . . . 150
5.10 Interactions with career ladders (coe¢cient of variation) . . . 151
5.11 Robustness check with collapsed data set . . . 153
5.12 Examples of speci c functions . . . 157
5.13 Fixed e¤ects regression results with measures of dispersion for
balanced panel 2006-2008 . . . 158
5.14 Fixed e¤ects regression results for hierarchical levels (coe¢- cient of variation) . . . 158 5.15 Fixed e¤ects regression results for hierarchical levels (P90/P10
ratio) . . . 159 5.16 Fixed e¤ects regression results with measures of dispersion for
balanced panel 2006-2008 (retail banking excluded) . . . 159
5.17 Interactions with career ladders (P90/P10 ratio) . . . 160
List of Figures
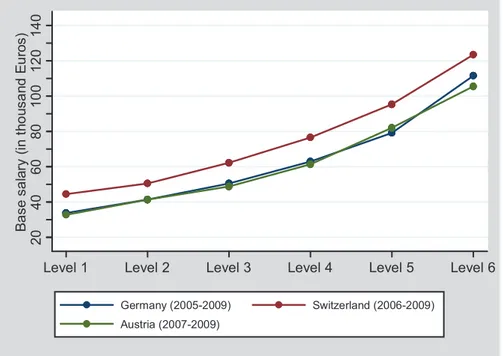
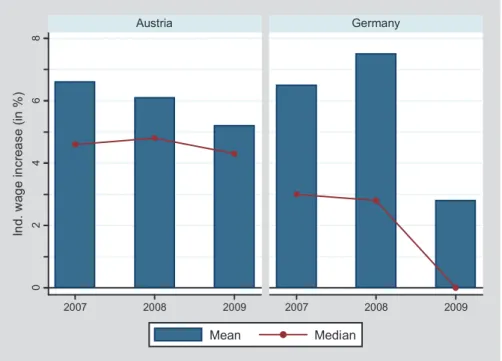
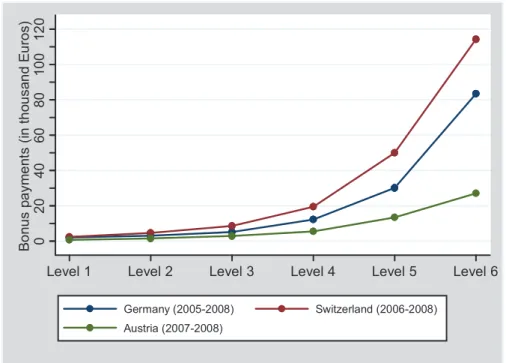
2.1 Average base salary over level . . . 24 2.2 Average base salary over module (Germany) . . . 25 2.3 Individual wage increase (mean and median) . . . 27 2.4 Average short-term bonus payments over level before nancial
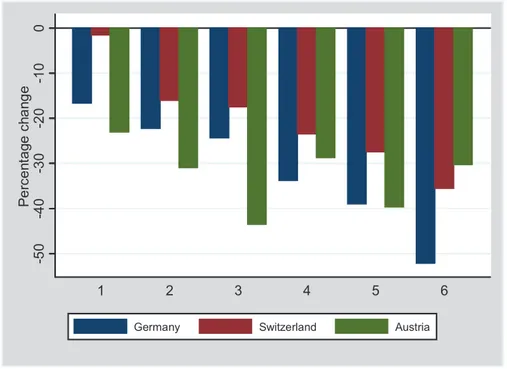
crisis . . . 31 2.5 Percentage changes in bonus payments over level from 2008 to
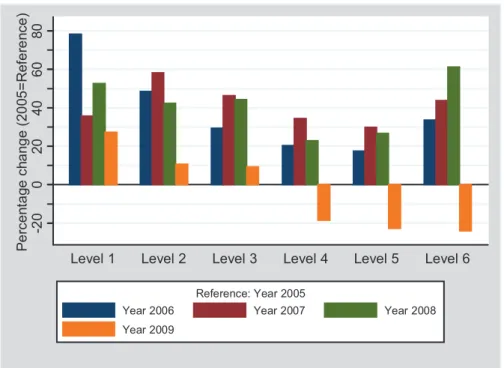
2009 . . . 33 2.6 Annual percentage changes in bonus payments over level (Ger-
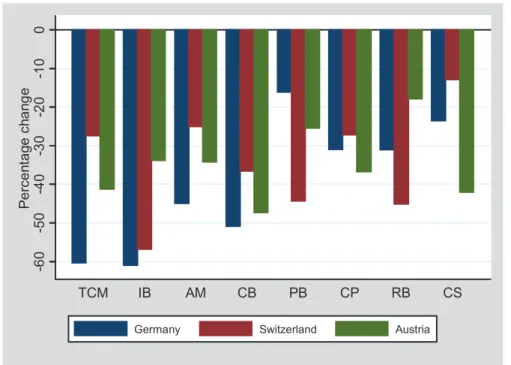
many, reference: year 2005) . . . 34 2.7 Percentage changes in bonus payments over functional area
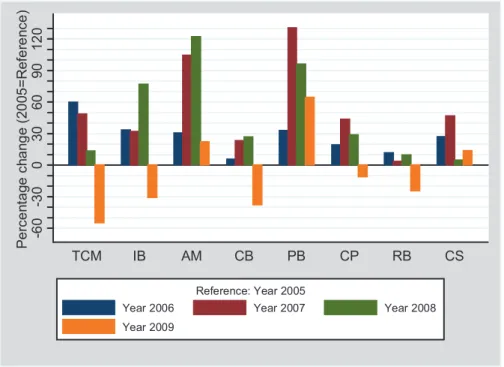
from 2008 to 2009 . . . 35 2.8 Annual percentage changes in bonus payments over module
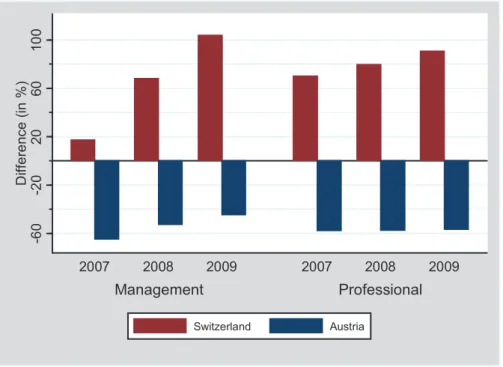
(Germany, reference: year 2005) . . . 36 2.9 Di¤erences in bonus payments between career ladders (refer-
ence: Germany) . . . 38 2.10 Individual median wage increase over module (Germany) . . . 61 2.11 Individual median wage increase over module (Austria) . . . . 61 2.12 Annual percentage changes in bonus payments over level (Switzer-
land, reference: year 2006) . . . 62 2.13 Average bonus payments over module (Germany) . . . 63 2.14 Annual percentage changes in bonus payments over module
(Switzerland, reference: year 2006) . . . 64
4.1 Average training participation by employee status and year . . 103
4.2 Average training participation by training category . . . 104
4.3 Average classroom training participation by employee status and training category . . . 105 5.1 Deciles of coe¢cient of variation for bonus payments . . . 139 5.2 Kernel density plot of bonus payments for lagged quintiles of
CV bonus . . . 141 5.3 Return on equity and lagged CV Bonus (2004-2007) . . . 155 5.4 Change in ROE from 2007 to 2008 and average CV Bonus
(2004-2007) . . . 156 5.5 Deciles of P90/P10 ratio for bonus payments . . . 160 5.6 Change in ROA from 2007 to 2008 and average CV Bonus
(2004-2007) . . . 161
Chapter 1 Introduction
This thesis is about the relationship between compensation and performance.
The following four chapters empirically investigate the determinants and per- formance e¤ects of compensation schemes. The studies presented here give answers to a subset of relevant questions often raised by practitioners and economists. These topics include the e¤ects of a higher di¤erentiation in bonus payments on individual performance, the determinants of wage pre- mia for newly hired employees, the long-term e¤ects of intra- rm training participation, and the e¤ect of the recent nancial crisis on the determinants of compensation schemes. Furthermore, if applicable, we derive practical implications based on the empirical results. All chapters have two things in common: First, they are all related to compensation policies, i.e. they all focus either on base salaries or short-term bonus payments or a combination of both. And second, they are based on two large-scaled data sets, because in the end the answers to the questions raised above are empirical ones.
As outlined in the following chapters in detail, the design of competitive
and incentive-compatible compensation schemes is one of the major chal-
lenges companies have to face in recent times. Pay decisions have an impact
on a wide variety of activities along the HR value chain as they inuence
activities like recruitment, development, and retainment of employees. Also,
pay is an important element for the motivation and satisfaction of employ-
ees.
1Although compensation schemes are a major part of the internal incen- tive structure inside rms, the "economic understanding of internal incentive structures is far from complete" (Baker et al. (1988)). This is especially true for non-executive employees, as the majority of studies has predominantly fo- cused on CEO and top executive positions (see e.g. Murphy (1985), Coughlan and Schmidt (1985), Abowd (1990), Barro and Barro (1990), Gibbons and Murphy (1990), Jensen and Murphy (1990b), Jensen and Murphy (1990a), Leonard (1990), Aggarwal and Samwick (1999), Eriksson and Lausten (2000), Aggarwal and Samwick (2003) and Jensen and Murphy (2010)).
In this thesis, we therefore focus on non-executive employees, i.e. lower- and middle-level employees below the top management level. In the following, we will shortly present the main research questions of each chapter and try to highlight similarities and connections between the studies.
2The thesis can be divided into two parts. In the rst part (chapters 2 to 4), the determinants of compensation schemes in a broader sense are being investigated.
Chapter 2 provides an extensive overview on compensation schemes in one of the main areas of the tertiary sector, namely the banking and nancial services industry. This area is of high importance as banks, in their role as - nancial intermediaries, are responsible for the allocation of nancial resources between all participants of the nancial system. But more important, poorly adjusted pay systems in this sector may lead to excessive risk-taking behav- ior of employees leading to immense external e¤ects as the current crisis has quite impressively shown. The research questions we address in this chapter include: What are the determinants of compensation for non-executive em- ployees in this sector? And what is the impact of the current economic crisis on the determinants and outcomes of payment schemes? Analyses include the development of base salaries and short-term bonus payments as well as bonus eligibility rates and pay dispersion. Finally, econometric results on the
1
For the relevance of non-monetary incentives like e.g. awards see a.o. Frey (2007), Frey and Neckermann (2008), Frey and Neckermann (2009), Frey (2010), Kosfeld and Neckermann (2011).
2
The relevant literature is presented at the beginning of each chapter.
determinants of xed and variable compensation for non-executive employees are presented.
The third chapter analyzes wage premia for newly hired employees. It is often claimed by practitioners, that newly hired employees receive a wage pre- mium compared to incumbent employees even if both do the same job. The research questions we study include: Do we observe economically signi cant wage premia for newly hired employees compared to incumbent employees?
And if yes, what are the determinants of these premia? The focus in this chapter is therefore on xed salaries. It can be shown theoretically as well as empirically that di¤erences in human capital, i.e. the speci city of human capital (general vs. rm-speci c), determine whether wage premia are paid to newly hired employees or whether incumbents earn more in the same job.
Chapter 4 investigates the relationship between intra- rm training par- ticipation and monetary outcome variables. In these analyses we focus on both xed salaries and short-term bonus payments. The questions we ad- dress include: What are the determinants of intra- rm training participa- tion? And does training participation have a sustainable e¤ect on individual performance, measured by monetary indicators? We therefore analyze if in- vestments in trainings and employee learning are signi cant determinants of individual compensation. Additionally, we study the e¤ects of training par- ticipation on non-monetary indicators like absenteeism, overtime work and employee turnover. To conclude, chapters 3 and 4 analyze the role of human capital as determinants of both base salary and bonus payments, whereas in chapter 2, a broader set of determinants of individual compensation is being studied.
In the second part of the thesis (chapter 5), the focus switches from the determinants to potential e¤ects of compensation schemes. Here, the perfor- mance e¤ects of a higher di¤erentiation in individual bonus payments are be- ing studied. This is one of the main challenges practitioners are dealing with in recent times and many companies discuss this topic quite controversially.
33
For discussions on the controversial issues in the popular press see for instance Per-
formance Reviews: Many Neeed Improvement in the New York Times, September 10,
2006 or The Struggle to Measure Performance in Business Week, January 9, 2006.
The design of compensation schemes in companies is always characterized by a potential trade-o¤ between fairness considerations and the provision of incentives. The key question is whether to treat employees equally, i.e.
to pay equal wages to all workers, or to reward higher levels of e¤orts ade- quately leading to more di¤erentiated pay schemes. The research questions we address include: Does a higher di¤erentiation lead to increased individ- ual performance? What are potential economic e¤ects? And are there areas where higher levels of di¤erentiation may be harmful?
The analyses presented in this thesis are based on two data sets.
4The studies presented in chapter 2, 3, and 5 are based on the INbank compensa- tion data base obtained from the management consultancy Towers Watson
5. This data base is one of the largest of its type in the European nancial services sector. We contribute to the literature on compensation research by making use of some new elements of the data set, as a large number of di¤er- ent companies of a whole industry, the banking and nancial services sector, are included in the survey. Additionally, detailed rm-speci c information that is comparable between companies is available as a multitude of speci c job functions is de ned through a detailed set of job descriptions and pro les of knowledge and skills required for the relevant position. We also make use of new waves of the data set including years between 2005 and 2009. This allows us to analyze the rst e¤ects of one of the most severe nancial crises on the determinants and outcomes of compensation schemes. The second data set, used in chapter 4 for the analyses of intra- rm training participa- tion on individual performance, comprises personnel records from a large, multinational company headquartered in Germany. Detailed information on training participation, compensation elements and demographic background is available.
We now discuss the content of the following chapters in more detail. The rst part of chapter 2 shows descriptive statistics for the main compensa- tion variables base salary, short-term bonus payments and the bonus-to-base
4
Due to reasons of con dentiality, the data sheets had to be anonymized. Sparkassen (publicly owned savings banks), Volks- and Rai¤eisenbanken (cooperative banks) and the Deutsche Bundesbank (German central bank) are not part of the sample.
5
Formerly known as Towers Perrin.
ratio. We nd the typical positive, convex relationship between base pay and hierarchical level, with highest average wages in Switzerland. Regard- ing functional areas, wages in investment banking, asset management and treasury and capital markets dominate, with a steadily convergence of wage levels over time between countries. The nancial services sector is also char- acterized by a high number of employees that are eligible for short-term bonus payments, especially at upper levels in the hierarchy. But there are also employees who, although being actually eligible, receive no (positive) bonus payment at the end of the year. We nd that for Germany and Aus- tria, the nancial crisis leads to a signi cant increase in the proportion of employees with zero bonuses at all levels, whereas Swiss banks seemed to be afraid of bonus cuts as the proportion is quite stable over time. Com- pared to xed wages, the convex relationship between bonus payments and hierarchical level is very pronounced and average bonuses are the highest in capital market-based functions like investment banking, asset management and treasury and capital markets. We further investigate the impact of the nancial crisis on variable payments. A key result is the massive decrease in bonuses especially at upper levels in the year 2009. Interestingly, these employees also face a loss in bonuses compared to pre-crisis reference years, whereas lower-level employees are nancially better o¤ in 2009 than before the crisis.
The second part of this chapter presents regression results for the determi- nants of xed and variable compensation. Coe¢cients in estimates with base salary as dependent variable are quite stable over time and broadly con rm the descriptive evidence and the typical age-earnings pro le. Econometric re- sults for estimates with variable payments, however, are much more di¤erent between countries with quite volatile regressions coe¢cients over time. Large di¤erences are visible when comparing the results for functional areas and the impact of the nancial crisis on bonus payments. In a last step, struc- tural di¤erences in the explanatory power of the models are investigated.
The results show that xed compensation packages are highly standardized
between companies in all of the three countries, with hierarchical level as the
main single determinant. Bonus payments, however, are stronger related to
individual e¤orts. In Germany, bonuses vary to a high extent across com- panies, whereas in Switzerland and Austria company di¤erences are almost negligible with only marginal increases in R-squared due to additional rm controls.
In chapter 3, wage di¤erences between newly hired and incumbent em- ployees are being investigated. This question is studied theoretically as well as empirically for employees in the nancial services sector.
A formal model is used to derive hypotheses on the determinants of these wage premia, i.e. the sign and the size of the e¤ect. The model assumes that employees have similar experience on the labor market, are quali ed for only one type of job in the industry and care for wages as well as match-speci c utility (e.g. satisfaction with colleagues, supervisor or corporate culture).
It is shown that incumbents earn less than new recruits if and only if rm- speci c human capital is not too important. If rm-speci c human capital is very important, rms will pay a higher wage to incumbents to increase the likelihood that the employees stay with their current employer and the speci c skills are not lost.
The conjectures of the model are then being investigated using the INbank data set on wages in the German banking and nancial services sector. The results show that average wage premia for newly hired employees are statisti- cally and economically signi cant, controlling for demographic, workplace as well as rm characteristics. As the model makes predictions on the inuence of hierarchical levels and functional areas, results of interaction terms are also presented. Relative wage premia for new recruits are larger at higher hi- erarchical levels, where general managerial human capital is more important.
Regarding functional areas, highest premia are found in capital market-based
areas such as treasury and capital markets as well as investment banking and
corporate banking where transferable client-speci c human capital seems to
be more important than rm-speci c human capital as it is very valuable for
competitors. In a last step, wage di¤erentials for management and expert
positions are being investigated and higher premia in managerial positions
can also be con rmed. In the second part of this chapter, a measure for the
importance of rm-speci c human capital is generated that allows a direct
test of the model. The results indeed show a negative correlation between the measure of the importance of rm-speci c human capital and average wage premia for newly hired employees.
In chapter 4, the determinants and e¤ects of intra- rm training partici- pation on earnings and job performance are being investigated. The main re- search question we address is whether company training sustainably increases the productivity of employees, as the empirical results in the literature are mixed so far. Previous studies mainly focussed on the organizational level, whereas research using individual-level data is mainly based on national sur- vey data sets. Empirical research based on company data sets, however, is rare. We contribute to the literature by using a unique company data set of a large, multinational German company that contains detailed informa- tion on compensation and classroom training participation. Besides xed and variable compensation, we also have information on several job indica- tors like absenteeism and overtime hours as well as turnover probabilities.
Furthermore, we can identify a bundle of di¤erent training categories, like e.g. leadership, project management, business administration or technical trainings.
Probit regressions show a higher likelihood of training participation for junior managers compared to non-exempt employees and senior managers in- dicating that the training program of the company mainly focuses on younger university graduates with less labor market experience. A striking result is the negative selection e¤ect of employees into trainings, i.e. less productive employees are more likely to participate in classroom trainings. Regressions with the di¤erent training categories as dependent variable show that even leadership and project management trainings are more likely to be sta¤ed with less productive employees.
Applying panel data methods to eliminate unobserved heterogeneity, we
do not nd an economically signi cant short-term performance e¤ect mea-
sured by base salary. Using individual bonus payments as a productivity
measure, we nd an economically signi cant short-term e¤ect. But one year
later the e¤ect disappears, so we do not nd a long-term e¤ect of training par-
ticipation on performance measured by these monetary indicators. Several
robustness checks con rm these results, as only the incidence of participation matters and not the number or composition of the training mix. A possible explanation is the link between training participation and the performance measurement system of the company. In the second part of this chapter, the e¤ects of training participation on non-monetary job indicators are being investigated. We nd a positive relationship between training participation and overtime hours. Furthermore, training negatively a¤ects the absence of employees and turnover probability rates.
Chapter 5 analyzes the performance e¤ects of di¤erentiation in bonus payments on subsequent individual performance. The majority of bonus contracts, except those in sales functions, are based upon subjective per- formance evaluations rather than on objective output indicators. Empirical researchers often claim that supervisors do not di¤erentiate enough between high performing and low performing employees when evaluating performance.
This leads to a compression in performance ratings what in turn should re- duce the incentive e¤ects of bonus plans and lead to a lower performance of employees. But practitioners sometimes argue that a higher di¤erentiation like e.g. forced distribution systems may lead to a decrease in employees mo- tivation or a crowding out of intrinsic motivation. We therefore contribute to the literature by studying the impact of di¤erentiation in bonus payments on performance empirically with a large panel data set for the nancial services industry.
We indeed nd that, on average, a stronger di¤erentiation in a given
work unit has a substantial positive e¤ect on individual performance in this
unit in the subsequent year, all other factors constant. Compared to depart-
ments with rather undi¤erentiated incentives, the performance of employees
in departments where the supervisor is among the 20% strongest di¤eren-
tiators is on average about 31% higher. This e¤ect is the larger the higher
the hierarchical level. But di¤erentiation has no signi cant e¤ect or even
becomes harmful at the lowest levels in the data set. As objective perfor-
mance measures are only rarely available at lower levels, biased subjective
assessments may therefore outweigh the incentive e¤ects of di¤erentiation,
whereas employees at higher levels are more visible what makes assessing
their performance easier. Looking at functional areas, di¤erentiation has the
strongest e¤ect in retail banking and corporate and private banking, both
areas with a high coverage of objective performance indicators. A nega-
tive relationship between di¤erentiation and performance can be found for
the lower-skilled service functions, where subjective performance measures
dominate. We also nd a stronger e¤ect of di¤erentiation for managerial
employees than for functional experts. In the second part of this chapter we
present some robustness checks and give a rst indication of the e¤ects of
di¤erentiation on rm performance using a rm-level data set combined with
information on nancial statements. The results show a positive relationship
between higher di¤erentiation levels and rm performance measured by the
return on equity before the nancial crisis, but indicate that a higher di¤er-
entiation in the past may have enforced risk-taking behavior of employees in
the rst year of the crisis.
Chapter 2
The Impact of the Financial Crisis on Non-Executive
Compensation 1
2.1 Introduction
Human capital as an intangible asset gets increasingly important in modern economies. More and more companies operate in employee-intensive busi- nesses where human capital is regarded as a critical asset and not purely a cost factor (Lev (2001)). As personnel costs often represent the largest part of total costs in these companies, the design of pay packages is of strategic importance and therefore directly inuences corporate performance. Im- portant parameters include the right adjustment between xed and variable elements and the pay-for-performance relationship. Second, variable pay sys- tems become more and more popular for companies to make pay costs more volatile, as increases in xed compensation become part of future salaries (Milkovich and Newman (1996)). This is expensive in the long run, even more as nominal wage cuts are only rarely observable in companies. Vari- able pay, however, is much more exible as it depends to a higher extent on divisional and corporate performance. This implies that bonus payments
1
This chapter is based upon Kampkötter (2010).
will typically decrease in times of economic downturn and increase otherwise.
Additionally, the structure of the pay mix is highly important for the moti- vation, commitment, and behavior of employees inside the company as well as for activities along the HR value chain like e.g. recruiting, developing and retaining employees. Pay systems therefore have to be internally consistent and externally competitive (Milkovich and Newman (1996)). And, most im- portant, performance-related pay helps to align the goals of managers and employees with those of the company respectively the shareholders. Hence, the design of competitive compensation schemes is one of the major chal- lenges companies have to face with in recent times.
But a closer look on previous research about compensation systems and their practical implementation is necessary. Companies vary extremely with respect to the design of their compensation systems, even in the same indus- try. Especially variable payment schemes gained increasing attractiveness in recent times
2and are implemented with various modi cations between com- panies. Past research has predominantly focused on the analysis of CEO and top management compensation. There is a vast amount of studies on the determinants
3and e¤ectiveness of top management compensation systems in the economic literature as required data sets are often publicly available.
These studies mainly address two research questions: 1) Is there a relation- ship between (executive) compensation and corporate performance? And 2) What are typical determinants of (top) management and executive compen- sation? The rst relationship is often referred to as pay-for-performance sen- sitivity. Relevant studies include a.o. Murphy (1985), Coughlan and Schmidt (1985), Abowd (1990), Barro and Barro (1990), Gibbons and Murphy (1990), Jensen and Murphy (1990b), Jensen and Murphy (1990a), Leonard (1990), Aggarwal and Samwick (1999), Eriksson and Lausten (2000), Aggarwal and Samwick (2003) and, more recently, Jensen and Murphy (2010).
4A recent
2
For a recent survey on more than 1,400 U.S. companies see the 2010 Hewitt U.S.
Variable Compensation Measurement Survey.
3
See Tosi et al. (2000) for a meta-analytic review.
4
Studies on executive compensation often also include the analysis of long-term incen-
tive payments like stock option plans, because this is an important element of top man-
agement compensation (for a comprehensive overview see e.g. Murphy (1999)). As our
study by Kampkötter and Sliwka (2011) analyzes this relationship for non- executive employees.
Although compensation policies as part of the internal incentive structure seem to be very important, the "economic understanding of internal incen- tive structures is far from complete" (Baker et al. (1988)). Limitations are predominantly visible for employees below the top management level. This may include middle and lower-level as well as non-exempt employees. Up to now empirical evidence on the practice of compensation schemes, i.e. its determinants and performance consequences, for these group of employees is relatively scarce. Indeed, those employees are characterized by a reduced impact on corporate results compared to the top management team. But they still have a positive impact and are important for the cascading of the corporate strategy like e.g. the head of a functional area or a branch man- ager (Ortín-Ángel and Salas-Fumás (1998)). We therefore want to analyze the determinants and patterns of non-executive compensation using a large data set on individual compensation in the nancial services industry of three European countries.
Additionally, in papers analyzing pay schemes of non-executive employ- ees, often only xed wages are analyzed (see e.g. Baker et al. (1994b) and Baker et al. (1994a)
5). As a result, there is only a small number of empirical studies on both xed and variable pay components for the mentioned group of employees (see e.g. Gerhart and Milkovich (1990), Abowd (1990), Leonard (1990), Stroh et al. (1996), Ortín-Ángel and Salas-Fumás (1998), Eriksson and Lausten (2000), Nash (2003), and Gibbs and Hendricks (2004)).
6It is also important to analyze industry-speci c and regional di¤erences. Out of the small number of empirical studies for employees below top manage- ment level, there are only very few that analyze pay systems in the nancial services industry.
7The main reason is the restricted access to con dential
focus is on non-executive employees, we only concentrate on short-term bonus payments.
5
Information on bonus payments is not used in this two studies as it is not available for all years.
6
Furthermore, the majority of these studies uses data sets that have been collected about 10 to 20 years ago.
7
Nash (2003) e.g. analyzes the determinants of nancial incentives in the UK invest-
ment banking sector using a data set from a professional consultancy rm. See also Barro
personnel records in this very competitive market. But the banking and nancial services industry seems to be very suitable especially for the analy- sis of variable payment schemes as employees short-term bonus eligibility is above industry average.
8Furthermore, almost all studies use data sets from the U.S. or UK, whereas data sets for continental European countries seem not to be present.
9We therefore contribute to the existing literature by addressing some of the major limitations in this eld of research mentioned above. In a rst step we study the determinants of compensation schemes for middle and lower- level employees using a comparatively large data set with up to 120,000 annual observations for the years 2004-2009. Our data set is owned by the management consultancy Towers Watson
10, where it is used for professional compensation benchmarking. We will shed some light on compensation pat- terns by using detailed job-speci c information other studies often lack (e.g.
Gerhart and Milkovich (1990)) like broader functional areas, detailed func- tions, career ladders and hierarchical levels. We are also able to distinguish between areas with standardized products and processes like retail banking and asset management and more client-speci c elds like corporate banking.
Our key variables include, besides base salary, annual short-term bonus pay- ments and the ratio of variable payments to xed salary. Second, we are among the rst to introduce an international dimension into the research on the design of compensation systems by comparing data from Germany, Aus- tria and one of the worlds leading nancial markets, Switzerland.
11Third, we are able to analyze the results over time and also make use of new waves of the data set, which is very important as we can compare if the results are stable in di¤erent states of the economy. A major feature is that we can
and Barro (1990) and Treble et al. (2001).
8
Stroh et al. (1996) e.g. nd that in regressions with variable pay as proportion of total compensation as dependent variable, the coe¢cient for the nancial services industry is the largest.
9
Except Ortín-Ángel and Salas-Fumás (1998).
10
In economics, Towers Watson (formerly Towers Perrin) data sets have also been used by Abowd and Kaplan (1999), Murphy (1999), and Murphy (2001).
11
Abowd and Bognanno (1995) analyze executive and managerial compensation for
twelve OECD countries. Grund (2005) compares personnel records of a U.S. and a German
manufacturing rm.
also analyze the impact of one of the most severe nancial crises starting in 2008 with the breakdown of Lehman Brothers. Investigating the e¤ects of compensation packages on corporate performance for employees below top management is quite di¢cult, as the individual impact on corporate results diminishes at lower levels of the hierarchy. Therefore, this relationship is not being investigated in this study.
This chapter proceeds as follows. In section 2.2, the background and related literature is described. Section 2.3 explains the data set and the applied empirical strategy. Descriptive statistics of compensation practices between countries are shown in section 2.4, whereas section 2.5 economet- rically analyzes the determinants of compensation schemes. Finally, section 2.6 concludes.
2.2 Background and Related Literature
Di¤erent theoretical approaches are used to formulate hypotheses on the determinants of compensation schemes. These determinants can typically be categorized into three di¤erent dimensions: job characteristics, employee characteristics, and rm/organizational characteristics (see e.g. Baker et al.
(1988), Gerhart and Milkovich (1990), Milkovich and Newman (1996), Ortín- Ángel and Salas-Fumás (1998)). Job characteristics typically include the hierarchical position of the employee, functional area, detailed function, type of job (exempt vs. non-exempt, supervisory tasks vs. functional experts), and region. Employee characteristics include human capital variables like age, rm tenure, job tenure, labor market experience and years of education.
Firm characteristics are often proxied by rm dummies or key indicators like e.g. rm size, sales, net income, pro ts, and the number of employees.
Agency theory predicts that performance-based compensation packages are helpful in aligning the agents (manager, employee) interests with those of the principal (e.g. shareholders, boards of directors).
12This is important
12
Seminal papers include Holmström (1979) and Grossman and Hart (1983). For a
comprehensive overview see e.g. Hart and Holmstrom (1987) or Milgrom and Roberts
(1992).
because individual e¤orts may have, dependent on the hierarchical level, a strong inuence on corporate performance like sales or nancial results, and the principal is often unable to adequately monitor the agents behavior. In incentive contracts a signal of the productivity of an agent is used that is com- posed of the non-observable e¤ort of an employee and an error term measur- ing external inuences on productivity that are not under the agents control.
The likelihood of performance-related pay is negatively correlated with the noise of the performance signal indicating that higher-powered incentives are less suitable in functional areas where the signal (the performance measure) is noisier. In these cases the agent has to be compensated for the additional risk in its income, what makes incentive systems more expensive. Therefore, the size of bonus payments and the probability of receiving a bonus should be higher in sales areas where indicators are less noisy and capture real perfor- mance more accurately. Nash (2003) indeed nds that performance-related pay is more prominent in areas where the observability of output is more easily measurable, e.g. retail banking and asset management with standard- ized products and transactions. In support and cross-divisional functions like marketing or human resources, individual output is, at best, observable after a longer time period and therefore often not measurable in the short run.
There are several reasons for a positive relationship between hierarchical level and the size of base salary and bonus payments. According to tourna- ment theory (see e.g. Lazear and Rosen (1981) and Rosen (1986)), employees compete for higher-level positions in a promotion tournament. The related wage increase at the next level constitutes the winner prize. Ideally, to o¤er incentives, wage spreads should increase with the level in the hierarchy, with the largest di¤erence moving from second-highest to the top level (empirically shown e.g. in Baker et al. (1994a), Baker et al. (1994b), Grund (2005), van Herpen et al. (2006)).
13Other explanations refer to deferred compensation (Lazear (1979)) and decreasing career concerns when one moves up the hier- archy (Gibbons and Murphy (1992)). As promotion opportunities decrease at higher levels, additional variable payments have to be o¤ered to employees.
13
A recent study by Harbring and Irlenbusch (2011) shows that higher wage spreads
also induce negative e¤ects, but agents also act reciprocally to higher wages.
At lower levels, the whole set of future career opportunities should be a good motivator for employees, so that career concerns o¤er su¢cient incentives for younger employees.
14As a result, we expect the size of bonus payments and bonus eligibility rates to increase with the hierarchical level an employee is located at. Another argument deals with the leverage e¤ect of individual e¤orts (see e.g. Gibbons and Waldman (1999)). At upper levels, employees have a higher impact on corporate results than lower-level employees, which makes them more productive for a company if their interests are in line with those of the rm. One possible reason is that higher-level employees with a wider span of control have a higher marginal revenue product than lower- level employees. Also tasks and jobs are less programmable, i.e. harder to monitor, at higher levels in the hierarchy, so we expect a negative relation- ship between task programmability and the importance of variable payments relative to total compensation as well as an increasing use of incentive con- tracts at upper levels. This is indeed con rmed e.g. by Abowd (1990), Stroh et al. (1996), and Ortín-Ángel and Salas-Fumás (1998).
15The theory of career concerns (Gibbons and Murphy (1992)) can also be applied to explain a positive relationship between age and the size and prob- ability of receiving variable payments. With increasing age, career concerns and career opportunities tend to decrease and employees therefore have to be incentivized by variable payments. Ortín-Ángel and Salas-Fumás (1998) indeed nd that bonus payments are more relevant for older managers with longer tenure. According to human capital theory (seminal contributions are Becker (1962), Becker (1964), and Mincer (1974)), base pay is determined to a large extent by human capital variables like education and job and labor market experience. With investments in education, training, and on-the-job learning employees accumulate general and rm-speci c human capital that should lead to higher base salaries. Also high investments in human capital are more likely for jobs with low programmability and higher potential im- pact on corporate performance, so performance-based pay is more likely for more experienced employees (Gerhart and Milkovich (1990)).
14
For a detailed discussion on the role of information see Dewatripont et al. (1999).
15
See e.g. Eisenhardt (1989) for a detailed overview.
Previous research has shown that job grade or hierarchical level proves to be the most important single determinant of base salary and variable pay (Gerhart and Milkovich (1990), Nash (2003)).
16After additionally control- ling for job and individual characteristics, di¤erences in xed and variable pay schemes may remain between companies. These di¤erences are then at- tributed to organizational characteristics, like e.g. industry a¢liation, rm size, nancial results, competitive position, or a diverse implementation of the corporate strategy. In studies that lack these indicators, rm dummies are often integrated into the regression model and a comparison of the increase in explained variance between the models with individual and job-speci c characteristics as well as rm dummies is carried out. We follow this ap- proach, as we also have no information on nancial indicators, rm size and corporate strategy.
Empirical results for the di¤erences in salary levels between companies after controlling for the whole set of characteristics are mixed so far. Some studies nd large and persisting di¤erences in salary levels over time (see Groshen (1991a) and Groshen (1991b) for early reviews), whereas diminish- ing di¤erences are explained as a result of an increasing use of compensa- tion benchmarking surveys by professional consulting rms as companies are forced to o¤er a market-based compensation to potential employees and also to assure the retaining of high performers. Others argue that these di¤er- ences tend to be determined more randomly (Leonard (1990)). For variable payments, this is not so obvious as bonuses should ideally depend on indi- vidual e¤orts and the performance of the company. Gerhart and Milkovich (1990) e.g. indeed nd that even similar companies di¤er to a large extent in their variable compensation policies.
16
Leonard (1990) con rms this result for total pay (sum of base salary and bonus pay-
ments).
2.3 The Data
2.3.1 Data Set
We investigate a large data set on individual compensation in the German, Swiss and Austrian nancial services industry. A major feature of the data set is the fact that the vast majority of companies in this industry is being included in the survey. For Germany, we have annual information on between 105,000 and 140,000 employees for the years 2005-2009, for Switzerland on be- tween 50,000 and 70,000 employees for 2006-2009 and for Austria on around 20,000 employees between 2007 and 2009. It is important to note that we do not have information on CEO and top executive positions.
17A crucial char- acteristic is the high validity of the data, because individual information on pay and job positions is used for professional compensation benchmarking.
18A common problem with company data refers to a possible self-selection bias, because rms often voluntarily participate in compensation surveys. But the problem is mitigated in our study as rms are requested to report more than 2/3 of all employees of a certain job category and, additionally, the survey covers the vast majority of banks and nancial companies in the respective market.
19In detail, the data set contains information on individual compensation like base salary and short-term bonus payments
20and demographic informa-
17
The data set is owned by the international management consultancy Towers Watson (formerly Towers Perrin). Due to reasons of con dentiality, the data sheets had to be anonymized.
18
There is always a trade-o¤ between national survey data sets including self-reported information on pay and data from professional compensation consultancy rms. The former method is typically characterized by a smaller number of observations accompanied with a more detailed set of demographic and personal information like e.g. gender, sex, and educational background. But self-reported compensation data often lack detailed rm-speci c information and, perhaps more important, the reliability of the data has to be questioned. Compensation data sets from consultancy rms are characterized by a larger number of observations and detailed rm-speci c information and are regarded much more reliable in terms of data consistency, as information is double-checked by company experts as well as consultants.
19
Sparkassen (publicly owned savings banks), Volks- and Rai¤eisenbanken (cooperative banks) and the Deutsche Bundesbank (German central bank) are not part of the sample.
20
Swiss Francs are converted to Euros using ECB foreign exchange reference rates (see
http://www.ecb.int/stats/exchange/eurofxref/html/index.en.html)
tion on employees age, tenure, six hierarchical levels, eight main functional areas, and regional information. The hierarchical levels include entry level positions for apprentices and high school graduates up to divisional heads, the highest position in the data set. The functional areas reect the eight main areas in the banking and nancial services industry: retail banking (RB), pri- vate banking (PB), corporate banking (CB), investment banking (IB), asset management (AM), treasury and capital markets (TCM) as well as the sup- port and service functions (corporate services (CS)) and the cross-divisional functions (corporate production (CP)). These functional areas are further subdivided into 70-80 speci c functions that are used for more detailed com- pensation analyses. Retail banking, e.g., comprises the functions retail sales, business analysis, and retail product development. The cross-divisional func- tions include a.o. marketing, legal, HR, nance, and accounting.
21Towers Watson uses the standardized "career ladder methodology" to make career steps and job positions comparable between di¤erent compa- nies in an industry and between countries. Therefore, typical career steps in an employees career (starting with entry as university graduate or appren- tice) in one of the career ladders management, professional, retail sales and support are de ned using detailed job pro les of required knowledge, skills, and abilities for each possible position in the industry. Jobs in the manage- ment ladder are characterized by supervisory and general management tasks, whereas the professional ladder includes functional expert positions with no direct managerial responsibilities.
22The retail sales ladder encompasses jobs in retail sales functions and back o¢ce and call center positions are included in the support ladder.
Tables 2.17 and 2.18 in the appendix show the distribution of employees by hierarchical level and year for the three countries. It is obvious that the distribution of employees by hierarchical level remains very stable throughout the years, despite an increasing number in total observations especially for Germany and Switzerland. In all countries, a slight increase in proportions at
21
For an exemplary overview of the functions see Kampkötter and Sliwka (2010a).
22
These are e.g. project managers, who coordinate project teams but typically have no
managerial authority.
the top levels coincides with a small decrease at medium and bottom levels.
Compared to Germany and Austria, top-level employees are overrepresented in the Swiss data set and middle-level employees are underrepresented. The distribution of employees by functional area is shown in table 2.19 for the years 2007-2009. The distribution within countries changes moderately over time, but larger di¤erences appear if one looks at the distribution between countries. Germany and Austria are characterized by a domination of retail banking and corporate production positions with more than 60% of all em- ployees working in these sectors, whereas capital market-based functions like investment banking and asset management as well as private banking only play a minor role. The Swiss banking sector is characterized by a similarly high proportion of employees working in the corporate production area, but the service functions play a more important role than in Germany or Aus- tria. Furthermore, private banking positions are relatively more important in Switzerland, whereas retail banking is of minor importance in recent years.
It is crucial to keep these structural di¤erences in mind when it comes to the interpretation of the results.
2.3.2 Empirical Strategy
The empirical strategy is as follows. First we estimate the determinants of individual base salary for a given individual i in year t with OLS regressions using either cross sections for the three countries or the pooled data set.
23Like in almost all studies, our compensation variables are positively skewed.
We therefore use the logarithm of base pay and bonus payments. The baseline speci cation for individual i is given by
y
i= + Z
i+ C
i+ F
j+ "
for the cross sections and for individual i in year t in the pooled data set by
23
For purposes of clarity, pooled cross section results for years before the nancial crisis
are compared with the cross sectional results for the year 2009.
y
it= + Z
it+ C
it+ F
j+
t+ "
The dependent variable y
iis the logarithm of base salary for employee i in each of the cross sections. As it is important to account for di¤erences in human capital and rm and job-speci c inuences, our controls include a vector of demographic variables Z
i(age, age squared, rm tenure, rm tenure squared) and a vector of job-related controls C
i(functional area, hierarchical level, career ladder and regional area). Organizational e¤ects are captured by a dummy variable F
jfor each rm
jin the data set. The constant is denoted by and the error term by " . The additional index t represents the time dimension in the pooled data set and
tis a vector of year dummies.
Prior to investigating the determinants of short-term bonus payments, we explore two interesting research questions: 1) What determines the likelihood of having a xed compensation regime vs. a performance-based system. And 2) Is there a change in the probability of receiving positive (non-zero) bonus payments for eligible employees over time?
As we have information on the short-term bonus eligibility of employees in the banking sector, we estimate probit regressions with bonus eligibility as dependent variable. The baseline speci cation is given by
y
i= + #base
i+ Z
i+ C
i+ F
j+ "
The dependent variable y
iis a dummy variable that is equal to 1 if em- ployee i is eligible for short-term bonus payments in the given year, and 0 otherwise. As the level of base salary may have a positive impact on the eligibility and likelihood of bonus payments, we include base
iinto the model.
The control vectors Z
i, C
i, the rm controls F
jand the error term " are equal to those described above.
24We further observe employees that are principally eligible for short-term bonuses, but actually do not receive a variable payment at the end of the year.
In companies with target achievement systems a straightforward reason is that the respective employee did not meet its targets. Another reason is that
24
The regression equation for the pooled data set is also similar to that described above.
rms retain bonuses for potentially eligible employees, i.e. bonus pools are (completely) reduced, e.g. in the case of economic downturns. We therefore estimate the probability of receiving a positive, non-zero bonus payment for an actually eligible employee also with probit regressions. We construct a dummy variable that is equal to 1 if an eligible employee i receives a bonus payment that is strictly greater than zero, and 0 otherwise.
For the analysis of the determinants of short-term bonus payments we exclude employees that are principally eligible but receive no positive bonus payment in the respective year, as the determinants of zero bonus payments are already analyzed in the previous subsection. Similar to the regressions with base salary as dependent variable, we apply OLS regressions with the logarithm of bonus payments as dependent variable.
25The set of indepen- dent variables in these regressions is equal to those used in the base salary estimates. Furthermore, robust standard errors are reported in all regres- sions.
2.4 Descriptive Statistics
The aim of this subchapter is to give a detailed, descriptive overview of the key compensation variables and their development over time and country.
Table 2.1 reports mean values for base salary, bonus payments, the bonus to base ratio, and the bonus to total ratio.
26This rst overview shows that average salaries and bonuses are the highest in Switzerland, followed by Germany. It is interesting to note that although the di¤erences in salary levels between Germany and Austria are relatively narrow, there are large di¤erences in short-term bonus payments between countries. This is quite visible if one compares the bonus to base ratios. Whereas this ratio lies at about 23% in Switzerland and 17% in Germany before the nancial crisis,
25
As robustness check, we also apply tobit regressions including zero bonus payments and compare the results.
26
The bonus to base ratio is de ned as bonus payments divided by base salary and
the bonus to total ratio as bonus payments divided by the sum of base salary and bonus
payments (both multiplied by 100 ). Table 2.20 in the appendix shows results for median
values.
variable payments play only a minor role in Austria with values ranging between 6% and 8%. The deep impact of the nancial crisis on variable payments is also highly visible.
Country Overview of pay variables (mean values)
2005 2006 2007 2008 2009
Germany
Base salary 52,581 50,545 54,280 56,840 58,299 Bonus payments 9,487 11,995 12,548 13,961 8,121 Bonus to base ratio 13.5 17.2 17.3 17.7 11.2 Bonus to total ratio 10.3 12.7 12.5 12.4 8.9 Switzerland
Base salary 65,620 63,853 69,431 72,399
Bonus payments 20,049 18,076 20,413 15,410
Bonus to base ratio 23.2 22.2 22.9 16.8
Bonus to total ratio 15.6 15.6 15.5 12.2 Austria
Base salary 51,457 54,556 56,189
Bonus payments 4,196 5,542 3,699
Bonus to base ratio 6.5 8.2 5.4
Bonus to total ratio 5.5 6.8 4.6
Base salary and bonus payments expressed in Euros, ratios in % .
Table 2.1: Overview of pay variables (mean values)
But it is important to note that a cross-country comparison of average
values is critical without considering the structural di¤erences in the com-
position of the industry, mainly the proportion of functional areas and hi-
erarchical levels. Higher average values in Switzerland may, besides a com-
pensation for a higher price level, partly be an artefact of a strong focus
on well-paid private banking activities, whereas in Austria the proportion of
employees in the lower-paid retail banking sector is nearly triple as high as
in Switzerland. We will take this heterogeneity into account and show de-
scriptive statistics over hierarchical level and functional area in the following
subsections. Within a certain area, practices and processes are very similar
across countries, as banks o¤er highly standardized products e.g. to retail
and corporate customers. In capital market-based functions like asset man-
agement the standardization of products is even higher as these products are
traded at the main stock exchanges in the world and are often regulated. Pay di¤erences over countries are therefore quite well comparable if one looks at the same functional area.
2.4.1 Base Salary
Figure 2.1 shows the typical positive and convex relationship between average wages and hierarchical levels. The pattern looks very stable over time, even at the beginning of the nancial crisis. According to tournament theory, pay spreads strictly increase in the hierarchical level with the highest gap between level 5 and top level 6. The average spreads for Germany are: 22%
(between level 1 and 2), 23% (level 2 and 3), 24% (level 3 and 4), 26% (level 4 and 5), and 41% (level 5 and 6).
20406080100120140Base salary (in thousand Euros)
Level 1 Level 2 Level 3 Level 4 Level 5 Level 6 Germany (2005-2009) Switzerland (2006-2009)
Austria (2007-2009)
Figure 2.1: Average base salary over level
Figure 2.2 shows average base salaries over functional area and year for
Germany. Employees in treasury and capital markets, investment banking,
and asset management receive, on average, the highest wages, followed by
corporate and private banking. The lowest wages can be found in retail banking and the service functions.
020406080100Base salary (in thousand Euros)
TCM IB AM CB PB CP RB CS
Year 2005 Year 2006 Year 2007
Year 2008 Year 2009
Figure 2.2: Average base salary over module (Germany)
As explained in the beginning of this chapter, a pay comparison is only meaningful if one compares the same functional areas between countries, which is shown in table 2.2. Comparing Germany and Switzerland, percent- age di¤erences in base salaries in IB, PB, and CS decreased by about 50%
over time, with the highest decrease in IB from 34% in 2005 to 7% in 2009.
In all other areas, di¤erences in 2009 are close to the values in 2005, with fre- quent uctuations during the years. Interestingly, di¤erences in IB between Germany and Austria also decreased the most, followed by TCM and AM.
To conclude, di¤erences in base salaries are rather small nowadays.
2.4.2 Individual vs. Average Wage Increases
As we also have information on previous years salaries for Austrian and
German employees, we are able to compare individual wage increases with
Percentage di¤erences in base salary between Germany (reference) and
Switzerland Austria
2006 2007 2008 2009 2007 2008 2009
TCM 12 1 9 14 -21 -17 -12
IB 34 16 10 7 -26 -26 -13
AM 16 3 11 13 -18 -16 -11
CB 11 3 8 12 -1 0 -2
PB 29 11 15 14 -1 -12 -10
CP 30 18 25 27 -3 -4 -3
RB 25 17 26 21 2 3 4
CS 27 12 12 15 -3 -2 -3
Table 2.2: Percentage di¤erences in base salary between Germany (reference) and other countries
the development of average wages in the data set. Di¤erences between both values may occur due to the recruitment policy of a bank. If the company hires many new employees for lower entry wages, this may cause a decrease in average wages of this rm. But at the same time, increases in individual wages of incumbent workers are typically not a¤ected by this policy.
Figure 2.3 shows mean and median values of individual wage increases for Austria and Germany between 2007 and 2009. Whereas in Austria wage increases remain quite stable in the nancial crisis, German bank employees face a large decrease, with growth rates less than or equal to zero for half of the German employees.
27This may partially be explained by restructuring activities with reallocations of employees as a result of the crisis. Growth rates of average wages in Germany are 7 : 4% (median 10 : 3%) in 2007, 4 : 7%
(2:7%) in 2008, and 2:6% (2:5%) in 2009. To conclude, many incumbents face wage decreases at the beginning of the crisis, whereas average wages increase by more than 2%.
Figures 2.10 and 2.11 in the appendix show median values of individual wage growth rates over functional area in Germany and Austria. Two main
27