Equal Opportunities
in Science and Research
Fourteenth Update of the Data (2008/2009) on Women in Higher Education Institutions and Non-academic Research Establishments
MATERIALIEN DER GWK
Joint Science Conference (GWK) - Office -
Friedrich-Ebert-Allee 38 53113 Bonn, Germany
Phone: +49(0)228 5402-0 Fax: +49(0)228 5402-150 E-mail: gwk@gwk-bonn.de Internet: www.gwk-bonn.de
ISBN 978-3-942342-04-9 2011
Fourteenth Update of the Data (2008/2009) on Women in Higher Education Institutions and Non-academic Research Establishments
Introduction... 3
Part I... 6
1 Basic Trends... 6
2 Weighted Overview of Current Data... 8
2.1 Initial situation ... 8
2.2 Higher education institutions ... 8
2.2.1 Participation in higher education ... 8
2.2.2 Proportion of doctorates awarded to women ... 9
2.2.3 Proportion of habilitations awarded to women... 10
2.2.4 Proportion of female professors (existing positions) ... 11
2.2.5 Proportion of women in academic appointments 2009 (ongoing) ...12
2.2.6 Proportion of academic leadership positions held by women...13
2.2.7 Proportion of women on university councils and academic supervisory bodies...13
2.3 Non-academic research establishments...15
2.3.1 Proportion of scientific posts held by women ...15
2.3.2 Proportion of women in leadership positions...16
Part II ...17
1 Special Evaluation by CEWS on Equal Opportunities in Non-university Research...17
1.1 Introduction ...17
1.2 Source data...18
1.3 Based on: current situation, development over time, and comparison of sectors (research in higher education institutions, non-academic research establishments, and industry)...19
1.4 Horizontal segregation ... 23
1.5 Vertical segregation... 27
1.6 European and international comparison... 33
1.7 Summary ... 37
1.8 Bibliography ... 38
Part III ... 39
Appendix with Comprehensive Statistics ... 39
Introduction
On 9 July 1998 during the consultation on the second supplement to the Bund-Länder Com- mission for Educational Planning and Research Promotion (BLK) report on "Promotion of Women in Science", the leaders of the federal and the federal states governments requested that in subsequent years the BLK also compile a systematic overview of the statistical data on the proportion of women in leadership positions. The BLK fulfilled this request.
The Joint Science Conference of the Federal and the Federal States (Länder) Governments (GWK), established on 1 January 2008, has now taken over responsibility for updating the data on women in higher education institutions and non-academic research establishments.
This is the fourteenth update of the data on women in higher education institutions and non- academic research establishments.1
1 Previous publications:
- BLK, Materialien zur Bildungsplanung und zur Forschungsförderung, Number 19, 1989: Förderung von Frauen im Bereich der Wissenschaft;
- BLK, Materialien zur Bildungsplanung und zur Forschungsförderung, Number 53, final edition 1996: Förderung von Frauen im Bereich der Wissenschaft - Fortschreibung des Berichts aus dem Jahr 1989;
- BLK, misc. BLK publication, Number 51, 3 July 1997: Erste Ergänzung zum Bericht der Bund-Länder-Kommission für Bildungs- planung und Forschungsförderung "Förderung von Frauen im Bereich der Wissenschaft";
- BLK, Materialien zur Bildungsplanung und zur Forschungsförderung, Number 68, 1998: Frauen in Führungspositionen - Zweite Ergänzung zum BLK-Bericht "Förderung von Frauen im Bereich der Wissenschaft" - Gespräch der BLK über die "Förderung von Frauen im Bereich der Wissenschaft" am 8. Juni 1998;
- BLK, misc. BLK publication, Number 56, 1999: Frauen in Führungspositionen - Dritte Ergänzung zum BLK-Bericht "Förderung von Frauen im Bereich der Wissenschaft";
- BLK, Materialien zur Bildungsplanung und zur Forschungsförderung, Number 87, 2000: Frauen in der Wissenschaft - Entwick- lung und Perspektiven auf dem Weg zur Chancengleichheit including the 4th update to "Frauen in Führungspositionen";
- BLK, misc. BLK publication, Number 63, 2001: Frauen in Führungspositionen - Fünfte Fortschreibung des Datenmaterials;
- BLK, misc. BLK publication, Number 64, 2002: Frauen in Führungspositionen - Sechste Fortschreibung des Datenmaterials;
- BLK, Materialien zur Bildungsplanung und zur Forschungsförderung, Number 109: Frauen in Führungspositionen - Siebte Fort- schreibung des Datenmaterials;
- BLK, Materialien zur Bildungsplanung und zur Forschungsförderung, Number 122: Frauen in Führungspositionen - Achte Fort- schreibung des Datenmaterials 2nd revised edition;
- BLK, Materialien zur Bildungsplanung und zur Forschungsförderung, Number 129: Frauen in Führungspositionen - Neunte Fort- schreibung des Datenmaterials, amended edition;
- BLK, Materialien zur Bildungsplanung und zur Forschungsförderung, Number 136: Frauen in Führungspositionen - Zehnte Fort- schreibung des Datenmaterials;
- BLK, Materialien zur Bildungsplanung und zur Forschungsförderung, Number 139: Chancengleichheit in Wissenschaft und For- schung - Elfte Fortschreibung des Datenmaterials;
- GWK, Materialien der GWK, Number 3: Chancengleichheit in Wissenschaft und Forschung – Zwölfte Fortschreibung des Daten- materials;
- GWK, Materialien der GWK, Number 7: Chancengleichheit in Wissenschaft und Forschung – Dreizehnte Fortschreibung des Datenmaterials;
- GWK, Materialien der GWK, Number 10: Equal Opportunities in Science and Research – 13th Update to the Data.
The first part of this report contains a "weighted overview" of the following data:
- Women at higher education institutions: Overall numbers of first enrolments, final degrees, doctorates, habilitations, and professorships in MINT subjects (subject groups mathemat- ics/natural sciences, engineering) and subject groups languages/humanities, human medi- cine/health sciences, and art/art history. Figures are also given grouped by pay grade, based on figures from the German Federal Statistical Office for 2008.
- Proportion of women in academic appointments (applications, calls to post, appointments) in 2009, based on a GWK survey of the federal states.
- Proportion of women in academic leadership positions in 2009, based on data from the German Rectors' Conference (HRK).
- Proportion of women on university councils and academic supervisory bodies in 2009, ba- sed on information supplied by the Center of Excellence Women and Science (CEWS).
- Proportion of women in non-academic research establishments (proportion of women em- ployed on the scientific staff and proportion of women employed in leadership positions) in 2009, based on a GWK survey of the following research organisations: Fraunhofer Society (FhG), Helmholtz Association of German Research Centers (HGF), Max Planck Society (MPG), Leibniz Association (WGL).
The second part of this report contains a Special Evaluation by CEWS on equal opportunities in non-university research.
The third part of this report is an appendix containing comprehensive statistics. The initial years starting with are summarised with values averaged over five-year blocks.
This publication, "Equal Opportunities in Science and Research", is intended to provide a gen- eral overview. The data from the German Federal Statistical Office and the data derived from the surveys of the federal states provide differentiation down to the subject group level. Further subdivision into individual study/teaching/research areas is not practicable due to the extent of the data.
Since 2002, the general overview presented here has been supplemented by more detailed analysis of selected subject areas.2 The second part of this year's report, the Special Evaluation by CEWS on equal opportunities in non-university research, again explores a key subject area.
The GWK committee adopted this report on 14 September 2010.
2 Previous publications:
- BLK, Materialien zur Bildungsplanung und zur Forschungsförderung, Number 100, BLK report dated 2 May 2002, Bonn, Germa- ny, 2002, ISBN 3-934850-32-4: Frauen in den ingenieur- und naturwissenschaftlichen Studiengängen;
- BLK, Materialien zur Bildungsplanung und zur Forschungsförderung, Number 117, BLK report dated 5 July 2004, Bonn, Germa- ny, 2004, ISBN 3-934850-55-5: Frauen in der Medizin, Ausbildung und berufliche Situation von Medizinerinnen;
- BLK, Materialien zur Bildungsplanung und zur Forschungsförderung, Number 129, Bonn, Germany, 2005, ISBN 3-934850-69-3:
Frauen in Führungspositionen - Neunte Fortschreibung des Datenmaterials, including a supplement containing a special evalua- tion and summary report by CEWS on trends in the participation of female scientists at higher education institutions and non- academic research establishments;
- BLK, Materialien zur Bildungsplanung und zur Forschungsförderung, Number 139, Bonn, Germany, 2007, ISBN 978-3-934850- 86-6: Chancengleichheit in Wissenschaft und Forschung - Elfte Fortschreibung des Datenmaterials (2005/2006), including supplementary special evaluation by CEWS: "Retrospektive Verlaufsanalyse von Karriereverläufen in den Geisteswissenschaf- ten".
- GWK, Materialien der GWK, Number 3, Bonn, Germany, 2008, ISBN 978-3-934850-89-7: Chancengleichheit in Wissenschaft und Forschung - Zwölfte Fortschreibung des Datenmaterials (2006/2007), including supplementary special evaluation by CEWS:
Retrospektive Verlaufsanalyse von Karriereverläufen in der Mathematik und ausgewählten Naturwissenschaften;
- GWK, Materialien der GWK, Number 7, Bonn, Germany, 2009, ISBN 978-3-934850-92-7: Chancengleichheit in Wissenschaft und Forschung – Dreizehnte Fortschreibung des Datenmaterials (2007/2008), including supplementary special evaluation by CEWS: Proportion of Women in the Subjects of Politics, Social Sciences, Economics, and Law Based on Analysis by Subject Area.
Part I 1 Basic Trends
Over the last two decades, the issue of "Equal Opportunities in Science and Research" was sys- tematically championed on an ongoing basis at both federal and state level by the BLK, with the GWK taking on this mantle in 2008. By persistently pursuing this issue, not only have im- provements been seen in the understanding of the status of men and women in research, but it has also been possible in some areas to substantially increase the level of representation of women at various levels of academic qualification, with a particularly positive outcome in terms of the number of women appointed to leadership positions, both at higher education institutions and non-academic research establishments.
In the period considered between 1992 and 2008, the overall proportions of women at higher education institutions have changed as follows:
- First-year students – 45.6% to 49.6%, - Final degrees – 40.8% to 51.8%, - Doctorates – 30.7% to 41.9%, - Habilitations – 13.1% to 23.4% and - Professorships – 7.5% to 17.4%
(See Chart 1).
Chart 1
Proportion of women at HE institutions
49,6 45,6
51,8
,8 41,9
,7
23,4
13,1
17,4
7,5
Average 992-1996
Average 1997-2001
2002 2003 2004 2005 2006 2007 2008
Year 40
30
0,0 5,0 10,0 15,0 20,0 25,0 30,0 35,0 40,0 45,0 50,0 55,0 60,0
1
Percent First-year students
Final degrees Doctorates Habilitations Professorships
The proportion of women in leadership positions at non-academic establishments (FhG, HGF, MPG, WGL) increased from 2% to 11.4% between 1992 and 2009. This proportion is still far lower than that of women at higher education institutions.
Surveys have been carried out since 1997 into the proportion of women obtaining academic appointments. Various trends have been identified over the intervening period. The proportion of women has changed as follows:
- Applications for professorships up from 12.9% to 23.5%, - Calls to post up from 16.9% to 28.4%,
- Appointments up from 15.7% to 29.0%
(See Chart 2).
Chart 2
Proportion of women in academic appointments
12,9
23,5 28,4
16,9
29,0
15,7
0,0 5,0 10,0 15,0 20,0 25,0 30,0 35,0 40,0 45,0 50,0
1997 1998 1999 2000 2001 2002 2003 2004 2005 2006 2007 2008 2009 Year
Percent
Applications for professorship Called to post
Accepted post
In the period from 1996 to 2009, the proportion of academic leadership positions held by women rose from 9.8% to 19.3%, almost doubling their representation.
The scientific and economic potential that female scientists represent has not yet been fully realised, with women still significantly under-represented in high-level positions within the research system. An increase in female representation in the upper echelons of the research system depends on increasing the ratio of women at the lower qualification levels and therefore cannot be achieved as a single dramatic leap. As such, it is essential that special attention con- tinues to be paid to supporting women in research and science, as explicitly stated in the Stan- dards on Gender Equality3 adopted by the DFG.
3 DFG: Forschungsorientierte Gleichstellungsstandards; decision of the general meeting of 2 July 2008.
2 Weighted Overview of Current Data
2.1 INITIAL SITUATION
The political task of implementing suitable measures to bring about equal opportunities for women and men in all aspects of life is mandated by Article 3 of the German constitution.
A wide range of joint activities have been undertaken by the federal and state governments over the last two decades under the auspices of the Bund-Länder Commission for Educational Planning and Research Promotion (BLK), and since 2008 the Joint Science Conference
(GWK), to promote and support the goal of achieving participation in education and science on equal terms for girls and young women. The results seen to date demonstrate a remarkable change in trends in favour of better equality at the various qualification levels in schools, hig- her education, and non-academic research establishments. The GWK considers equal opportu- nities and support for women in science and research to be a cross-disciplinary issue.
2.2 HIGHER EDUCATION INSTITUTIONS 2.2.1 PARTICIPATION IN HIGHER EDUCATION
In 2008 a total of 442,091 school leavers of both sexes met the entrance requirements for high- er education4(cf. Table 1.1.3). Of these, 53.4% (236,262) were women. The total number of students entering higher education (first-year students) was 396,610. Female students made up 49.6% or 196,916 of this number. This means that, as in previous years, the proportion of the total number of first-year students remained below 50%. It should be noted that, while the proportion of female students starting courses in 2008 in engineering was 22.1% and in mathematics and natural sciences 40.5%, the number on languages and humanities courses was 74.5% (cf. Tables 1.4.3, 1.3.3, and 1.2.3).
In 2008, a total of 277,897 students graduated from institutions of higher education5, 143,920 or 51.8% of whom were female.
4 School leavers gaining "Fachhochschulreife" (advanced vocational training at a technical college leading to technical university entrance qualification), "allgemeine Hochschulreife" (secondary school completion leading to university qualification from non- specialist school) or "Fachhochschulreife, fachgebundene Hochschulreife" (certificate of readiness for higher vocational school from a vocational school).
5 Final examinations at higher education institutions, excluding "doctorates", "arts degrees", and "alternative qualifications".
A total 167,315 students earned final degrees at universities and equivalent institutions of high- er education6, 95,065 or 56.8% of whom were female (cf. Table 1.1.3).
In the MINT subjects7, the proportion of females among graduating students was 31.8%, of whom 23.0% studied engineering and 40.6% mathematics/natural sciences (cf. Tables 1.3.3, 1.4.3 and 1.6). In the languages and humanities subject group, the proportion of women gradu- ates was 77.0%. The proportion of women earning degrees in the subject groups engineering and languages/humanities was higher than the proportion of women who enrolled on the same courses (22.1% and 74.5% respectively, cf. Tables 1.4.3 and 1.2.3).
Comparing the number and distribution of final degrees in 2008 to the number of first-year students in previous years, it is clear that the ratio between the proportion of women complet- ing degrees and the proportion of women enrolling on courses has remained almost unchanged in these qualification phases since 2003.
2.2.2 PROPORTION OF DOCTORATES AWARDED TO WOMEN
In 2008 in Germany, 25,190 people were awarded doctorates, 10,558 of whom were women.
This corresponds to a proportion of 41.9%. Discounting some minor fluctuations, this repre- sents a continuous increase in the number of women awarded doctorates. Following an in- crease in the overall number of doctorates by 2,814 in 2005 over the figure for 2004, the total fell slightly in 2006 and 2007 and rose again by 1,347 in 2008 (cf. Table 2.1). The number of women awarded doctorates fell slightly by 0.3 percentage points from 42.2% in 2007 to 41.9%
in 2008.
Compared to the other subject groups, the proportion of women gaining doctorates in the en- gineering subject group in 2008 is the lowest at 14.3%. It is also worth noting that this propor- tion is substantially lower than the proportion of women earning final degrees (23.0%, cf. Ta- ble 1.4.3). In mathematics/natural sciences, the proportion of women being conferred doctor- ates has risen steadily since 1992, reaching 37.4% in 2008. Women are the recipients of over 50% of the doctorates awarded in veterinary medicine (81.3%), art/art history (62.5%), lan- guages and humanities (53.6%), and human medicine/health sciences (53.5%) (cf. Table 2.2).
6 Final examinations at higher education institutions that have been granted the right to confer doctorates, excluding "Fach- hochschule (university of applied sciences) degrees", "doctorates", "arts degrees", and "alternative qualifications".
7 MINT = mathematics, IT, natural sciences, technology. This corresponds to the subject groups mathematics, natural sciences, and engineering in the subject system of the German Federal Statistical Office.
For additional information on the situation for women studying natural sciences and technical subjects, the reader is also referred to the situation assessment in the 2002 BLK report "Frauen in den ingenieur- und naturwissenschaftlichen Studiengängen"8, which also includes conclu- sions and a description of actions required, and the Special Evaluation by CEWS on career pro- gression for students of selected natural science and mathematics subjects. The current figures presented here show that the measures provided jointly by the federal and state governments have had the intended effect and led to clearly identifiable improvements.
2.2.3 PROPORTION OF HABILITATIONS AWARDED TO WOMEN
In 2008 in Germany, a total 1,800 people were awarded the habilitation qualification, (2007:
1,881, 2006: 1,993, 2005: 2,001), 422 of whom were women (2007: 457, 2006: 442, 2005:
460). Despite the introduction of the junior professorship, the proportion gaining the habilita- tion qualification has remained almost the same, with slight fluctuations. Of the total number awarded the habilitation, women made up 23.4% (2007: 24.3%, 2006: 22.2%, 2005: 23.0%) (cf. Table 3.1).
Across the subject groups, the figures for female participation have a similar distribution to those for doctorates, albeit in lower numbers (the significance of the results is limited due to the small sample size).
- The individual percentages in 2008 were as follows: Human medicine/health sciences 21.9% (178 of a total 811 habilitations), art/art history 46.2% (12 of a total 26 habilitations), languages/humanities 34.7% (119 of a total 343 habilitations) (cf. Table 3.2).
- The proportion of women gaining habilitations in the engineering subject group in 2008 was 18.3% (13 of a total 71 habilitations), which is 2.9% lower than the previous year (cf.
Table 3.2).
- The proportion of women in the mathematics/natural sciences subject group in 2008 was 14.5%, or 48 of a total 330 habilitations, which represents a fall on the previous year of 2.0 percentage points (cf. Table 3.2).
- In the MINT subjects, the number of women awarded habilitations in 2008 amounted to 61 of a total 401, or 15.2% (cf. Table 1.6).
8 - BLK, Materialien zur Bildungsplanung und zur Forschungsförderung, Number 100, BLK report dated 2 May 2002, Bonn, Ger- many, 2002, ISBN 3-934850-32-4: Frauen in den ingenieur- und naturwissenschaftlichen Studiengängen;
- GWK, Materialien der GWK, Number 3, Bonn, Germany, 2008, ISBN 978-3-934850-89-7: Chancengleichheit in Wissenschaft und Forschung - Zwölfte Fortschreibung des Datenmaterials (2006/2007), including supplementary special evaluation by CEWS:
Retrospektive Verlaufsanalyse von Karriereverläufen in der Mathematik und ausgewählten Naturwissenschaften.
2.2.4 PROPORTION OF FEMALE PROFESSORS (EXISTING POSITIONS)
Taking all pay grades into account, in 1992 a total of 2,246 of the 34,702 professorships at German higher education institutions were held by women, corresponding to 6.5% of the total.
Since that time it has been possible to increase the figure steadily, such that by 2008 the num- ber of professorships held by women was 6,725 of the total 38,564, which corresponds to 17.4%
(cf. Table 4.1.2). During the period under review, the proportion of women holding professor- ships more than doubled, while the average total number of professorships remained un- changed and the total number of professorships held by men fell by around 2,000 in the same period.
The picture for C4/W3 grade professors (professor ordinarius) is similar, with the number of C4/W3 professorships rising slightly from a total of 12,067 in 1992 to 12,868 in 2008. The number of male professors fell slightly in the period studied (1992: 11,609; 2008: 11,162), whereas the number of female professors rose in the same period from 458 (3.8%) in 1992 to 1,706 (13.3%) in 2008 (cf. Tables 4.1.2 and 4.1.3).
In the field of languages and humanities, the overall number of professorships in 2008 was 5,587, the proportion of women being 30.8% (cf. Table 4.1.5). The number of female C4/W3 professors rose to 23.9%.
Other subject areas, human medicine/health sciences for example, also saw a significant in- crease in not only the overall proportion of women holding professorships, particularly at C4/W3 level, but more significantly a rise in the absolute number of female professors, with women again gaining representation particularly among the C4/W3 professors (cf. Charts 4.1.8 to 4.1.12 for other subject groups).
There were only minor differences in the overall proportion of women holding professorships (C2 to C4 and W1 to W3) at the different types of higher education institutions in 2008. At uni- versities and colleges of art the percentage was 17.7%, at universities of applied sciences (ex- cluding public administration colleges) 17.0%, and at public administration colleges 18.8%.
The proportion of professorships held by women rose again in 2008 (cf. Tables 4.1.2 and 4.2.6).
Differentiating the figures according to pay grade once again revealed significant disparity: The higher the pay grade, the lower the proportion of women. Taking all types of higher education institution together, in 2008 the proportion of women was 35.6% for W1 (junior) professors, 21.1% for C2 (assistant) professors (total for tenured plus fixed term), 18.1% for C3/W2 (asso- ciate) professors, and 13.3% for C4/W3 (full) professors (cf. Table 4.1.2).
Within the individual pay grades, significant differences between the various types of higher education institutions were also clearly identifiable in 2008:
- At universities and art colleges in 2008, the proportion of women was 23.8% for C2 profes- sors (total for tenured plus fixed term), 21.1% for C3/W2 professors, and 13.3% for C4/W3 professors. Women held 35.4% of all W1 professorships (junior professor).
- At universities of applied sciences (excluding public administration colleges), the propor- tion of women in 2008 was 19.7% for C2 professors (total for tenured plus fixed term), which is a common pay grade at universities of applied sciences, 15.7% for C3/W2 profes- sors, and 11.6% for C4/W3 professors.
- At public administration colleges, the proportion of women in 2008 was 28.1% for C2 pro- fessors (total for tenured plus fixed term), which is also a common pay grade at public ad- ministration colleges, and 13.6% for C3/W2 professors.
Looking at the universities, art colleges, and universities of applied sciences (excluding public administration colleges), it can be seen that at all three pay grades the proportion of women again rose compared to the preceding year in practically all areas. This does not, however, cor- respond to a level of representation commensurate with either the proportion of women in the general population or in the student body.
2.2.5 PROPORTION OF WOMEN IN ACADEMIC APPOINTMENTS 2009 (ONGOING) Starting in 1997, the BLK (and now the GWK) has conducted an annual survey of the federal states to gather information about applications, shortlisted candidates, successful candi- dates/calls to post, and appointments to professorships at higher education institutions.
The 2009 survey demonstrates a slight increase in the proportion of women compared to the previous year.
In 2009 in Germany, a total of 81,529 people applied for a professorship, 19,140 of whom were women. This is equivalent to an average of 23.5% of applications, with applications to each pay grade as follows: W1 (junior) professors 31.5%; W2 professors 24.2%; W3 professors 21.9% (cf.
Table 5.1.3). Out of a total of 8,740 shortlisted candidates, 2,306 were women, which amounts to a proportion of 26.4%. 1,062 out of the total of 3,746 calls to post were awarded to women, corresponding to a proportion of 28.4%. Out of a total of 1,994 appointments, 578 went to wo- men in the year under review, which equates to 29.0% (cf. Table 5.1.1). It is clear from this that women are certainly underrepresented in terms of number of applications, but that their suc- cess rate is higher than that of men. A similar trend was also observed in earlier years.
At the various types of higher education institutions, the picture is as follows (cf. Table 5.1.2):
- A total of 12,490 women applied for professorships in 2009 at universities and equivalent institutions of higher education (excluding art and music colleges), corresponding to female representation of 23.1%. Out of a total of 6,101 shortlisted candidates, 1,623 were women
(26.6%); out of a total of 2,630 calls to post, 760 women were called (28.9%); out of a total of 1,237 appointments, 352 went to women (28.5%).
- At universities of applied sciences, 4,312 women (21.2%) applied for a professorship in 2009; out of a total of 2,230 shortlisted candidates, 540 were women (24.2%); out of a total of 963 calls to post, 251 women were called (26.1%); out of a total of 654 appointments, 192 went to women (29.4%) in 2009.
- At art and music colleges, 2,338 women (32.7%) applied for a professorship in 2009; out of a total of 409 shortlisted candidates, 143 were women (35.0%); out of a total of 153 calls to post, 51 women were called (33.3%); out of a total of 103 appointments, 34 went to women (33.0%) in 2009.
2.2.6 PROPORTION OF ACADEMIC LEADERSHIP POSITIONS HELD BY WOMEN Women were employed in 19.3% of academic leadership positions in 2009.9 During the years 1996-2000, the average level was still below 10%.
Academic leadership positions held by women in 2009 were distributed thus:
- 40 rectors/presidents, corresponding to 11.3%
- 2 founding rectors, founding commissioners, corresponding to 25.0%
- 156 prorectors/vice presidents, corresponding to 22.1%
- 70 chancellors, corresponding to 21.9% (cf. Table 6.1.).
The absolute number of academic leadership positions held by women rose 2.2% compared with the previous year, from 262 to 268; the proportion of women in academic leadership posi- tions has hardly changed, however, with a slight rise from 19.2% to 19.3%.
2.2.7 PROPORTION OF WOMEN ON UNIVERSITY COUNCILS AND ACADEMIC SUPER- VISORY BODIES
Since the end of the 1990s, all of the federal states, with the exception of Bremen, have estab- lished university councils10. Brandenburg has the Landeshochschulrat (state university coun- cil) and in Schleswig-Holstein the universities of Flensburg, Kiel, and Lübeck have formed a joint university council.
Speaking in 1999, then president of the HRK Klaus Landfried defined the role of the university councils thus: "to foster community involvement in fundamental issues relating to science and the way academic institutions are run, through the work of dedicated experts. They promote
9 Figure based on an announcement by the HRK of 31 December 2009
10 The terminology used varies between the federal states. The term "curatorium" is also used, while the Baden-Württemberg higher education act makes provision for a supervisory council ("Aufsichtsrat"). In the following text the generic term "university council" is used to refer to all the above.
dialog with the wider community and underpin the new organisational and leadership struc- tures in higher education."11 While the university councils at first worked in a primarily advi- sory capacity, the expert functions they have developed over the intervening years now range from strategic management of higher education institutions, through approving all regulations, to serving as the body responsible for establishment and closing of faculties, departments, and institutes. In six states, namely Baden-Württemberg, Bavaria, Hamburg, Lower Saxony (in the case of foundation universities), North Rhine-Westphalia, and Thuringia, the university coun- cil selects the management bodies of the higher education institutions; in Hesse, Lower Saxony (for non-foundation universities), Saarland, and Saxony, the university council plays a con- tributory role in the selection process, mainly by creating a list of candidates. The overall re- sponsibilities of the university councils in the individual states vary very widely.
Since 2003, the Center of Excellence Women and Science (CEWS) has conducted surveys to obtain gender-specific data on the membership of university councils. The surveys take the form of questionnaires mailed to the academic management teams of universities included on the HRK higher education list with a cut-off date of 31 December each year. The average re- sponse rate was 90% of academic institutions, qualifying this as a comprehensive survey.
The following higher education acts include regulations governing the proportion of women on university councils:
The Landeshochschulrat for the state of Brandenburg requires that a minimum one-third of members are female.
In Lower Saxony, university councils/foundation boards must have at least three women among the seven members.
Saarland requires that at least two of seven members of a university council are female.
University councils at universities in Schleswig-Holstein must include at least four women among the nine members.
The following studies also offer comparisons on the memberships of university councils:
Bogumil, Jörg/Rolf G. Heinze, et al. (2007): Hochschulräte als neues Steuerungsinstrument?
Eine empirische Analyse der Mitglieder und Aufgabenbereiche. Final report of the short study, Hamburg, Germany (URL: http://www.boeckler.de/pdf_fof/S-2007-981-5-1).
Nienhüser, Werner/Anna Katharina Jacob (2008): Changing of the Guards – Eine empirische Analyse der Sozialstruktur von Hochschulräten. In: Hochschulmanagement (3), pp.
67-73, URL: http://www.uni-
due.de/personal/Download/hsr/Hochschulrat_Zeitschrift_Hochschulmanagem ent_Nienhueser_Jacaob.pdf.
11 Klaus Landfried, speaking at the 2nd Berlin Dialog on Education hosted by the HRK and the Veranstaltungsforum of the Publish- ing Group Georg von Holtzbrinck, on the subject of "Hochschulräte als moderne Steuerungsinstrumente in den Hochschulen"
("University Councils as a Modern Management Instrument in Higher Education"), 21 September 1999, HRK press release (http://www.hrk.de/de/presse/95_942.php).
The study by Bogumil et al indicates a female proportion of 22%, giving a similar result to ex- isting surveys. No gender-specific data is presented in the Nienhüser and Jacob study.
The data from the full-coverage survey by CEWS shows the proportion of women on university councils to have risen by just under 3 percentage points since the first survey, putting the Ger- man average at 23%. There are large variations between the various federal states however:
The figures reported on the survey date of 31 December 2009 range from 11% to 42%, with two states achieving a proportion of over 40% women on their university councils (Bremen, Lower Saxony).
2.3 NON-ACADEMIC RESEARCH ESTABLISHMENTS
2.3.1 PROPORTION OF SCIENTIFIC POSTS HELD BY WOMEN
The overall proportion of women employed on the scientific staff12 at non-academic research establishments was 32.4% in 2009. The WGL and the MPG had an above average proportion of women with 43.0% and 35.8% respectively, whereas the HGF and FhG came in below the aver- age with 28.2% and 17.7% respectively (cf. Tables 9.2.1-9.2.5).
Generally speaking, the proportion of women decreases as the level of qualification increases:
Women are represented as follows:
- 3,871 doctoral students, corresponding to 44.6%, - 1,479 post-doctoral students, corresponding to 37.5%,
- 4,102 of employees at pay grades E12 and E13 on the German civil service pay scale (TVöD), corresponding to 33.9%,
- 2,014 of employees at pay grade E14 on the German civil service pay scale (TVöD), cor- responding to 20.3%,
- 307 of employees at pay grade E15 on the German civil service pay scale (TVöD), corre- sponding to 11.2%.
The proportion of positions held by women above these levels varies considerably, with women holding 6.0% of E15 ÜTVöD or ATB, B2/B3 including S positions, 29.4% of W2 including S positions, 9.2% of C3/C2 including S positions, 9.6% of W3 including S positions, and 4.0% of C4 including S positions (cf. Table 9.2.5, overall).
The combined proportion of scientific and non-scientific staff who are women (from executive management down to student assistants) in 2009 was 32.8% (cf. Table 9.2.5). For the WGL, the proportion of women was 43.3%, which represents an increase of 4.8 percentage points
12 Here we consider only the publicly funded areas of the non-academic research establishments and exclude third-party and externally-funded personnel.
compared with 2008; for the MPG, this figure was 35.7%, for the HGF 29.0%, and for the FhG 20.1% (cf. Tables 9.2.1 – 9.2.4).
2.3.2 PROPORTION OF WOMEN IN LEADERSHIP POSITIONS
In this report it is assumed that employees holding positions in salary group E15 Ü or non-pay- scale employees above salary group E15, as well as salary categories C, W, and B or employees with equivalent contracts of employment, all hold leadership positions in either scientific or administrative parts of the organisation.
As per this definition, the proportion of female employees with leadership positions in scien- tific roles at non-academic research establishments has now risen from a total of 2.0% in 1992 to 11.4% in 2009 (2008=9.9%, 2007=8.4%, 2006=7.9%, 2005=7.0%, 2004=6.6%).
The Max Planck Society (MPG) was again above the average, with 19.0% of leadership posi- tions held by women in 2009. The Leibniz Association (WGL) and the Hermann von Helm- holtz Association of German Research Centers (HGF) had lower than average proportions of women with 11.4% and 7.7% respectively, while the figure for the Fraunhofer Society (FhG) was particularly low, remaining at a mere 2.4% (cf. Table 7.2).
Among the non-scientific staff (administration, technical, other), the proportion was 15.5% in 2009.
The combined proportion of women employed in leadership positions in both scientific and non-scientific areas was 11.8% in 2009 (cf. Table 9.2.5).
1 Special Evaluation by CEWS on Equal Opportunities in Non-university
Research
Part II
1.1 INTRODUCTION
The situation for female scientists at non-academic research establishments has been the focus of analysis and discussions ever since the federal government and federal states first began to work together to promote equal opportunities in science. An initial milestone to establish insti- tutional forms of gender equality policy within the research establishments was the "Aus- führungsvereinbarung zur Rahmenvereinbarung Forschungsförderung über die Gleichstellung von Frauen und Männern bei der gemeinsamen Forschungsförderung" (Implementation Agreement on the Framework Agreement on the Promotion of Research concerning Equal Op- portunities for Women and Men with respect to Joint Research Funding) concluded by the federal government and federal states in October 2003. The Implementation Agreement im- plemented the Equal Opportunities Act13 ruling stipulating that organisations which are insti- tutionally supported by federal funds must also comply with the Equal Opportunities Act (§3).
In the period that followed, the research organisations signed individual agreements to imple- ment these legal requirements.
In the "Offensive for Equal Opportunities", the major scientific organisations – German Re- search Foundation, Fraunhofer Society, Helmholtz Association of German Research Centers, German Rectors' Conference, Max Planck Society, Leibniz Association, and German Science Council – agreed in 2006 to "significantly increase the proportion of women holding senior scientific positions over the coming five years". As part of this offensive, the organisations pub- lished individual explanations in which they outlined their specific challenges and goals. The organisations also agreed to "perform an evaluation of the gender-equality successes achieved within their establishments in five years' time". 14
To fulfil this objective, this Special Evaluation aims to gather data on the equal opportunities situation for women and men at non-academic research establishments in order to investigate whether the goals laid down in the Implementation Agreement and the Offensive for Equal Opportunities have been met. The available data has been compiled and analyzed as follows:
13 Gesetz zur Gleichstellung von Frauen und Männern in der Bundesverwaltung und in den Gerichten des Bundes (Law on Equa- lity for Women and Men in the Federal Administration and Federal Courts) of 30 November 2001 (BGBl. I S. 3234)
14 German Science Council, press release of 29 November 2006, URL:
http://www.wissenschaftsrat.de/download/Aktuelles_Presse/pm_3606.pdf.
Temporal comparison
Comparison with higher education institutions and industrial research
Comparison between the research organisations
Comparison with the rest of Europe and with selected international research establishments
1.2 SOURCE DATA
The statistical analysis is primarily based on data published in the "Equal Opportunities in Sci- ence and Research" reports by the Joint Science Conference (GWK) since 1997 (and up until 2007 by the Bund-Länder Commission for Educational Planning and Research Promotion (BLK)).15 The data source is a survey of the research establishments conducted by the GWK (or BLK). The reports have been published annually since 1998. Time series are available for the years 1992-2009 (with some inconsistencies, however).
Data on higher education statistics from the German Federal Statistical Office and the Wissen- schaftsstatistik des Stifterverbandes für die Deutsche Wissenschaft is also used, along with international comparative data from Eurostat and the She Figures (European Commission 2009: 185).
The inconsistencies in the time series are as follows:
Because the term "women in leadership positions" is not precisely defined, the questionnaire was revised in 2004 with differentiation according to position and salary group. Differentiating between academic and technical/administrative personnel was difficult, however (BLK 2006:
10). The FhG in particular is unable to provide data differentiated in this way.
This has resulted in some inconsistencies, particularly in the "Management" category. At the MPG, the institute management has been classified in pay grade "S (C4)" since 1999. The gath- ering of separate data for scientific and administrative management since 2004 has led to dif- ferent interpretations and supplied data, limiting the possibilities for direct comparison with previous years.
Overall, the following data is available for non-academic research establishments:
Leadership positions at non-academic research establishments classified according to gen- der, pay grade, and research organisation, 1992-2009 (data source: GWK/BLK),
15 Up until 2006, the reports were published under the title "Frauen in Führungspositionen an Hochschulen und außerhochschu- lischen Forschungseinrichtungen" (Women in leadership positions at higher education institutions and non-academic research establishments).
Scientific personnel at non-academic research establishments classified according to gen- der, pay grade, and research organisation, 1999-2009 (data source: GWK/BLK),
Newly filled leadership positions at non-academic research establishments classified ac- cording to gender, pay grade, length of contract, and research organisation, 1999-2009 (data source: GWK/BLK),
Researchers at non-academic research establishments, classified according to gender and subject group, 1998, 1999, 2003-2007 (data source: Eurostat).
The data for women in HGF supervisory bodies was not evaluated.
1.3 BASED ON: CURRENT SITUATION, DEVELOPMENT OVER TIME, AND COMPARI- SON OF SECTORS (RESEARCH IN HIGHER EDUCATION INSTITUTIONS, NON- ACADEMIC RESEARCH ESTABLISHMENTS, AND INDUSTRY)
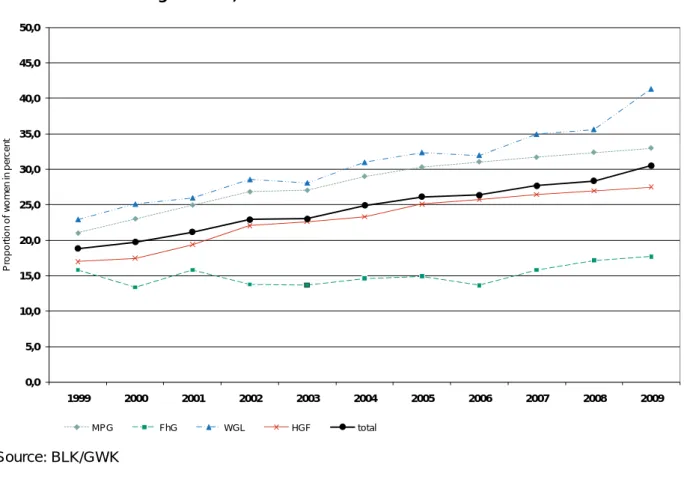
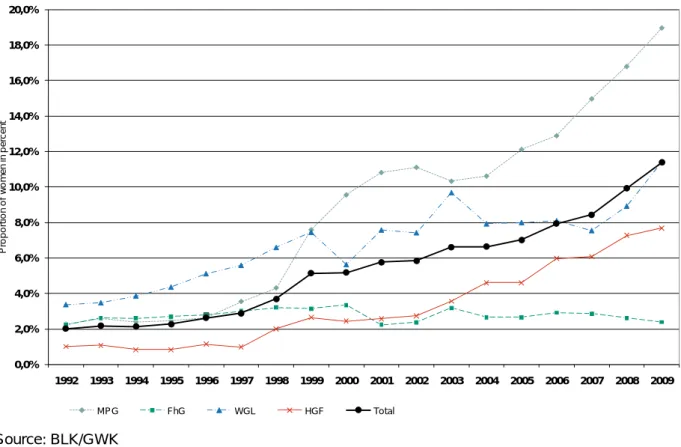
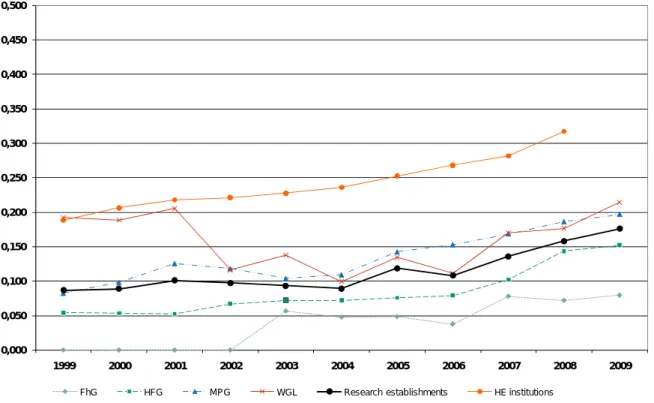
In 2009, 31.6% of the scientific personnel16 at non-academic research establishments were women. In 1999, this figure was 18.8%, which means the proportion of women has risen by almost 12 percentage points in ten years, i.e., by over one percentage point a year on average (cf. Figure 1).
Figure 1 Proportion of women on scientific staff (excluding student assistants) according to research organisation, 1999-2009
0,0 5,0 10,0 15,0 20,0 25,0 30,0 35,0 40,0 45,0 50,0
1999 2000 2001 2002 2003 2004 2005 2006 2007 2008 2009
Proportion of women in percent
MPG FhG WGL HGF total
Source: BLK/GWK
16 Excluding student assistants.
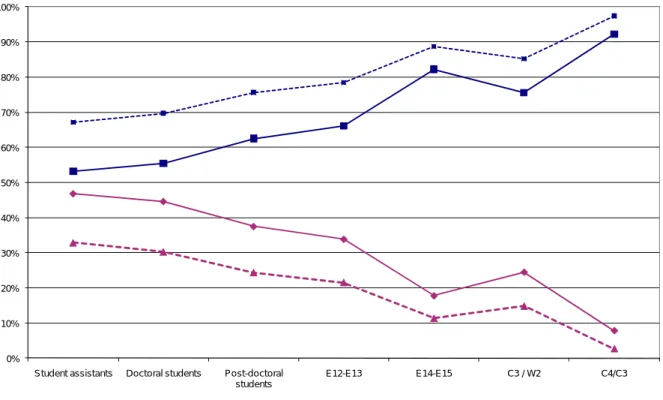
Despite this increase, the proportion of women drops as the qualification level becomes more senior, and the potential of female student assistants and doctoral students is not being har- nessed at research establishments. Compared to 1999, the gap between men and women in terms of their respective progress to higher qualification levels has closed somewhat. Figure 2, however, clearly shows that the proportion of female student assistants, doctoral students, and postdoctoral students has risen more than the proportion of women in leadership posi- tions. Particularly for scientific staff in management roles who mostly hold salaried, permanent posts (E14 and E15) and for C4/W3 professors, the proportion of women in 2009 rose less than in the case of, for example, doctoral and post-doctoral students.
Figure 2 Proportion of women and men on the scientific staff of research establishments, 2009 and 1999
0%
10%
20%
30%
40%
50%
60%
70%
80%
90%
100%
Student assistants Doctoral students Post-doctoral students
E12-E13 E14-E15 C3 / W2 C4/C3
Women 2009 Men 2009 Women 1999 Men 1999
Source: BLK/GWK
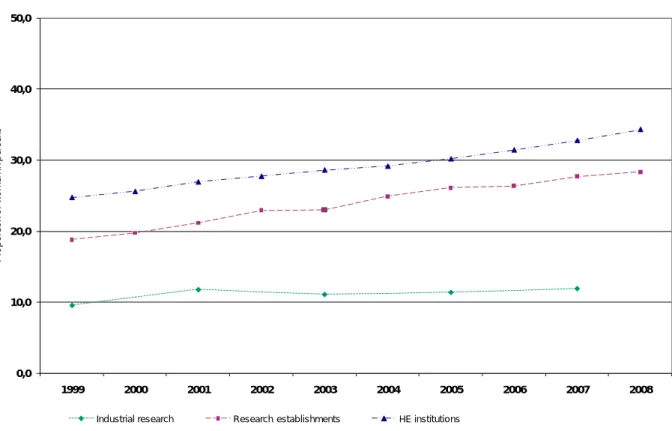
Figure 3 Proportion of women on the scientific staff by sector17, 1999-2008
0,0 10,0 20,0 30,0 40,0 50,0
1999 2000 2001 2002 2003 2004 2005 2006 2007 2008
Proportion of women in percent
Industrial research Research establishments HE institutions
Sources: German Federal Statistical Office, BLK/GWK, Wissenschaftsstatistik
The proportion of full-time female scientific and artistic staff at higher education institutions – almost 35% (2008) – is much higher than at research establishments. Similarly, the proportion of women on the scientific staff of higher education institutions and research establishments increased by nearly 10 percentage points from 1999 to 200818 (cf. Figure 3). In industrial re- search, however, the proportion of women is much lower, at 12% (2007).19 Furthermore, this sector has only seen minimal increases since 1999, when the proportion of female scientists in industrial research was 9%.
The differences between the proportion of women in higher education institutions, non- academic research establishments, and industrial research are also connected to gender- specific subject choices and horizontal segregation20. At higher education institutions in 2008, 23% of the scientific staff were employed in the mathematics and natural sciences subject
17 In the research statistics, a distinction is drawn between the higher education sector, the state sector, and the business sector.
When research establishments are referred to below, this should always be understood to mean non-academic research estab- lishments and/or the state sector. The data for the business sector (industrial research) is compiled every 2 years.
18 The higher education statistics for 2009 are not currently available (July 2010).
19 Statistics on research and development in companies (industrial research) are compiled every 2 years by the Wissenschaftssta- tistik des Stifterverbandes für die deutsche Wissenschaft. Data for 2009 is not yet available.
20 Horizontal segregation means distribution of the genders across occupation, activity, or academic subject.
group and 15% in engineering, i.e., a total of 38% within the MINT field21. In the research es- tablishments, on the other hand, two thirds of the scientific personnel were employed in a natural science or technical field. Industrial research is almost entirely dominated by natural sciences and engineering. In engineering, the proportion of female doctoral candidates is cur- rently 14% (2008), while for mathematics and natural sciences this figure is 37%. The reason why the proportion of women on the scientific staff of research establishments is lower overall than that of higher education institutions is because the former are dominated by natural sci- ence and technical subject areas, which are more rarely chosen by women.
Although the proportion of women on the scientific staff of the non-academic research insti- tutes has increased overall, the reason for this average value is the different situations and de- velopment in the individual research organisations (cf. Figure 1, p. 19). The organisation with the highest proportion of women (over 40%) and the greatest increase since 1999 (18 percent- age points) is the Leibniz Association (WGL). At the Max Planck Society and the Helmholtz Association of German Research Centers, the average increase is 12 and 11 percentage points respectively. At the Fraunhofer Society, on the other hand, the proportion of women on the scientific staff has remained more or less constant from 1999 to 2009, with the proportion of women increasing from 16% to 18%.
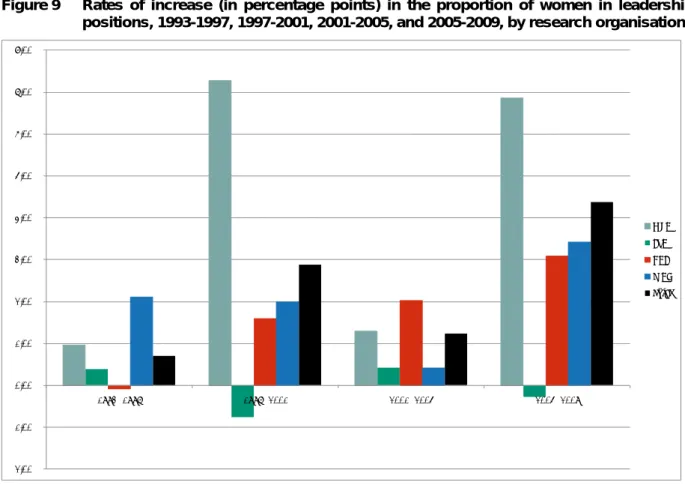
In the "Offensive for Equal Opportunities", the research organisations agreed to significantly increase the proportion of women. Concrete targets were not specified in the agreement. In 2008, the MPG concretised the agreements in the "Offensive" by pledging to increase the pro- portion of women scientists in leadership positions (W2/W3) and salaried scientists (pay grade 13 to 15 Ü in the German civil service pay scale (TVöD)) by 5 percentage points overall between 2005 and 2010.22 This is the target set for all research organisations in the current evaluation, in line with developments at higher education institutions and with the higher education rank- ing according to gender equality aspects (Löther 2009).
21 MINT = mathematics, IT, natural sciences, technology. This corresponds to the subject groups mathematics, natural sciences, and engineering in the subject system of the German Federal Statistical Office.
22 "Gleichstellung von Frauen und Männern in der Max-Planck-Gesellschaft" society-wide agreement (April 2008), URL:
http://www.mpikg.mpg.de/gba/front/pdf/RS/2008-48-Gleichstellungsgrundsaetze.pdf.
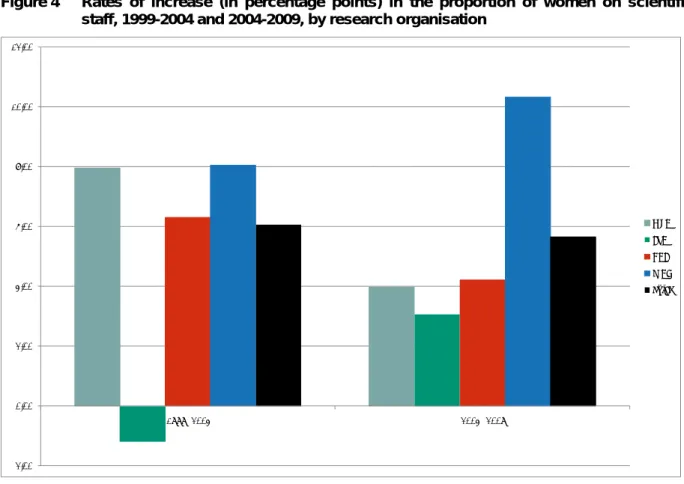
Figure 4 Rates of increase (in percentage points) in the proportion of women on scientific staff, 1999-2004 and 2004-2009, by research organisation
‐2,00 0,00 2,00 4,00 6,00 8,00 10,00 12,00
1999 ‐2004 2004 ‐2009
MPG FhG HGF WGL Total
In the five years from 2004 to 2009, only the Leibniz Association significantly increased the proportion of women on its scientific staff with a rise of over 10 percentage points. At the MPG and the HGF, the increase was 4 percentage points, and at the FhG it was even lower. It is no- table that prior to this, from 1999 to 2004, the proportion of women on the scientific staff of the Helmholtz Association and the Max Planck Society grew much more. At the Fraunhofer Society, on the other hand, the proportion of women on the scientific staff actually fell between 1999 and 2004, reaching an all-time low of 13.6% in 2006. Thanks to the above-average growth at the WGL, the research establishments as a whole achieved an increase of 5.7 percentage points. This is as high as the increase in the proportion of female scientific staff at higher edu- cation institutions between 2003 and 2008, and can indeed be described as a definite increase, with an annual rise of over one percentage point.
1.4 HORIZONTAL SEGREGATION
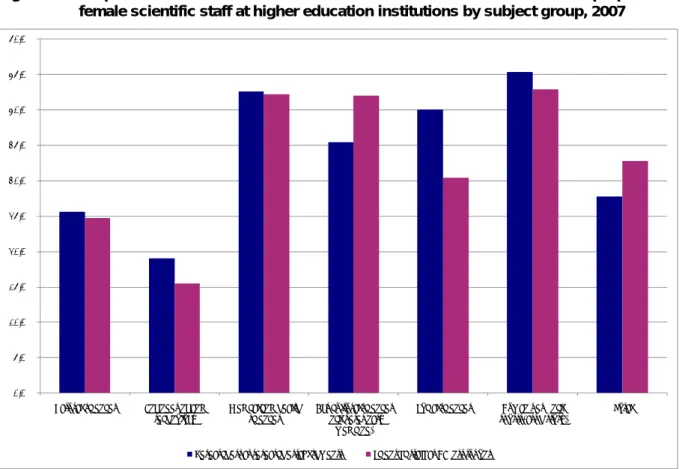
As shown above (cf. p. 21), gender-specific choice of subjects is one of the reasons why the pro- portion of women on the scientific staff of research establishments is lower overall than that of higher education institutions. However, the proportion of women on the scientific staff of re- search establishments (2007) in the natural sciences subject group is just as high as in higher education. In the field of engineering, the proportion of women at research establishments (19%) is greater than at higher education institutions (15.5%, cf. Figure 5).
Figure 5 Proportion of women researchers at research establishments23 and proportion of female scientific staff at higher education institutions by subject group, 2007
0,0%
5,0%
10,0%
15,0%
20,0%
25,0%
30,0%
35,0%
40,0%
45,0%
50,0%
Natural sciences Engineering and technology
Medical and health sciences
Agricultural sciences (incl. veterinary
medicine)
Social sciences Humanities (incl.
sports, art history)
Total
Researchers at research establishments Scientific staff at HE institutions
Source: Eurostat; German Federal Statistical Office
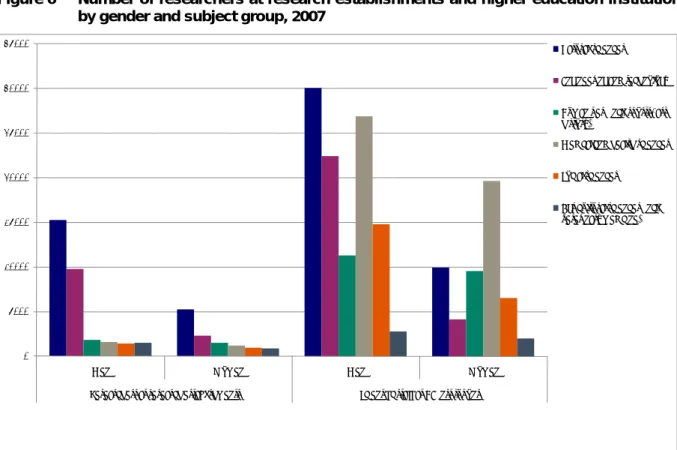
Most scientists at research establishments work in the fields of natural sciences (around 5,000 women and 15,000 men) and engineering (around 2,000 women and 10,000 men). In the higher education sector too, most scientists work in the field of natural sciences (around 30,000 men), while the largest proportion of the female scientific staff at higher education in- stitutions (nearly 20,000 women) work in the medicine and health sciences subject group (cf.
Figure 6). What is particularly striking here is the fact that at higher education institutions, 4,000 female scientists are employed in the field of engineering, which does not amount to even twice as many as the number employed in this field at research establishments, despite the fact that higher education institutions employ almost five times more female scientists overall than research establishments.
23 The data, which is classified according to subject group, comes from the Eurostat database and relates to researchers in re- search establishments. Researchers "are professionals engaged in the conception or creation of new knowledge, products, proc- esses, methods, and systems and also in the management of the projects concerned". OECD 2002
Figure 6 Number of researchers at research establishments and higher education institutions by gender and subject group, 2007
0 5000 10000 15000 20000 25000 30000 35000
Men Women Men Women
Researchers at research establishments Scientific staff at HE institutions
Natural sciences
Engineering and technology
Humanities (incl. sports, art history)
Medical and health sciences
Social sciences
Agricultural sciences (incl.
veterinary medicine)
Source: Eurostat; German Federal Statistical Office
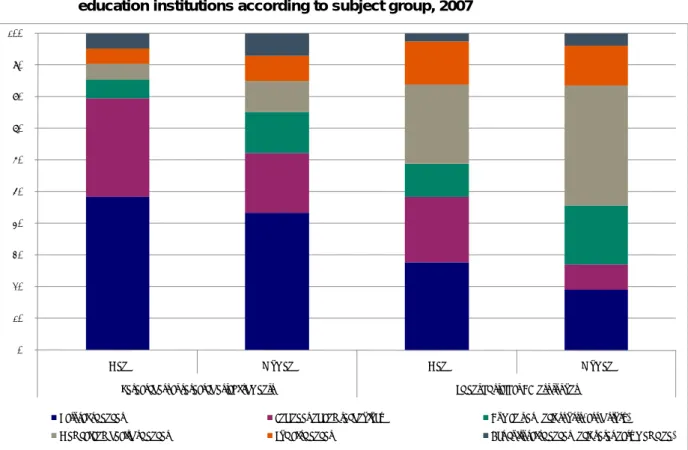
For female scientists at research establishments, therefore, the distribution across individual subjects is different from that of their colleagues in the higher education sector (cf. Figure 7).
Within the research establishments, there is horizontal segregation between male and female scientists. Almost 80% of male scientists at research establishments and 62% of female scien- tists are employed in a natural science/technical (MINT) field (2007). In terms of the figures for the natural sciences, the proportions of women and men do not differ greatly, with female scientists numbering 44% and male scientists 49% in this subject group at research establish- ments. The proportions diverge chiefly in the field of engineering, which employs 31% of the male scientists, but only 19% of the women. In the social sciences and humanities, female sci- entists at research establishments are more strongly represented than their male colleagues (21% women and 11% men).
While nearly two thirds of female scientists work in the fields of natural sciences and engineer- ing at the research establishments, only a quarter of the female scientific staff work in these fields at higher education institutions (cf. Figure 7). Only 7% of female scientists at higher education institutions work in engineering. In higher education, more female scientists work in the fields of medicine and health sciences (34%) than in the natural-science and technical sub- jects combined, with the humanities (20%) and social sciences (11%) together also representing a larger group.