In-plane tunneling anisotropic magnetoresistance in (Ga,Mn)As/GaAs Esaki diodes in the regime of the excess current
J. Shiogai, M. Ciorga, M. Utz, D. Schuh, M. Kohda, D. Bougeard, T. Nojima, D. Weiss, and J. Nitta
Citation: Applied Physics Letters 106, 262402 (2015); doi: 10.1063/1.4923309 View online: http://dx.doi.org/10.1063/1.4923309
View Table of Contents: http://scitation.aip.org/content/aip/journal/apl/106/26?ver=pdfcov Published by the AIP Publishing
Articles you may be interested in
Impact of current paths on measurement of tunneling magnetoresistance and spin torque critical current densities in GaMnAs-based magnetic tunnel junctions
J. Appl. Phys. 113, 083702 (2013); 10.1063/1.4793086
Anisotropic magneto-resistance in a GaMnAs-based single impurity tunnel diode: A tight binding approach Appl. Phys. Lett. 100, 062403 (2012); 10.1063/1.3683525
Local spin valve effect in lateral (Ga,Mn)As/GaAs spin Esaki diode devices AIP Advances 1, 022113 (2011); 10.1063/1.3591397
Tunneling anisotropic spin polarization in lateral (Ga,Mn)As/GaAs spin Esaki diode devices Appl. Phys. Lett. 95, 152101 (2009); 10.1063/1.3247187
Tunneling anisotropic magnetoresistance: Creating a spin-valve-like signal using a single ferromagnetic semiconductor layer
J. Appl. Phys. 97, 10C506 (2005); 10.1063/1.1848353
In-plane tunneling anisotropic magnetoresistance in (Ga,Mn)As/GaAs Esaki diodes in the regime of the excess current
J.Shiogai,1,2M.Ciorga,3,a)M.Utz,3D.Schuh,3M.Kohda,1D.Bougeard,3T.Nojima,2 D.Weiss,3and J.Nitta1
1Department of Materials Science, Tohoku University, Sendai 980-8579, Miyagi, Japan
2Institute of Materials Research, Tohoku University, Sendai 980-8577, Miyagi, Japan
3Institute of Experimental and Applied Physics, University of Regensburg, D-93040 Regensburg, Germany
(Received 27 February 2015; accepted 19 June 2015; published online 29 June 2015)
We investigate the angular dependence of the tunneling anisotropic magnetoresistance in (Ga,Mn)As/n-GaAs spin Esaki diodes in the regime where the tunneling process is dominated by the excess current through midgap states in (Ga,Mn)As. We compare it to similar measurements performed in the regime of band-to-band tunneling. Whereas the latter show biaxial symmetry typical for magnetic anisotropy observed in (Ga,Mn)As samples, the former is dominated by uniaxial anisotropy along theh110iaxes.VC 2015 AIP Publishing LLC.
[http://dx.doi.org/10.1063/1.4923309]
A ferromagnetic/nonmagnetic (FM/NM) junction con- stitutes a fundamental building block of many spintronic devices.1One of its common applications is to generate and detect spin accumulations in NM materials by electrical means.2,3In order to achieve high values of spin injection efficiency such a junction should be operated in the tunnel- ing regime, especially when the NM is a semiconductor.4,5 This is often realized by inserting a thin insulating layer between FM and NM. In recent years there has been a great interest in investigating the role of impurities in such junctions,6–8localized within the tunnel barrier or on either side of it, on the spin transport through such a device. Much of the interest has been caused by the recent controversies regarding the so-called three-terminal (3 T) method of spin detection,6–9 where one and the same contact is used to inject and detect spins in a NM. This method has been par- ticularly employed to investigate spin injection in group IV materials,10 but its validity has been widely disputed.11–14 High signals, which have been recorded using the 3 T method, are often assigned to spin accumulation generated in localized states at the junction, or simply to magnetore- sistance effects originating from the inelastic tunneling through impurities present in such a junction. Recently, we have investigated the influence of localized states in the gap of the ferromagnetic semiconductor (Ga,Mn)As on the spin signal observed in (Ga,Mn)As/GaAs spin Esaki diode devices.15Although we have shown that the measured 3 T signal contains qualitative information about the spin accu- mulation generated in the channel, its amplitude depends on the bias-dependent spin detection sensitivity.16This puts into question the validity of the 3 T method as a straightfor- ward tool for spin injection studies. The discrepancy between the amplitude of the 3 T signal and the actual spin accumulation is particularly strong in the region when the tunneling is dominated by the excess current through local- ized states in the gap of (Ga,Mn)As.
In this letter, we further investigate the role of localized gap states in tunneling through the (Ga,Mn)As/GaAs Esaki diode. We study the tunneling anisotropic magnetoresistance effect (TAMR) of our structure in and outside the regime of excess current flow. TAMR is one of the novel magnetore- sistance effects discovered in a (Ga,Mn)As-based tunnel junction17 and later observed in junctions with metal ferro- magnets.18The core of the effect is the dependence of the re- sistance of the junction on the magnetization orientation of the ferromagnetic layer. In (Ga,Mn)As, the effect is ascribed to the combined contribution of spin-orbit and exchange interactions, resulting in density of states anisotropies17 and thus magnetization dependent shifts of the Fermi level.19,20 In the past, we have investigated TAMR in Esaki diode structures in the regime of band-to-band tunneling.21,22 We observed the typical symmetry of magnetic anisotropies in (Ga,Mn)As-based transport devices: a dominating cubic ani- sotropy along theh100icrystal directions, accompanied by a superimposed uniaxial anisotropy along the h110i direc- tions.23The cubic anisotropy reflects theTdsymmetry of the zinc-blend crystal, whereas the uniaxial anisotropy is the sig- nature of reducing this symmetry toC2v. In bulk (Ga,Mn)As a non-uniform distribution of Mn dimers along the h110i directions of the epitaxially grown surface is named as a pos- sible origin of this symmetry reduction,24whereas in case of heterostructures it reflects an asymmetry of the correspond- ing interfaces. In contrast, the symmetry of the TAMR effect observed here in the excess current regime is completely dominated by the uniaxial anisotropy, with maximum resist- ance observed for the ½110direction and minimum for the
½110direction. To make sure that this uniaxial anisotropy is not dominated by the tunneling anisotropic spin polarization (TASP), which exhibits a similar uniaxial symmetry,22,25 we also measured TASP using a nonlocal spin-detection technique.
Data presented in this work were obtained from a sam- ple fabricated from the same epitaxial wafer that was used before for other spin-related investigations.26The wafer was grown on a semi-insulating GaAs (001) substrate, consisting
a)Author to whom correspondence should be addressed. Electronic mail:
mariusz.ciorga@ur.de
0003-6951/2015/106(26)/262402/5/$30.00 106, 262402-1 VC2015 AIP Publishing LLC
This article is copyrighted as indicated in the article. Reuse of AIP content is subject to the terms at: http://scitation.aip.org/termsconditions. Downloaded to IP:
of a 300 nm GaAs buffer layer, a 500 nm thick (Al,Ga)As/
GaAs superlattice, 1lmn-GaAs, 15 nmn!nþ-GaAs transi- tion layer, 8.0 nmnþ-GaAs, 2.2 nm (Al,Ga)As diffusion bar- rier, and 50 nm (Ga,Mn)As. The corresponding doping concentrations aren¼21016cm3andnþ¼51018cm3. The wafer was patterned into a 50–lm-wide mesa oriented along the [110] crystallographic direction by standard photo- lithography and wet chemical etching techniques. Electron beam lithography, Ti/Au evaporation, and reactive ion etch- ing were employed to define ferromagnetic electrodes along the ½110 direction, each of which could be used as a spin injecting or detecting contact. Consistent results to the ones presented here were also obtained from measurements on a different samples, used for 3 T investigations described elsewhere,15 which was fabricated from a slightly different wafers.
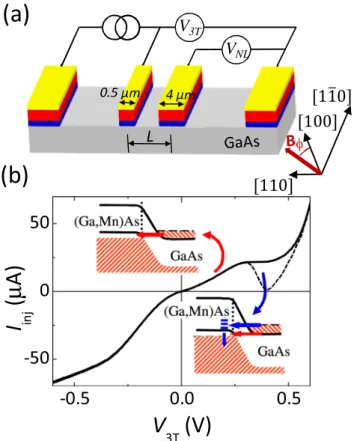
A schematic of the final sample geometry is displayed in Fig.1(a). Although the investigated samples have five FM contacts on top of the channel, for simplicity, only two are shown in the figure. For MR measurements, a currentIinjis driven between a given FM contact and the ground contact at the left edge of the channel, while the three-terminal (3 T) voltage (denoted as V3T) is measured between this contact and the reference electrode at the right edge of the channel.
This voltage is a measure of the voltage drop across the junc- tion and, for a constant current, is a direct measure of the
resistance of the junction. The spin accumulation, generated in the channel as a result of spin injection, has been probed non-locally by measuring the voltage VNL between the nearby second FM contact and the reference one at the right edge of the channel. All transport measurements in this experiment were performed atT¼4.2 K.
The current-voltage characteristic of the 0.5lm wide Esaki diode contact, measured in 3 T configuration, is shown in Fig.1(b). The current through an Esaki diode consists typ- ically of different contributions from: (i) direct tunneling between the valence band ofp–(Ga,Mn)As and the conduc- tion band of n-GaAs; (ii) tunneling through localized states in the bandgap (constituting the so-called excess current27);
and (iii) thermal transport across the built-in potential. The last component, not interesting for spin injection, dominates at high forward bias. At reverse bias and for small forward bias, on the other hand, the component (i) dominates the cur- rent as electrons tunnel from (Ga,Mn)As into GaAs (reverse bias) or in the opposite direction (forward bias). The latter case is schematically shown in the upper inset of Fig. 1(b).
This component is suppressed by a further increase of the forward bias, which removes the overlap of the bands. For an ideal Esaki diode, this would lead to a vanishing current and result in the well-known peak-valley structure or a dip in the I–Ucharacteristic (see the dashed curve in Fig.1(b)). In real devices, however, the component (ii) dominates in this regime and is responsible for a non-zero tunnel current. The importance of this process in our devices is manifested by a very shallow Esaki dip observed typically in measured I–U characteristics. In case of the one shown in Fig.1(b), it is not even a dip but rather a flat region between 0.3 and 0.4 V in Fig. 1(b). The process responsible for this behavior is depicted in the lower inset of Fig. 1(b), showing electrons tunneling from the conduction band either into localized states or directly into the valence band. In the following paragraphs we discuss different anisotropy patterns observed in magnetoresistance measured in those two tunneling regimes.
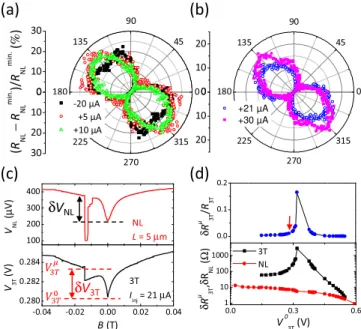
The in-plane TAMR measurements were performed by rotating the external magnetic fieldB¼1 T, sufficiently strong to align the magnetization of the (Ga,Mn)As ferromagnetic electrode along the field, while measuringV3T. The measure- ments were conducted for different bias currents correspond- ing to different regimes of tunneling through the Esaki diode.
The results are summarized in Fig.2. Typical TAMR curves obtained in the regime (i), dominated by tunneling between the valence band of (Ga,Mn)As and the conduction band of GaAs, i.e., for Iinj<þ10lA (V3T<þ0.148 V) are shown in Fig.2(a). The TAMR is defined here with respect to the mini- mum resistance by TAMRð/Þ ¼100% ðR3Tð/Þ Rmin:3T Þ= Rmin:3T , whereR3T¼V3T/Iinj. The direction of the magnetic field / is defined by the angle between the applied magnetic field and the [100] crystallographic direction of the GaAs substrate.
Similarly, as in previous works,21,22,25a cubic (biaxial) anisot- ropy inR3Tbetween h100iand h110icrystallographic direc- tions dominates the picture. A small contribution from a uniaxial anisotropy, breaking the equivalence between [110]
and½110directions, is also present. The strength and the sign of this uniaxial component strongly depend on bias. For Iinj¼ 20lA (V3T¼ 0.166 V) resistance measured in [110]
FIG. 1. (a) Schematic device layout and measurement configuration (not to scale). For simplicity only two FM contacts are shown. (b)I-Ucharacteristic of the 0.5lm wide contact measured in the three-terminal configuration.
Upper inset: direct band-to-band tunneling (red arrow) dominating at nega- tive and low positive bias values. Lower inset: the excess current (blue arrow) through gap states dominates transport through the Esaki diode close to the Esaki feature. The dashed curve shows a typicalI-Ucurve of the Esaki diode in the absence of the excess current.
262402-2 Shiogaiet al. Appl. Phys. Lett.106, 262402 (2015)
direction is0.75% larger than in a case of ½110direction, with the latter being also a direction of a total minimum in R3T. For positive bias this uniaxial anisotropy is significantly smaller with a difference in R3T between ½110 and ½110 directions being 0.1% for both þ5lA (0.086 V) and þ10lA (0.148 V). The sign of the anisotropy has, however, changed as higher resistance is now measured along the½110 direction. A similar change of sign of the uniaxial TAMR with applied bias has been observed for Fe/GaAs heterostruc- tures, and has been there explained by the combined effect of Bychkov-Rashba and Dresselhaus spin-orbit interaction18,28at an interface with reducedC2v symmetry. It is interesting to note that forIinj¼ þ10lA, the cubic anisotropy has an oppo- site sign compared to the one described previously for the case of negative bias, asR3T becomes higher for the magnet- ization aligned along h110i directions than for the case of h100ialignment.
Symmetry of the TAMR becomes significantly different when the excess current dominates over direct interband tun- neling, i.e., close to the Esaki dip. The uniaxial anisotropy now completely dominates the picture, as it is shown in Fig.
2(b), where curves forIinj¼21lA and 30lA are displayed.
This change of symmetry from a cubic-dominated picture to a uniaxial-dominated one in the region of the excess current is clearly seen in Fig. 2(c), where we plot the TAMR
obtained for different bias voltages vsV3Tand/as a color- coded plot. Here, magnetoresistance is normalized with respect to R½1103T , corresponding to R3T measured when the magnetic field of 1 T is applied along the [110] direction. For V3Tⱗþ0:16 V; ðIinjⱗþ11lAÞ, i.e., in the band-to-band tunneling regime, the fourfold symmetry fully dominates the picture. Approximately at this voltage the onset of a strong uniaxial anisotropy alongh110iis observed, which is becom- ing stronger with increasing voltage, reaching a maximum of 2.8% at V3T¼ þ0.284 V (Iinj¼ þ21lA). This anisotropy becomes then smaller at higher voltages, when the thermal transport across the built-in potential becomes dominant; the fourfold anisotropy is not present anymore in this regime.
One can thus clearly associate the observed change of sym- metry in the magnetoresistance with the change of the tun- neling mechanism from the band-to-band mechanism to the one dominated by tunneling through impurity states within the gap. It is not likely that the uniaxial anisotropy caused by a non-uniform Mn dimer distribution would be enhanced in the regime of the excess current; therefore, the involvement of the impurity in the tunneling is probably responsible for the uniaxial symmetry. Such a conclusion is consistent with a theoretical report on tunneling in a system involving a sin- gle Mn impurity in GaAs:Mn/Al(Ga,As)/p-GaAs junction.29 There it was shown that the tunneling current from the fun- damental hole state attached to a single Mn dopant in a GaAs host matrix, coupled to a reservoir through an AlGaAs tunnel barrier showsC2vsymmetry with pronounced differ- ences between ½110 and ½110 directions. The substantial contribution of impurity states detached from the valence band to the tunneling current in the excess regime was shown in other theoretical calculations.30
It is well established that resistance measured across an FM/NM junction has a contribution originating from the spin accumulation l generated in the NM material; the fact uti- lized in the 3 T method of spin detection. The measured re- sistance can be generally written as R3T¼R03TþdRl3T, where the first and the second component correspond to the tunnel resistance and to the spin-accumulation-related resist- ance, respectively. R03T depends on the magnetization direc- tion of the FM layer, due to TAMR effect.17,18According to the standard model of spin injectiondRl3T ¼P2qk=2S, where kis the spin diffusion length in the channel andqandSare its resistivity and cross section area, respectively.5P is the spin injection efficiency of a given contact, which for tun- neling contacts is equal to the tunneling spin polarization (TSP), constituting a spin selectivity of the junction. TSP also depends on magnetization and similarly as TAMR one can define tunneling anisotropic spin polarization as TASPð/Þ ¼DPð/Þ=P. In general, TSP and R03T can be treated as independent parameters of the junction, and therefore, TASP and TAMR can have a different symmetry.
In fact, in our earlier work,22,25 we have shown that the TSP shows a uniaxial anisotropy in (Ga,Mn)As/GaAs Esaki diodes, which were also confirmed by theoretical calcula- tions.31Using all above equations and assuming isotropick, one can writeDR3T¼DR03TþDRl3T; DRl3T ¼2ðDP=PÞdRl3T
¼2TASPdRl3T. Finally, the measured TAMR can be written as
FIG. 2. Dependence of the R3Tresistance on the angle/between the exter- nal magnetic field B¼1 T and the [100] crystallographic direction. (a) Tunneling anisotropic magnetoresistance (TAMR) normalized to the mini- mum resistanceRmin3T for injection currents ofIinj¼ 20,þ5, andþ10lA (V3T¼ 0.166, þ0.086, and 0.148 V, respectively), i.e., in the regime of direct band-to-band tunneling. (b) As in (a) but for injection currents Iinj¼ þ21 andþ30lA (V3T¼ þ0.284 andþ0.504 V), i.e., in the presence of the excess current through impurity states. (c) Color-coded plot of the TAMR normalized to the resistanceR½1103T forBk ½110 vs angle/and the three-terminal voltageV3T. The plot has been assembled from the angle scans for bias voltage (current) marked with solid circles atI-Ucurve, as shown in the left panel. The color levels between the actual data points have been extrapolated.
This article is copyrighted as indicated in the article. Reuse of AIP content is subject to the terms at: http://scitation.aip.org/termsconditions. Downloaded to IP:
TAMR¼DR3T=R3T ¼DR03T=R3Tþ2TASPdRl3T=R3T: (1) The TASP contributes thus to TAMR with a weight given by 2dRl3T=R3T. In Ref. 15, we have shown that in (Ga,Mn)As/GaAs spin Esaki diodes, the spin-related compo- nentdRl3T is strongly enhanced in the region of the excess current, mainly because of the enhanced sensitivity of the 3 T detection due to a strong nonlinearity of theI–Ucurve.
In order to check whether the uniaxial anisotropy observed inR3Tis not caused by TASP but is indeed directly related to TAMR effect inR03T, one should then evaluate TASP and its contribution to the total TAMR given bydRl3T=R3T:
To measure the TASP-induced anisotropy in the spin signal, we used the nearby Esaki diode contact to monitor the spin accumulation in the channel using the nonlocal con- figuration, as shown in Fig.1(a). The nonlocal voltageVNL
was measured together with V3Tduring the TAMR measure- ments described above. According to the standard model of spin injection,4,5 the nonlocal voltage is given by VNL¼ ðIinjP1P2qk=2SÞexpðL=kÞ, where L is the distance between injector and detector andP1(2)is the spin injection efficiency of the injector (detector) contacts. Assuming that kis isotropic, the observed anisotropy in VNLis proportional to the TASP of both involved contacts so that DVNL=VNL
¼DP1=P1þDP2=P2 ¼TASP1þTASP2. In Figs. 3(a) and 3(b), we plot the dependence of the nonlocal resistance
RNL¼VNL=Iinjon the angle/, obtained simultaneously with the TAMR curves, as shown in Fig. 2. The data display a strong uniaxial anisotropy with the maximum signal along the
½110 direction. This is consistent with our previous experi- ments22,25as well as with theoretical calculations.31Both the sign and the strength of the anisotropy, being around 20%, are barely influenced by the applied bias in the explored range.
Therefore, we can assume that TASP1¼TASP2¼TASP, what allows us to evaluate the TASP of one contact as10%, the value consistent with our previous reports.
To check if the10% TASP might be responsible for the anisotropy in R3T, as displayed in Fig. 2, we independ- ently measured the amplitude of the spin-accumulation- related signal dRl3T and its contribution to R3T performing experiments in the spin-valve configuration,32 i.e., with a magnetic field swept along the contacts. Figure 3(c) shows NL voltage for detector at L¼5lm and 3 T voltage as a function of such a field for Iinj¼21lA. The NL voltage shows clearly a spin-valve signal corroborating spin accumu- lation in the GaAs channel. As a measure of spin accumula- tion we use the amplitude of a feature around B¼0, arising from depolarization of the spins due to dynamic nuclear polarization (DNP) effects in GaAs.33We denote this ampli- tude asdVNLanddV3Tin Fig.3(c), for nonlocal and 3 T con- figuration, respectively. The validity of the method is confirmed when one compares dVNL and dV3T with corre- sponding Hanle measurements,15,32or with a SV signal [see Fig. 3(c)]. This method is particularly useful in case of 3 T measurements, where in-plane B-field sweeps can be used to detect the spin accumulation instead of the time consum- ing Hanle measurements. The corresponding amplitudes dRl3T¼dV3T=Iinj and dRNL¼dVNL=Iinj are plotted in Fig.
3(d)as a function ofV3T. The strong enhancement of the 3 T signals in the excess current regime is clearly observed, as has been reported before in Ref. 15. The contribution of the spin-related signaldRl3T=R3T to the overall tunnel resistance R3Twe plot in the same figure. WhereasdRl3T=R3T0:17 in the middle of the Esaki feature, it is only 0.01 for V3T
¼0.28 V (Iinj¼21lA), i.e., for the value for which we observe a strong uniaxial anisotropy in Fig.2(b). According to Eq.(1), the measured TASP of10% would then result in an anisotropic signal in R3Tbeing0.2%, i.e., one order of magnitude smaller than the measured value of 2.8%. This allows us to exclude TASP as the origin of a strong uniaxial anisotropy observed in the regime of the excess current.
In summary, we have performed studies of the in-plane TAMR and TASP of (Ga,Mn)As/GaAs spin Esaki tunneling contacts. In the excess current regime, where current flow through localized states in the gap of (Ga,Mn)As prevails, uniax- ial symmetry dominates the measured TAMR curves. This is in stark contrast to the direct band-to-band tunneling regime where the cubic anisotropy dominates. This observation is consistent with theoretical calculations showing the importance of impurity states in the (Ga,Mn)As gap for tunneling in (Ga,Mn)As/GaAs Esaki diodes30and with calculations showing a similar uniaxial anisotropy in case of tunneling involving a single Mn impurity at the GaAs:Mn/Al(Ga,As)/p-type GaAs junction.29
This work was partly supported by the German Science Foundation (DFG) via SFB 689, the Japan-Germany
FIG. 3. (a) Anisotropy of the nonlocal resistanceRNL(/), measured at the detector placedL¼20lm from the injector, normalized to the minimum value, plotted as a function of the angle/forB¼1 T. Injection currents are the same as in Fig.2(a)for 3 T measurements. (b) As in (a) but with injec- tion currents as in Fig.2(b). (c) Nonlocal voltage VNL(top panel) and three- terminal voltageV3T(bottom panel) as a function of the in-plane magnetic fieldBk ½110, swept from positive to negative values. The spin injection current was Iinj¼ þ21lA (V3T¼ þ0.280 V). Spin signalsdVNLanddV3T
were extracted from the DNP feature aroundB¼0. (d) Bottom: bias depend- ence of the detected spin signal dR3T(NL)¼dV3T(NL)/Iinj in 3 T (black squares) and NL (red circles) geometries.VNLis measured atL¼5lm. Top:
the contribution of the spin-accumulation-induced resistancedRl3T to the total resistance of the junctionR3T. The arrow points to the value corre- sponding to Iinj¼ þ21lA, for which maximum TAMR¼2.8% was observed.
262402-4 Shiogaiet al. Appl. Phys. Lett.106, 262402 (2015)
Strategic International Cooperative Program (Joint Research Type) from JST and DFG (FOR 1483), Grants-in-Aid from JSPS 22226001 and 24684019.
1I.Zutic´, J. Fabian, and S. Das Sarma, Rev. Mod. Phys.76, 323 (2004).
2F. J. Jedema, A. T. Filip, and B. J. van Wees,Nature410, 345 (2001).
3X. Lou, C. Adelmann, M. Furis, S. A. Crooker, C. J. Palmstrøm, and P. A.
Crowell,Phys. Rev. Lett.96, 176603 (2006).
4A. Fert and H. Jaffre`s,Phys. Rev. B64, 184420 (2001).
5J. Fabian, A. Matos-Abiague, C. Ertler, P. Stano, and I.Zutic´,Acta Phys.
Slovaca57, 565 (2007).
6M. Tran, H. Jaffre`s, C. Deranlot, J.-M. George, A. Fert, A. Miard, and A.
Lema^ıtre,Phys. Rev. Lett.102, 036601 (2009).
7R. Jansen, A. M. Deac, H. Saito, and S. Yuasa,Phys. Rev. B85, 134420 (2012).
8A. Jain, J.-C. Rojas-Sanchez, M. Cubukcu, J. Peiro, J. C. Le Breton, E.
Prestat, C. Vergnaud, L. Louahadj, C. Portemont, C. Ducruet, V. Barski, P. Bayle-Guillemaud, L. Vila, J.-P. Attane, E. Augendre, G. Desfonds, S.
Gambarelli, H. Jaffre`s, J.-M. George, and M. Jamet,Phys. Rev. Lett.109, 106603 (2012).
9S. P. Dash, S. Sharma, R. S. Patel, M. P. de Jong, and R. Jansen,Nature 462, 491 (2009).
10R. Jansen,Nat. Mater11, 400 (2012).
11T. Uemura, K. Kondo, J. Fujisawa, K. Matsuda, and M. Yamamoto,Appl.
Phys. Lett.101, 132411 (2012).
12O. Txoperena, M. Gobbi, A. Bedoya-Pinto, F. Golmar, X. Sun, L. E.
Hueso, and F. Casanova,Appl. Phys. Lett.102, 192406 (2013).
13Y. Song and H. Derry,Phys. Rev. Lett.113, 047205 (2014).
14H. N. Tinkey, P. Li, and I. Appelbaum, Appl. Phys. Lett.104, 232410 (2014).
15J. Shiogai, M. Ciorga, M. Utz, D. Shuch, M. Kohda, D. Bougeard, T.
Nojima, J. Nitta, and D. Weiss,Phys. Rev. B89, 081307(R) (2014).
16A. N. Chantis and D. L. Smith,Phys. Rev. B78, 235317 (2008).
17C. Gould, C. R€uster, T. Jungwirth, E. Girgis, G. M. Schott, R. Giraud, K.
Brunner, G. Schmidt, and L. W. Molenkamp,Phys. Rev. Lett.93, 117203 (2004).
18J. Moser, A. Matos-Abiague, D. Schuh, W. Wegscheider, J. Fabian, and D.
Weiss,Phys. Rev. Lett.99, 056601 (2007).
19J. Wunderlich, T. Jungwirth, B. Kaestner, A. C. Irvine, A. B. Shick, N.
Stone, K.-Y. Wang, U. Rana, A. D. Giddings, C. T. Foxon, R. P. Campion, D. A. Williams, and B. L. Gallagher,Phys. Rev. Lett.97, 077201 (2006).
20M. Tran, J. Peiro, H. Jaffre`s, J.-M. George, O. Mauguin, and A. Lema^ıtre, Appl. Phys. Let.95, 172101 (2009).
21M. Ciorga, M. Schlapps, A. Einwanger, S. Geißler, J. Sadowski, W.
Wegscheider, and D. Weiss,New J. Phys.9, 351 (2007).
22M. Ciorga, A. Einwanger, U. Wurstbauer, D. Schuh, W. Wegscheider, and D. Weiss,Physica E42, 2673 (2010).
23T. Dietl and H. Ohno,Rev. Mod. Phys.86, 187 (2014).
24M. Birowska, C.Sliwa, J. A. Majewski, and T. Dietl,Phys. Rev. Lett.108, 237203 (2012).
25A. Einwanger, M. Ciorga, U. Wurstbauer, D. Schuh, W. Wegscheider, and D. Weiss,Appl. Phys. Lett.95, 152101 (2009).
26T. Arakawa, J. Shiogai, M. Ciorga, M. Utz, D. Schuh, M. Kohda, J. Nitta, D. Bougeard, D. Weiss, T. Ono, and K. Kobayashi,Phys. Rev. Lett.114, 016601 (2015).
27A. G. Chynoweth, W. L. Feldmann, and R. A. Logan,Phys. Rev.121, 684 (1961).
28A. Matos-Abiague, M. Gmitra, and J. Fabian,Phys. Rev. B80, 045312 (2009).
29M. O. Nestoklon, O. Krebs, H. Jaffres, J.-M. George, J. M. Jancu, and P.
Voisin,Appl. Phys. Lett.100, 062403 (2012).
30P. Pereyra and D. Weiss,Phys. Rev. B90, 245310 (2014).
31P. Sankowski, P. Kacman, J. A. Majewski, and T. Dietl,Phys. Rev. B75, 045306 (2007).
32M. Ciorga, M. Utz, D. Schuh, D. Bougeard, and D. Weiss,Phys. Rev. B 88, 155308 (2013).
33J. Shiogai, M. Ciorga, M. Utz, D. Schuh, T. Arakawa, M. Kohda, K.
Kobayashi, T. Ono, W. Wegscheider, D. Weiss, and J. Nitta,Appl. Phys.
Lett.101, 212402 (2012).
This article is copyrighted as indicated in the article. Reuse of AIP content is subject to the terms at: http://scitation.aip.org/termsconditions. Downloaded to IP:
![FIG. 2. Dependence of the R 3T resistance on the angle / between the exter- exter-nal magnetic field B ¼ 1 T and the [100] crystallographic direction](https://thumb-eu.123doks.com/thumbv2/1library_info/5587098.1690587/4.918.82.438.79.473/dependence-resistance-angle-exter-exter-magnetic-crystallographic-direction.webp)