Exchange energy and impurity band effects in the I -V characteristics of (Ga,Mn)As/GaAs spin injectors
Pedro Pereyra*and Dieter Weiss
Institute for Experimental and Applied Physics, University of Regensburg, 93053 Regensburg, Germany (Received 7 October 2014; revised manuscript received 12 December 2014; published 30 December 2014) A different approach to calculate theI-Vcharacteristics ofp+(Ga,Mn)As/n+GaAs spin injectors is presented.
The vanishing of the spin-extraction transmission coefficients at the spin-split valence-band edges leads us to predict a dip or plateau in theI-Vcharacteristics of this kind of diodes. We show that this minimum, or the inflection point, shifts with the exchange energy. Within this approach and using Kane-like densities of states with a detached impurity band, and exchange energies reported in the literature, excellent agreement is found with observed low-bias features ofI-Vcharacteristics.
DOI:10.1103/PhysRevB.90.245310 PACS number(s): 72.25.Hg,71.70.Gm,72.25.Mk,85.75.−d A good understanding and control of injection and detec-
tion of spin currents through Zener diodes is an essential requisite for all-semiconductor spintronics. The theoretical suggestion that a larger contact resistance Rc increases the ferromagnetic/nonmagnetic (F/N) spin-injector efficiency [1–4] promoted the research on Mn-based ferromagnetic semi- conductors [5–7]. Spin-polarized electrons were injected and detected [8,9] using the Esaki diodep+(Ga,Mn)As/n+GaAs, and an overwhelming amount of experimental and theoretical research activity followed in order to understand the electronic and magnetic properties of these systems [10–16]. Concepts such as the spin-selective tunneling, the spin-injection effi- ciency, the spin accumulation, and the impurity band position, among others, became open, debated issues [10,14,17]. We address some of them here.
To study the contact resistance as functions of the exchange energy, the nonequilibrium spin splitting, the impurity concen- trations, and the bias potential, accurate quantum calculations are required. Interband tunneling calculations across Schottky barriers, based on a drift-diffusion transport model, were carried out by Smith et al. [3]; Fabian et al. [18] studied the spin injection through magneticp-njunctions within the standard semiconductors theory. A microscopic calculation of spin transport through a Schottky (triangular) barrier was carried out by Osipovet al.[19]. Nevertheless, none of these works included a detailed calculation of spin-selective I-V characteristics (IVC).
In the standard drift-diffusion theory, the contact resistance is a kind of abstract entity, defined by the boundary conditions atz=0. However, it has size and shape which depend, among others, on the exchange energy, the impurity concentrations, and the bias potential. The contact barrier determines the tunneling probabilities [20], the spin currents, and, hence, the device performance.
Based on accurate quantum-mechanical calculations [21], we will show that the vanishing of the tunneling probabilities, at the spin-dependent threshold bias where the propagating modes become evanescent, has direct consequences in the low-bias features. In these systems, at variance with the
*Corresponding author: On leave from Ciencias B´asicas, UAM- Azcapotzalco, M´exico D.F., M´exico; pereyrapedro@gmail.com
“regular” Esaki effect of unpolarized systems, which can be explained in terms of the density of states (DOS) alone, the low-bias features in the IVC of F/N structures depend on both the spin splitting and the DOS. These results lead us to predict that the minimum of the negative differential resistance and the maximum and minimum of the spin accumulation shift with the exchange energy. We will show that the low-bias features of the IVC seen in Fig.1, around 0.4 eV, and the negative differential resistance reported in the I-V characteristics of Ga(Mn)As/GaAs, by Holmberg et al. [23], are a direct consequence of the exchange-coupling and the impurity-states distribution.
In Fig.2, a schematic band structure of the highly doped p+Ga0.95Mn0.05As/Al0.36Ga0.64As/n+GaAs structure is shown, under small inverse bias. zL and zr are the Esaki barrier boundaries. Throughout the paper, we consider impurity concentrations p+6×1026m−3 and n+1×1024m−3, and an Al0.36Ga0.64As stop layer width of 2 nm. In this approach, we assume a simplified model of the valence-band structure which does not take into account the effects of valence-band mixing and thus overestimates the spin polarization for a given exchange splitting. A detailed picture of these effects and the valence-band structure of the highly doped ferromagnetic semiconductor p+(Ga,Mn)As can be found in Ref. [24], where a 6×6 Kohn-Luttinger model, with arbitrary orientation of the magnetization, was considered.
For an accurate calculation of the transmission coefficients, and hence of the IVC, we use a recently developed approach to deal with the (four-channel) Schr¨odinger equation [21].
) (
)(
FIG. 1. (Color online) I-V characteristics measured by Shiogai et al.[22] for the spin injectorp+Ga0.95Mn0.05As/n+GaAs with stop layer.
FIG. 2. (Color online) Schematic band structure of a biased Esaki potential barrier at the interface of the ferromagnetic/stop layer/nonmagnetic structure, with spin-split offsetFin the valence band of the p side and the nonequilibrium spin accumulation electrochemical potentialμsNin thenside.
The main inputs are the transfer matricesMj(zj) that connect state vectors at each side of pointszj, such aszL,zA,z0, and zr, in Fig.2and the transfer matricesMj i(zj,zi) that connect state vectors in continuous-potential regions, in the barrier. In the reverse (injection) and forward (extraction) configuration, we have
(zr)=MI(zr,zL)(zL)=
αI βI
γI δI
(zL), (1) and
(zL)=ME(zL,zr)(zL)=
αE βE
γE δE
(zL), (2) where the state vectors
(z)=(ϕ↑+,ϕ↓+,ϕ↑−,ϕ↓−)T, (3) depending on the energy, are written in terms of propagating wave functions (σstands for either spin up↑or spin down↓),
ϕσ+(z)= aσ
√kσeikσzχσ and ϕσ−= bσ
√kσe−ikσzχσ, (4) or of the evanescent functions,
ϕσ+(z)= aσ
√qσeqσzχσ and ϕσ−= bσ
√qσe−qσzχσ. (5)
Here, k↑,↓=
2m∗
2 [EF i−U↑,↓(z,Vb)] and q↑,↓= 2m∗
2 [U↑,↓(z,Vb)−EF i] are the wave numbers and EF i =EFp, EF n are the quasi-Fermi energies. Given the transfer matrices and taking into account the well-known relations with the scattering amplitudes, tI =(δI†)−1 and tE=(δ†E)−1, one can easily obtain the transmission coefficients (IandEare dropped to simplify the notation),
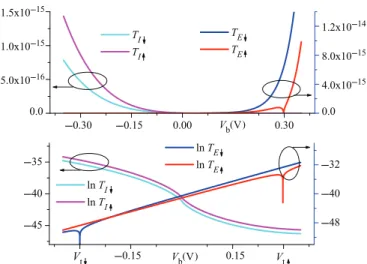
Tσ,σ = |tσ,σ|2= |(δ†)−1σ,σ|2. (6) In the upper graph of Fig. 3, the injection (Vb<0) and extraction (Vb>0) transmission coefficients, denoted asTI σ
andTE σ, are plotted as functions of the bias potential in the absence of spin flip. For this figure, we consider an exchange energy F =0.6 eV, as given by Bouzerar et al. [25] for ferromagnetic Ga(Mn)As with 5% Mn, and the Fermi level EFp at the middle point Ep0 between the spin-up and the spin-down band edges. These coefficients grow exponentially,
) (
) (
FIG. 3. (Color online) Spin-up and spin-down injection and detection transmission coefficients. These coefficients vanish at Vb=Vt↑andVb=Vt↓, respectively.
from very small values (at zero bias) to almost 1 for bias of the order of the energy gap. An important feature is the vanishing of the extraction coefficientsTE σ at the threshold pointsVt↑=F/2e andVt↓= −F/2e, where bias aligns the electrochemical potentials of the nonmagnetic side with the spin-up and spin-down valence-band edges, respectively. This feature, clearly seen in the lower panel of Fig.3, is essential to explain other quantities’ behavior as functions ofVb.
When the Fermi level EFp does not coincide with Ep0, the transmission coefficients are shifted and the threshold potentials becomeVtσ =(Ep0−EFp+σ F/2)/e. In Fig.4, we plot the transmission spin polarization,
PT E= TE↑−TE↓
TE↑+T↓ , (7) assuming a Fermi level of 0.112 eV below the middle pointEp0. The maximum and minimum occur at the threshold pointsVt↑
andVt↓, separated by the exchange energy. The same happens with other quantities such as the current spin polarization, the spin-injection efficiency, and the spin accumulation, defined as
Pj j↑−j↓
j↑+j↓, Pj QjQ↑−jQ↓
jQ↑+jQ↓
, and δμs ∝ −Pj, (8) withQ=I,Efor injection and extraction, andjσ=jI σ+jEσ. To obtain these quantities, including the IVC, we need to
FIG. 4. Transmission spin polarization, whenF =0.6 eV and EFpis 0.112 eV belowE0p. The maximum and minimum coincide with the threshold points. By definition, this is a very sensitive quantity to vanishing ofTE σatVt↑andVt↓.
evaluate the currents jQσ=V
VbDN σ(E)DF σ(E)TQσ σ(E,Vb)fF(E)gN(E)dE, whereV is a geometrical factor,DN σandDF σare the densities of states in the nonmagnetic and ferromagnetic sides, and f(E) andg(E)=1−f(E) are the occupation probabilities.
Since the experiments’ temperature is ∼4K, the occupation probabilities factor becomesδ(E−EF).
In the absence of an agreeable function for the electronic structure and the impurity-states distribution [17], near the Fermi level, we assume that the DOS can be written as
Dσ =DKσ+fiσ, (9) whereDKσis proportional to Kane’syfunction [26],
yσ(E)=
E
−∞(E−E0σ−ξ)p/2Fσ(ξ)dξ, (10) and fiσ is a function that represents the impurity-states distributions (ISD). We found this representation for the DOS quite useful in order to search for a good fitting of the IVC, as well as to see whether the ISD should be merged or detached.
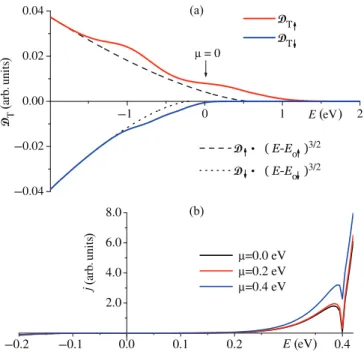
For example, if we have a DOS, like the one obtained by Turek et al. [27], for the Tang and Flatt´e model [28], we can use the Kane’s function y (for GaussianFσ), which is
∼=(E−Eoσ)p/2(withp=3) plus two Gaussians forfiσ. The densitiesDKσ describe the dotted lines in Fig.5(a), with an offset of 0.8 eV that agrees well with numerical values of F (=Eo↑−Eo↓), where Ep0 ∼0.1 eV. However, the IVC obtained with this DOS looks like that shown in Fig. 5(b), with outlines rather different from those in Figs.1(a)and1(b).
(a)
(b)
) (
)( )(
) (
FIG. 5. (Color online) The DOS DKσ ∝(E−Eoσ)3/2 (dotted lines), superimposed with two Gaussians, fit the DOS obtained numerically by Turek et al. [27], for the Tang and Flatt´e model.
(b) TheI-Vcharacteristics, when the centers of the Gaussians are at or near the band edge, shift towards the gap.
) (
FIG. 6. (Color online) The spin accumulationδμs ∝ −Pjwhen the Gaussian, at the valence-band edges of the DOS in Fig.5(a), shifts towards the gap.
So far, it has been impossible for us to fit the low-bias features of the IVCs using merged ISD.
If we shift the centersμ of the Gaussians, at or near the valence-band edges, towards the gap, the currents in Fig.5(b) remain almost the same, though the spin-injection efficiency Pj, and hence the spin accumulation∝ −Pj plotted in Fig.6, changes drastically.
To improve the IVC fitting, we consider DOS with different ISD, but essentially with the same functionDKσas for Turek’s DOS. In the ferromagnetic side, we propose
DF σ ∝e−aσσ(aσσ)p/2 (11) forσ=E−EFp−σ F/2>0, and
DF σ ∝(−σ)q/2 (12) with q=1 for σ<−F, q=p for−F< σ<0, and aσ and p as fitting parameters. In the nonmagnetic side, we considerDN σ =DKσ (withp=1). These densities and the currents are plotted in Fig. 7. It is clear from these graphs that by increasing p, the impurity-states distribution gets
(a)
(b)
) (
) ( )( )(
FIG. 7. (Color online) (a) The effect of the parameterponDF σ, in the neighborhood of the valence-band edges. (b) Total current through the Esaki barrier for the same parameters of Figs.4, and the DOS in Eqs. (11) and (12).
(a)
(b)
) ( )
(
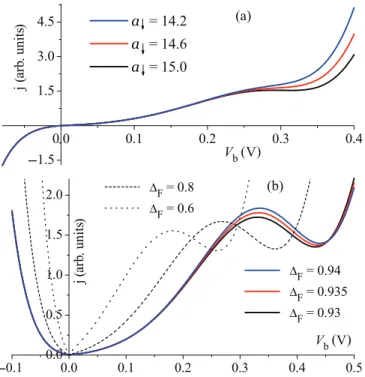
FIG. 8. (Color online) (a) Effects of the attenuation exponenta↓ in the IVC. Exponents are chosen to fit Fig. 1, whileF is kept at 0.6 eV. (b) Effects of the exchange energy F in the IVCs.
The continuous curves, for F=0.93, 0.935, and 0.94, account for the IVCs in Ref. [23]. The graphs for smallerF’s make visible the exchange-coupling effect in the IVCs.
detached from the valence band, while the current outline looks closer to that in Fig. 1. A large amount of band-gap
states was found in scanning tunneling spectroscopy studies on (Ga,Mn)As [29].
Each parameter has, in general, a specific effect on the IVC;
an exhaustive analysis will be given elsewhere. We will present here only the effects ofa↓andF. In Figs.8(a)and8(b), we plot the currents and we can see that the low-bias features of theI-Vcharacteristics, seen in Fig. 1 and in Fig. 3 of Ref. [23], are correctly reproduced whena↓andF are varied. In these plots, we hadp∼10 andEp0 =0.112 eV. These results show that the minimum of the IVC is related to and grows with the exchange energy.
In summary, a quantum approach, for spin injection and spin detection across biased Esaki barriers, was presented. The vanishing of the transmission coefficients at threshold bias, determined by the exchange energy, led us to predict a dip or plateau in theI-Vcharacteristics. We have shown direct effects of the exchange energy on the distance between the maximum and minimum of the transmission spin polarization and the spin accumulation. We have also shown that the minimum of the negative differential resistance grows with the exchange energy. Assuming a Kane-like DOS plus an impurity-states distribution, a good agreement is found with the low-bias features of experimental IVC. The best agreement is obtained when the impurity-states distribution is detached from the valence band.
P.P. acknowledges the Program “Apoyo para Estancias Sab´aticas,” Contract No. 000000000165785, CONACyT, M´exico, and Project No. SFB 689/2 funded by the German Science Foundation (DFG). We acknowledge J. Fabian, A.
Matos-Abiague, J. Grabinsky, and A. Robledo-Martinez for useful comments.
[1] E. I. Rashba,Phys. Rev. B62,R16267(2000).
[2] A. Fert and H. Jaffres,Phys. Rev. B64,184420(2001); H. Jaffres and A. Fert,J. Appl. Phys.91,8111(2002).
[3] D. L. Smith and R. N. Silver,Phys. Rev. B64,045323(2001).
[4] S. Takahashi and S. Maekawa,Phys. Rev. B67,052409(2003).
[5] A. Van Esch, L. Van Bockstal, J. De Boeck, G. Verbanck, A. S.
van Steenbergen, P. J. Wellmann, B. Grietens, R. Bogaerts, F. Herlach, and G. Borghs,Phys. Rev. B56,13103(1997).
[6] H. Ohno,Science281,951(1998).
[7] Y. Ohno, D. K. Young, B. Beschoten, F. Matsukura, H. Ohno, and D. D. Awschalom,Nature (London)402,790(1999).
[8] E. Johnston-Halperin, D. Lofgreen, R. K. Kawakami, D. K.
Young, L. Coldren, A. C. Gossard, and D. D. Awschalom, Phys. Rev. B65,041306(2002).
[9] M. Kohda, Y. Ohno, K. Takamura, F. Matsukura, and H. Ohno, Jpn. J. Appl. Phys.40,L1274(2001).
[10] T. Dietl, H. Ohno, F. Matsukura, J. Cibert, and D. Ferrand, Science287,1019(2000).
[11] A. Oiwa, Y. Mitsumori, R. Moriya, T. Słupinski, and H. Munekata,Phys. Rev. Lett.88,137202(2002).
[12] I. Zuti´c, J. Fabian, and S. Das Sarma,Rev. Mod. Phys.76,323 (2004), and references therein.
[13] P. Van Dorpe, W. Van Roy, J. De Boeck, G. Borghs, P. Sankowski, P. Kacman, J. A. Majewski, and T. Dietl, Phys. Rev. B72,205322(2005).
[14] T. Jungwirth, J. Sinova, J. Masek, J. Kucera, and A. H.
MacDonald,Rev. Mod. Phys.78,809(2006).
[15] M. Ciorga, A. Einwanger, U. Wurstbauer, D. Schuh, W. Wegscheider, and D. Weiss, Phys. Rev. B 79, 165321 (2009).
[16] K. Sato, L. Bergqvist, J. Kudrnovsk, P. H. Dederichs, O. Eriksson, I. Turek, B. Sanyal, G. Bouzerar, H. Katayama- Yoshida, V. A. Dinh, T. Fukushima, H. Kizaki, and R. Zeller, Rev. Mod. Phys.82,1633(2010).
[17] S. Ohya, K. Takata, and M. Tanaka,Nat. Phys.7,342(2011).
[18] J. Fabian, I. Zuti´c, and S. Das Sarma,Phys. Rev. B66,165301 (2002).
[19] V. V. Osipov and A. M. Bratkovsky,Phys. Rev. B72,115322 (2005).
[20] P. Pereyra and D. Weiss,Physica B455,96(2014).
[21] More details will be published elsewhere.
[22] J. Shiogai, M. Ciorga, M. Utz, D. Schuh, M. Kohda, D. Weiss, and J. Nitta (unpublished); see also J. Shiogai, M. Ciorga, M.
Utz, D. Schuh, M. Kohda, D. Bougeard, T. Nojima, J. Nitta, and D. Weiss,Phys. Rev. B89,081307(R)(2014).
[23] H. Holmberg, N. Lebedeva, S. Novikov, J. Ikonen, P.
Kuivalainen, M. Malfait, and V. V. Moshchalkov, Europhys. Lett.71,811(2005).
[24] T. Dietl, H. Ohno, and F. Matsukura,Phys. Rev. B63,195205 (2001).
[25] G. Bouzerar,Europhys. Lett.79,57007(2007); G. Bouzerar, R. Bouzerar, and O. C´epas,Phys. Rev. B76,144419(2007).
[26] E. O. Kane,Phys. Rev.131,79(1963).
[27] M. Turek, J. Siewert, and J. Fabian,Phys. Rev. B78,085211 (2008).
[28] J.-M. Tang and M. E. Flatt´e, Phys. Rev. Lett. 92, 047201 (2004).
[29] T. Tsuruoka, N. Tachikawa, S. Ushioda, F. Matsukara, K. Takamura, and H. Ohno, Appl. Phys. Lett. 81, 2800 (2002).
![FIG. 1. (Color online) I-V characteristics measured by Shiogai et al. [22] for the spin injector p + Ga 0.95 Mn 0.05 As/n + GaAs with stop layer.](https://thumb-eu.123doks.com/thumbv2/1library_info/5619027.1692027/1.911.471.836.912.1076/color-online-characteristics-measured-shiogai-injector-gaas-layer.webp)