Investigating the Effort
of Using Business Process Management Technology:
Results from a Controlled Experiment
Barbara Weber
a,∗ , Bela Mutschler
bManfred Reichert
caDepartment of Computer Science, University of Innsbruck, Technikerstraße 21a, 6020 Innsbruck, Austria
bHochschule Ravensburg-Weingarten Postfach 1261, 88241 Weingarten, Germany
cInstitute of Databases and Information Systems, Ulm University James-Franck-Ring, 89069 Ulm, Germany
Abstract
Business Process Management (BPM) technology has become an important instrument for sup- porting complex coordination scenarios and for improving business process performance. When considering its use, however, enterprises typically have to rely on vendor promises or qualitative reports. What is still missing and what is demanded by IT decision makers are quantitative evaluations based on empirical and experimental research. This paper picks up this demand and illustrates how experimental research can be applied to technologies enabling enterprises to co- ordinate their business processes and to associate them with related artifacts and resources. The conducted experiment compares the effort for implementing and maintaining a sample business process either based on standard workflow technology or on a case handling system. We moti- vate and describe the experimental design, discuss threats for the validity of our experimental results (as well as risk mitigations), and present the results of our experiment. In general, more experimental research is needed in order to obtain valid data on the various aspects and effects of BPM technology and BPM tools.
Key words: Process-aware Information System, Workflow Management, Case Handling, Controlled Experiment, Information Systems Engineering
∗ Corresponding author.
Email addresses:barbara.weber@uibk.ac.at(Barbara Weber),bela.mutschler@hs-weingarten.de (Bela Mutschler),manfred.reichert@uni-ulm.de(Manfred Reichert).
1. Introduction
Providing effective IT support for business processes has become crucial for enterprises to stay competitive in their market [1,2]. In response to this need, a variety of process support paradigms (e.g., workflow management, case handling, service orchestration), process specification standards (e.g., WS-BPEL, BPMN), and business process manage- ment (BPM) tools (e.g., Tibco Staffware, FLOWer, IBM Websphere Process Server) have emerged supporting the realization of Process-Aware Information Systems (PAISs) [3].
Specifically, PAISs enable enterprises to implement and execute complex coordination scenarios either within an enterprise or in a cross-organizational setting [4].
Coordination scenarios are typically described by coordination models. Such models integrate the interactions of a number of (heterogeneous) components (processes, ob- jects, agents) into a meaningful description. Relevant research areas are, for example, service-oriented architectures (i.e., service coordination, service orchestration, and ser- vice choreography), cooperative information systems (e.g., workflow management tech- nology or case handling technology), component-based systems, multi-agent technology, and related middleware platforms.
When evaluating the suitability of existing BPM technology for a particular coordina- tion scenario or when arguing about its strengths and weaknesses, typically, it becomes necessary to rely on qualitative criteria. As one example considerworkflow patterns [5], which can be used to evaluate the expressiveness of the workflow modeling language provided by a particular BPM tool. As another example consider process change pat- terns [7], which facilitate the evaluation of BPM tools regarding their ability to deal with process changes. What has been neglected so far are more profound evaluations of BPM technology based on empirical or experimental research. This is surprising as the benefits of these research methods have been demonstrated in the software engineering area for a long time [8] (e.g., in the context of software development processes or code reviews [9,10]). In addition, a recently conducted survey among IT managers and project leaders has clearly shown that quantitative data on costs, benefits and effects of BPM technology becomes increasingly important [11].
Picking up this demand, this paper illustrates how experimental research can be ap- plied in the BPM context. For this purpose we have conducted a controlled software experiment with 48 participants to investigates the effort related to the implementation and change of business processes either using conventional workflow technology [12] or a case handling system [13]. More precisely, we have used Tibco Staffware [14] as rep- resentative of workflow technology andFLOWer [15] as representative of case handling systems. We describe our experimental design, give a mathematical model of the experi- ment, and discuss potential threats for the validity of experimental results. Following this we describe the major results of our experiment, which contribute to better understand the complex effort caused by using BPM technology, and discuss them in detail.
This paper is a significant extension of the work we presented in [16]. It includes ex- tended analyses of the data we gathered during our experiment and a more in-depth interpretation of the presented results. In particular, learning effects, which have to be considered when investigating the effort related to the implementation of business pro- cesses, constitute an additional aspect being addressed. Moreover, the comparison of workflow technology and case handling has been extended.
The remainder of this paper is organized as follows. Section 2 motivates the need for experimentation in BPM and provides background information needed for understanding our experiment. Section 3 describes our experimental framework. Section 4 deals with the performance and results of our experiment. Finally, Section 5 discusses related work and Section 6 concludes with a summary.
2. Background
This section presents the background needed for the understanding of this paper.
Section 2.1 introduces Process-Aware Information Sytems (PAISs). Section 2.2 deals with different paradigms for realizing PAISs, which we compare in our experiment.
2.1. Need for Process-Aware Information Systems
Empirical studies have indicated that providing effective business process support by information systems is a difficult task to accomplish [11,17]. In particular, these studies show that current information systems fail to provide business process support as needed in practice. Among the major reasons for this drawback are the hard-wiring of process logic in contemporary information systems and the missing support for coping with evolving business processes. Enterprises crave for approaches that enable them to control, monitor and continuously improve business process performance [18]. What is needed are PAISs, i.e., information systems that support the modeling, enactment and monitoring of business processes in an integrated and efficient way.
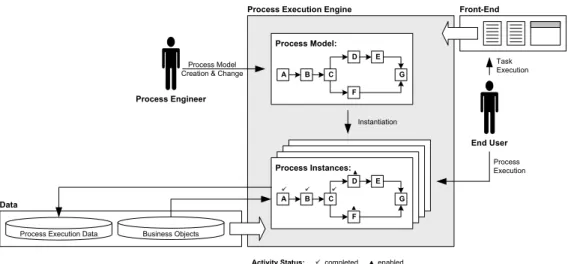
In general, PAISs orchestrate processes of a particular type (e.g., handling of a cus- tomer order) based on a predefinedprocess model. Such a model defines thetasks to be executed (i.e., activities), theirdependencies (e.g., control and data flow), theorganiza- tional entitiesperforming these tasks (i.e.,process users), and thebusiness objectswhich provide or store activity data. Unlike conventional information systems, PAISs strictly separate process logic from application code [19]; i.e., PAISs are driven by process models rather than program code (cf. Fig. 3). Consequently, PAISs are realized based on process engines which orchestrate processes and their activities during run-time [20]. Typically, a process engine also provides generic functionality for the modeling and monitoring of processes, e.g., for accomplishing process analysis. Earlier empirical work confirms that PAISs enable a fast and cost-effective implementation as well as customization of business processes [21].
Realizing PAISs also implies a significant shift in the field of information systems engineering. Traditional engineering methods and paradigms (e.g., object-oriented design and programming) have to be supplemented with engineering principles and software technologies particularly enhancing the operational support of business processes (e.g., workflow management, case handling, and service orchestration). This is crucial to tie up those requirements neglected by current information systems so far.
2.2. Paradigms for Orchestrating Business Processes and their Activities
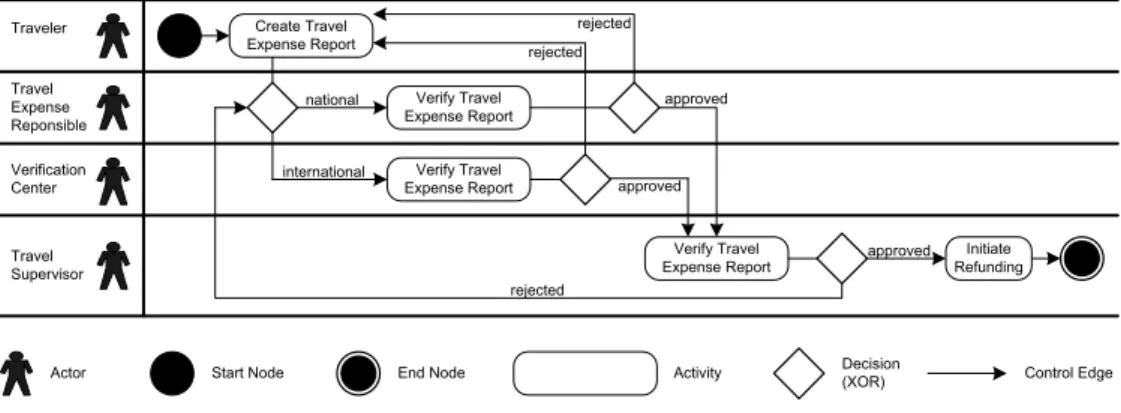
Assume that a business process for refunding traveling expenses - in the following denoted aseTravel business process - is to be supported by a PAIS which is realized using BPM
technology. TheeTravel business process is used throughout the paper and is part of the material used for our experiment. It distinguishes between four organizational roles (cf.
Fig. 1). Thetraveler initiates the refunding of his expenses. For this purpose, he has to summarize the travel data in atravel expense report. This report is then forwarded either to a travel expense responsible (in case of a national business trip) or to averification center (in case of an international business trip).
Both thetravel expense responsibleand theverification centerfulfill the same task, i.e., they verify a received travel expense report. “Verification” means that the declared travel data is checked for correctness and plausibility (e.g., regarding accordance with receipts).
An incorrect travel expense report is sent back to the traveler (for correction). If it is correct, it will be forwarded to the travel supervisor for final approval. The supervisor role may be filled, for example, by the line manager of the traveler. If a travel expense report is approved by the supervisor, the refunding will be initiated. Otherwise, it will be sent back to either the travel expense responsible (national trip) or the verification center (international trip). Note that this is a characteristic (yet simplified) process as it can be found in many organizations.
Create Travel Expense Report
Verify Travel Expense Report
Verify Travel Expense Report Traveler
Travel Expense Reponsible
Verification Center
Travel Supervisor
Verify Travel Expense Report rejected
approved
approved rejected national
international
Initiate Refunding rejected
approved
Actor Activity Decision
(XOR)
Start Node End Node Control Edge
Fig. 1. The eTravel Business Process (modeled as UML Activity Diagram).
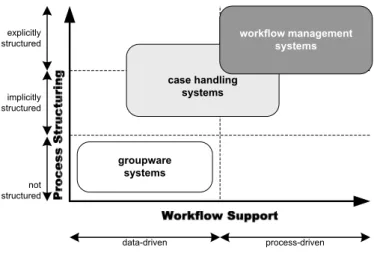
When realizing a PAIS which supports this process, one challenge is to select the most suitable BPM technology for this purpose. Currently, there exist various BPM approaches, which can be categorized as shown in Fig. 2. Basically, one distinguishes betweengroup- ware systems, workflow management systems, and case handling systems. Groupware systems aim at the support of unstructured processes including a high degree of personal communication. As groupware systems are not suitable for realizing PAISs, they are not further discussed in this paper. Workflow management systems (WfMSs), in turn, are best suited to support business processes which are well structured and have a high de- gree of repetition (e.g., procurement processes or clearance processes). Often, they are combined with an additional solution to integrate business processes within and across enterprises. Case handling systems (CHSs), in turn, are more flexible than traditional WfMSs [22], but are not suited for integrating heterogeneous application systems. In addition, for fully automated business procesess (i.e., processes without the need for hu- man interaction), CHSs are not the proper choice. Both workflow management and case handling are well suited for realizing administrative processes like our eTravel business process.
case handling systems
data-driven process-driven
groupware systems not
structured implicitly structured explicitly structured
workflow management systems
Fig. 2. Process Management Paradigms.
In the following workflow management as well as case handling are briefly introduced (for a detailed qualitative comparison of both paradigms we refer to [22]).
Workflow Management. Contemporary workflow management systems (WfMSs) enable the modeling, execution, and monitoring of business processes [4]. When work- ing on a particular activity (i.e., process step), typically, in a WfMS-based PAIS only data needed for executing this activity is visible to respective actors, but no other work- flow data. This is also known as “context tunneling” [13]. WfMSs coordinate activity execution based on routing rules, which are described by process models and which are strictly separated from processed data (cf. Fig. 3). If an activity is completed, subsequent activities will become active according to the logic defined by the used process model.
Accompanying this, the worklists of potential actors are updated accordingly. Finally, for (administrative) processes electronic forms are typically used to implement activities and to present data being processed.
Case Handling. An alternative BPM paradigm is provided by case handling [13].
A case handling system (CHS) aims at more flexible process execution by avoiding re- strictions known from (conventional) workflow technology (cf. Fig. 4). Examples of such restrictions include rigid control flow and the aforementioned context tunneling. The central concepts behind a CHS are thecaseand its data as opposed to the activities and routing rules being characteristic for WfMSs. One should think of a “case” as being the product which is “manufactured” by executing the workflow process. The characteristics of the product should drive the workflow. Typically, the product is information, e.g., a decision based on various data. By focusing on the product characteristics, one can replace push-oriented routing from one worktray to another by pull-oriented mechanisms centered around the data objects relevant for a case.
Usually, CHSs present all data about a case at any time to the user (assuming proper authorization), i.e., context tunneling as known from WfMSs is avoided. Furthermore, CHSs orchestrate the execution of activities based on the data assigned to a case. Thereby, different kinds of data objects are distinguished (cf. Fig. 4). Free data objects are not explicitly associated with a particular activity and can be changed at any point in time during a case execution (e.g., Data Object 3 in Fig. 4).Mandatoryandrestricted data ob-
Process Model:
A B C
D
F E
G
Process Instances:
A B C
D
F E
G Instantiation
End User Process Execution Process Engineer
Process Model Creation & Change
Process Execution Engine Front-End
Data
Task Execution
Business Objects Process Execution Data
completed enabled Activity Status:
Fig. 3. Architecture of a Workflow Management System.
jects, in turn, are explicitly linked to one or more activities. If a data object is mandatory for an activity, a value will have to be assigned to it before the activity can be completed (e.g., Data Object 5 in Fig. 4). If a data object is restricted for an activity, this activity needs to be active in order to assign a value to the data object (e.g., Data Object 6 in Fig. 4). As in WfMSs, forms linked to activities are used to provide context-specific views on case data. Thereby, a CHS does not only allow assigning an execution role to activities, but also a redo role (to undo an executed activity) and a skip role (to omit the execution of activities). User 2 in Fig. 4, for example, may execute Activities 3, 4, 5 and 6, and redo Activities 2 and 3.
mandatory data object restricted data object Activity 1 Activity 2
Activity 3
Activity 4
Activity 6 Data
Object 1 Data Object 2
Data Object 4
Data Object 5 Data
Object 3
Data Object 7 Data
Object 6
form
User 1 User 2
execute role redo role
active activity
Possible Actions of User 2:
- Activity 4 can be executed Current Situation:
- Activity 4 is active
- Data Objects 1,2,3 and 4 are available, i.e., values for the data objects have been entered
Activity 5
- Activity 2 can be redone at any time - Activity 3 cannot be executed CONSTRAINT
- Activity 5 cannot be executed CONSTRAINT - Activity 6 cannot be executed CONSTRAINT
Constraints:
- Activity 3 can be completed if Data Object 5 is available - Activity 5 can be executed if Activities 3 and 4 is completed - Activity 6 can be executed if Activity 5 is completed
available Data Objects not available Data Objects
available data object not available data object
Fig. 4. Data-driven Case Handling.
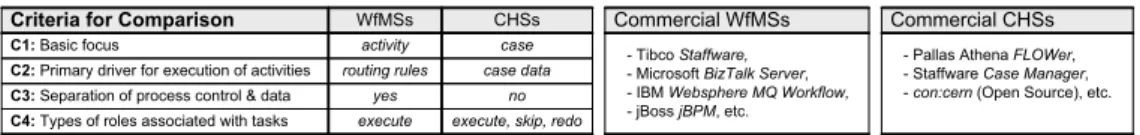
Fig. 5 summarizes the major conceptual differences between workflow management and case handling, and additionally depicts characteristic representatives of each paradigm.
Despite conceptual differences, both paradigms are suited for implementing adiministra- tive business processes as oureTravel business process.
C1:Basic focus
CHSs C2:Primary driver for execution of activities
C4:Types of roles associated with tasks C3:Separation of process control & data
case case data
execute, skip, redo no Criteria for Comparison WfMSs
activity routing rules
execute yes
- Tibco Staffware, - Microsoft BizTalk Server, - IBM Websphere MQ Workflow, - jBoss jBPM, etc.
- Pallas Athena FLOWer, - Staffware Case Manager, -con:cern(Open Source), etc.
Commercial WfMSs Commercial CHSs
Fig. 5. Selected Criteria for Comparing Workflow Management and Case Handling.
3. Experimental Definition and Planning
This section deals with the definition and planning of our experiment. Section 3.1 explains its context and Section 3.2 describes its setup. Section 3.3 presents considered hypotheses.
Section 3.4 explains the specific design of our experiment. Factors threatening the validity of experimental results as well as potential mitigations are discussed in Section 3.5. For setting up and describing our experiment we follow the recommendations given in [23,24].
We strongly believe that the design of our experiment can be applied in similar form to many other BPM related scenarios.
3.1. Context Selection
With workflow management and case handling we have introduced two paradigms for realizing PAISs in Section 2.2. Usually, the selection of “the most suitable” BPM tech- nology for implementing a PAIS depends on project-specific requirements. While some IT managers will consider BPM technology as sufficient if best practices are available, others will take into account more specific selection criteria like the support of a sufficient degree of process flexibility. Likewise, IT managers are interested in value-based consid- erations as well [17]. In practice, for example, a frequently asked question is as follows:
Is there a difference in the effort needed for implementing a business process either with BPM technology A or BPM technology B and - if “yes” - how strong is this difference?
Currently, IT managers typically have to rely on vendor data (e.g., about the return-on- investment of their products), experience reports, and criteria for qualitative comparisons as provided by workflow patterns [5] or process change patterns [7]. What has been not available so far are precise quantitative data regarding the use of workflow management technology and case handling systems respectively (e.g., concerning the effort for im- plementing processes) [16,25,17]. To generate quantitative data, and thus to complement existing qualitative criteria, controlled software experiments offer promising perspectives.
In the following, we pick up this idea and describe an experiment in which we investigate the effort related to the implementation and adaptation of business processes using either a WfMS or a CHS.
The main goal of our experiment is to compare the implementation effort of WfMSs and CHSs. Using the Goal Quality Metric (GQM) template for goal definition [26], the goal of our experiment is defined as follows:
Compare workflow management and case handling technology for the purpose of evaluating
with respect to their implementation effort from the point of view of the researchers
in the context of Bachelor and Master of Computer Science students at the University of Innsbruck
Fig. 6. Goal of our Experiment
3.2. Experimental Setup
This section describes the subjects, objects and selected variables of our experiment, and presents the instrumentation and data collection procedure.
Subjects: Subjects are 48 students of a combined Bachelor/Master Computer Science course at the University of Innsbruck. All subjects have a similar level of experience.
They are taught about workflow management and case-handling in an introductionary session preceeding the execution of our experiment.
Object: The object to be implemented is the eTravel business process (cf. Section 2).
Its specification comprises two parts: an initial “Base Implementation” (Part I) and an additional “Change Implementation” (Part II). While the first part deals with the realization of the process support for refunding national business trips, the second one specifies a process change, namely, additional support for refunding international busi- ness trips. Both parts describe the elements to be implemented; i.e., the process logic, user roles, and the data to be presented to actors using simple electronic forms. Note that this experimental design does not only enable us to investigate the effort for (initially) implementing a business process, but also to examine the effort for subsequent process changes. In our experiment, with “process change” we mean the adaptation of the im- plemented business process. After having realized such a process change new process instances can be based on the new process model. We do not investigate the migration of running process instances to the new process schema in this context [27].
Factor & Factor Levels: In our experiment,BPM technology is the considered factor with factor levels “WfMS” and “CHS”. Thereby, we use TibcoStaffware [14] (Version 10.1) as typical and widely applied representative of workflow technology. Its build-time tools include, among other components, a visual process modeling tool and a graphical form editor. The used CHS, in turn, isFLOWer [15] (Version 3.1), the most widely used commercial CHS. Like Staffware, FLOWer provides a visual process modeling tool and a form editor.
Response Variable: In our experiment the response variable is the implementation
effort the subjects (i.e., the students) need for implementing the given object (i.e., the eTravel specification) with each of the factor levels (WfMS and CHS). All effort values related to the Staffware implementation are denoted as “WfMS Sample”, while all effort values related to the FLOWer implementation are called “CHS Sample”.
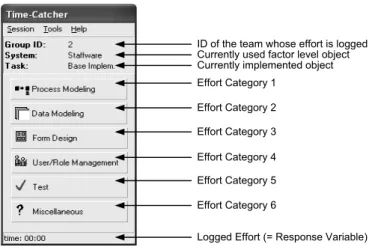
Instrumentation: To precisely measure the response variable, we have developed a tool calledTimeCatcher (cf. Fig. 7). This “stop watch” allows logging time in six typical
“effort categories” related to the development of a process-oriented application: (1)pro- cess modeling, (2)data modeling, (3)form design, (4)user/role management, (5)testing, and (6)miscellaneous effort. To collect qualitative feedback as well (e.g., concerning the maturity or usability of the applied WfMS and CHS), we use a structuredquestionnaire.
Effort Category 1 Effort Category 2 Effort Category 3 Effort Category 4 Effort Category 5 Effort Category 6
Currently implemented object Currently used factor level object ID of the team whose effort is logged
Logged Effort (= Response Variable)
Fig. 7. TimeCatcher Tool.
Data Collection Procedure: The TimeCatcher tool is used by the students during the experiment. The aforementioned questionnaire is filled out by them after completing the experiment.
Data Analysis Procedure: For data analysis well-established statistical methods and standard metrics are applied (cf. Section 4.3 for details).
3.3. Hypothesis Formulation
Based on the goal of our experiment the following hypotheses are derived:
Differences in Implementation Effort: In our experiment we investigate whether the used BPM technology has an influence on the response variableimplementation ef- fort.
Does the used BPM technology have an influence on the response variable
“implementation effort”?
Null hypothesis H0,1: There is no significant difference in the effort values when using workflow technology compared to case handling technology.
Alternative hypothesis H1,1: There is a significant difference in the effort values when using workflow technology compared to case handling technology.
Learning Effects: Our experiment further investigates learning effects that might occur when implementing the same business process twice with two different BPM technolo- gies. In particular, we aim at determining the influence of domain knowledge on imple- mentation effort. When implementing the eTravel business process with the first BPM technology the process specification is unknown to all subjects. When implementing the respective process with the second BPM technology, however, its specification is already known.
Does knowledge of the process specification have an influence on the response variable “implementation effort”?
Null hypothesisH0,2:Domain knowledge does not have a statistically sig- nificant impact on the mean effort values for implementing a business process.
Alternative hypothesisH1,2: Domain knowledge has a statistically signifi- cant impact on the mean effort values for implementing a business process.
3.4. Experimental Design
Literature about software experiments provides various design guidelines for setting up an experiment [28,23,21,8,29].First, the design of an experiment should allow the collection of as much data as possible with respect to the major goals of the experiment.Second, collected data should be unambiguous. Third, the experiment must be feasible within the given setting (e.g., within the planned time period). Note that meeting these design criteria is not trivial. Often, an experiment cannot be accomplished as planned due to its complex design or due to an insufficient number of participants [8].
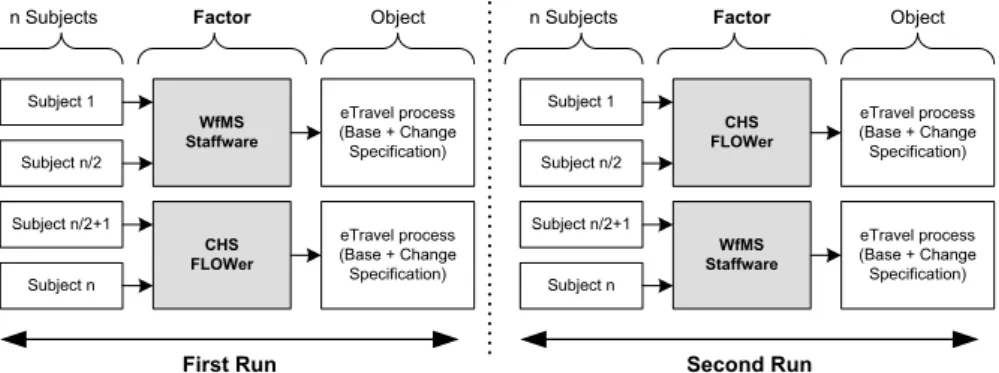
Considering these design criteria, we accomplish our experiment as a balanced single factor experimentwithrepeated measurement (cf. Fig. 8). This design is particularly suit- able for comparing software development technologies [21]. Our experiment is denoted a single factor experiment since it investigates the effects of onefactor1 (i.e., a particular BPM technology) on a commonresponse variable (e.g., implementation effort). Our ex-
1 Multi-factor experiments, by contrast, investigate the effects of factor combinations on a common response variable, e.g., effects of a software development technology and a software development process on implemen- tation effort. Even though such experiments can improve the validity of experimental results, they are rarely applied in practice due to their complexity [30].
periment design also allows us to analyze variations of a factor calledfactor levels (i.e., the two BPM tools Staffware and FLOWer). The response variable is determined when the participants of the experiment (i.e. subjects) apply the factor or factor levels to an object (i.e., the base and the change specification of the eTravel business process).
We denote our experiment asbalanced as all factor levels are used by all participants of the experiment. This enablesrepeated measurements and thus the collection of more precise data since every subject generates data for every treated factor level. Generally, repeated measurements can be realized in different ways. We use a frequently applied variant which is based on two subsequentruns(cf. Fig. 8). During thefirst runhalf of the subjects apply “Staffware” to the treated object, while the other half uses “FLOWer”.
After having completed the first run, thesecond run begins. During this second run each subject applies that factor level to the object not treated so far.
WfMS Staffware Subject 1
eTravel process (Base + Change Specification) Subject n/2
Subject n/2+1
Subject n
Zeichen
n Subjects Zeichen
Factor Zeichen Object
CHS FLOWer
eTravel process (Base + Change Specification)
CHS FLOWer Subject 1
eTravel process (Base + Change
Specification) Subject n/2
Subject n/2+1
Subject n
Zeichen
n Subjects Zeichen
Factor Zeichen Object
WfMS Staffware
eTravel process (Base + Change
Specification)
First Run Second Run
Fig. 8. Design of our Single Factor Experiment.
In our experiment subjects are not working on their own, but are divided into 4 main groups each consisting of 4teams with 3 students (cf. Fig. 9). This results in an overall number of 16 teams. The students are randomly assigned to teams prior to the start of the experiment.
Team 11 Team 13 Team 14 Team 16
Main Group 1 Main Group 2 Main Group 3 Main Group 4
16 Teams
Team 01 Team 02 Team 05 Team 06
Team 03 Team 04 Team 07 Team 08
Team 09 Team 10 Team 12 Team 15
1st Run:
WfMS --- 2nd Run:
CHS
1st Run:
WfMS --- 2nd Run:
CHS 1st Run:
CHS --- 2nd Run:
WfMS
1st Run:
CHS --- 2nd Run:
WfMS WfMS = Workflow Management System, CHS = Case Handling System
Fig. 9. Main Groups and Teams.
The mathematical model of our experiment can be summarized as follows: n subjects S1, ..., Sn (n∈IN) divided into m teams T1, ..., Tm(m∈IN, m≥2, m even) have to im- plement theeTravel business process. The respective specification describes a “Base Im- plementation”O1(corresponding to the “national case” of theeTravel business process) and a “Change Implementation”O2 (additionally introducing the “international case”).
During the experiment one half of the teams (T1, ..., Tm/2) implements the complete spec- ification (i.e., base and change implementation) using a WfMS (P M S1, Staffware), while the other half (Tm/2+1, ..., Tm) accomplishes this implementation using a CHS (P M S2,
FLOWer). After finishing the implementation with the first factor level (i.e., the first run), each team has to implement the eTravel process using the second factor level in a second run (i.e., the development technologies are switched). The response variable
“Effort[Time] of Tm implementing Oi using P M Sj” is logged with the TimeCatcher tool.
3.5. Risk Analysis and Mitigations
When accomplishing experimental research related risks have to be taken into account as well. Generally, there exist factors that threaten both theinternal validity (“Are the claims we made about our measurements correct?”) and the external validity (“Can we justify the claims we made?”) of an experiment.
In our context, threats to internal validity are as follows:
- People: The students participating in our experiment differ in their skills and produc- tivity for two reasons: (i) general experience with software development might differ and (ii) experience with BPM technology might not be the same. The first issue can only be balanced by conducting the experiment with a sufficiently large and represen- tative set of students. The number of 48 students promises to achieve such balance.
The second issue can be mitigated by using BPM tools unknown to every student. Only three of the participating students had rudimentary workflow knowledge beforehand.
As this knowledge might influence experimental results, we have assigned those three students to different teams to minimize potential effects as far as possible. All other students have been randomly assigned to groups.
- Data collection process: Data collection is one of the most critical threats. Therefore we have to continuously control data collection during the experiment through close supervision of the students. We further have to ensure that students understand which TimeCatcher categories have to be selected during the experiment.
- Time for optimizing an implementation: The specification to be implemented does not include any guideline concerning the number of electronic forms or their lay- out. This implies the danger that some teams spend more time for implementing a
“nice” user interface than others do. To minimize such effects, we explicitly indicate to the students that the development of a “nice” user interface is not a goal of our ex- periment. To ensure that the implemented solutions are similar across different teams, we accomplish acceptance tests.
Besides, there are threats to the external validity of experimental results:
- Students instead of professionals: Involving students instead of IT professionals constitutes a potential threat to the external validity of our experiment. However, the experiment by [32] evaluating the differences of students and IT professionals suggests that results of student experiments are (under certain conditions) transferable and can provide valuable insights into an analyzed problem domain. Furthermore, Runeson [31]
identifies a similar improvement trend when comparing freshman, graduate and profes- sional developers. Also note that the use of professional developers is hardly possible in
practice as profit-oriented organizations will not simultaneously implement a business process twice using two different BPM technologies. In addition, using professionals instead of students would also be not entirely free of bias. In particular, it would be very difficult to find professionals which are equally experienced with both systems under investigation.
- Investigation of tools instead of concepts: In our experiment, BPM tools are used as representatives for the analyzed concepts (i.e., workflow management and case handling). Investigating the concepts therefore always depends on the quality of the used tools. To mitigate this risk, the used BPM technologies should be representative for state-of-the-art technologies in practice (which is the case as both selected BPM tools are widely used representatives of workflow technology and case handling systems respectively).
- Choice of object: To mitigate the risk that the chosen business process is favouring one of the two BPM paradigms (i.e., case handling or workflow management), we have picked a business process that can be found in many organizations; i.e., the eTravel business process (cf. Section 2). However, additional experiments are needed to assess how far our results can be generalized to different types of business processes.
Furthermore, one may argue that the use of UML activity diagrams can threaten the validity of the experiment as these diagrams are similar to the more explicit, flow- driven notation of Staffware process models, but different from the more implicit, data-driven FLOWer process models. However, in practice, UML activity diagrams (or other activity-centered diagramming techniques like Event-Driven Process Chains or BPMN) are widely used to describe standard business processes [33]. Thus, the use of UML activity diagrams can even improve internal validity as a typical practical scenario is investigated.
4. Performing the Experiment
This section deals with the preparation and execution of the experiment (cf. Section 4.1).
It further covers the analysis and interpretation of the experimental data (cf. Section 4.2).
Finally, it includes a discussion of experimental results (cf. Section 4.3).
4.1. Experimental Operation
Preparation of the Experiment: In the run-up of the experiment, we prepared a technical specification of theeTravel business process. This specification comprised UML activity diagrams, an entity relationship diagram describing the generic data structure of a travel expense report, and tool-specific data models for the considered systems (Staffware, FLOWer). To ensure that the specification is self-explanatory and correct we involved two student assistants in its development.
Before the experiment took place, the same two students implemented the specifica- tion with each of the utilized BPM technologies. This allowed us to ensure feasibility of the general setup of our experiment and to identify critical issues with respect to the performance of the experiment. This pre-test also provided us with feedback that helped to further improve comprehensibility of our specification. Finally, we compiled a “starter kit” for each participating team. It included original tool documentation, additional doc-
umentation created by us when preparing the experiment (and which can be considered as a compressed summary from the original documentation), and the technical process specification.
Experimental Execution: Due to infrastructure limitations, the experiment was split up in two events. While the first one took place in October 2006, the second one was conducted in January 2007. Each event lasted 5 days, involved 24 participants (i.e., students), and was based on the following procedure: Prior to the start of the experiment, all students had to attend an introductory lecture. We introduced to them basic notions of workflow management and case handling. During this lecture we further inform them about the goals and rules of the experiment. Afterwards, each team received its “starter kit”. Then, the students had to implement the giveneTravel business processspecification with both considered factor levels. Thereby, an implmenentation will be only considered as completed, if the students successfully pass the acceptance test. This ensured that all developed solutions correpond to the specification and were implemented correctly.
After finishing their work on the experiment, students filled out the aforementioned questionnaire.
We further optimized the results of our experiment by applyingAction Research [35].
Action Research is characterized by an intensive communication between researchers and subjects. At an early stage we optimized the data collection process by assisting and guid- ing the students in using the TimeCatcher tool properly (which is critical with respect to the quality of the gathered data). In addition, we documented emotional reactions of the students regarding their way of working. This helped us to design the questionnaire. Note that Action Research did not imply any advice for the students on how to implement theeTravel business process.
Data Validation: After conducting the experiment the data gathered by the teams using the TimeCatcher tool was checked. We discarded the data of two teams as it was flawed. Both teams had made mistakes using the TimeCatcher tool. Finally, the data provided by 14 teams was considered in our data analysis.
4.2. Data Analysis and Interpretation
We now deal with the analysis of gathered data and the interpretation of results.
4.2.1. Raw Data and Descriptive Analysis
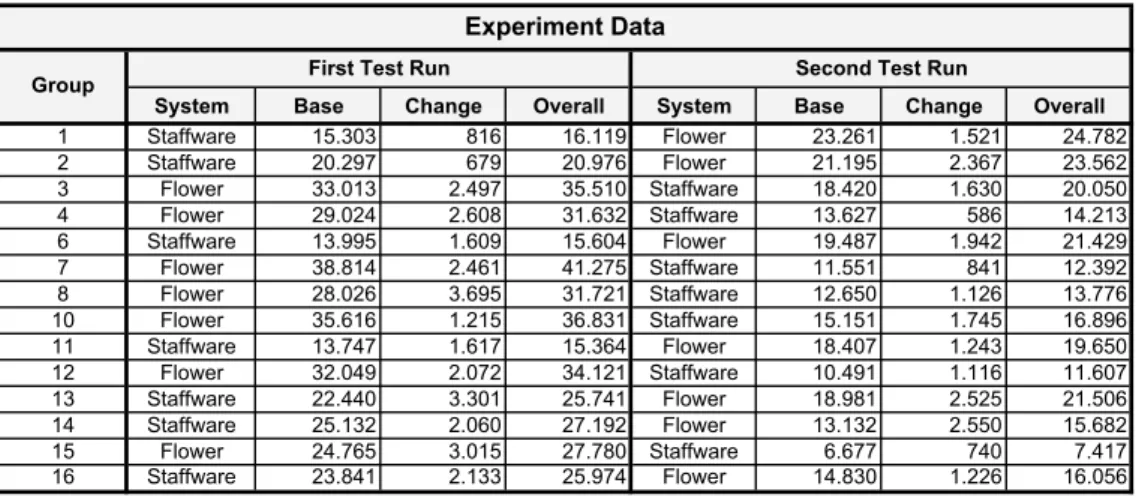
Fig. 10 presents the raw data obtained from our experiment. For both test runs it shows the effort values for the base and the change implementation as well as the overall im- plementation effort1 (measured in seconds). In the raw data table the values for the different effort categories (i.e., process modeling, data modeling, form design, user/role management, test, and miscelleneous) are accumulated.
1 The overall implementation effort is calculated as the sum of the base implementation effort and the change implementation effort.
System Base Change Overall System Base Change Overall
1 Staffware 15.303 816 16.119 Flower 23.261 1.521 24.782
2 Staffware 20.297 679 20.976 Flower 21.195 2.367 23.562
3 Flower 33.013 2.497 35.510 Staffware 18.420 1.630 20.050
4 Flower 29.024 2.608 31.632 Staffware 13.627 586 14.213
6 Staffware 13.995 1.609 15.604 Flower 19.487 1.942 21.429
7 Flower 38.814 2.461 41.275 Staffware 11.551 841 12.392
8 Flower 28.026 3.695 31.721 Staffware 12.650 1.126 13.776
10 Flower 35.616 1.215 36.831 Staffware 15.151 1.745 16.896
11 Staffware 13.747 1.617 15.364 Flower 18.407 1.243 19.650
12 Flower 32.049 2.072 34.121 Staffware 10.491 1.116 11.607
13 Staffware 22.440 3.301 25.741 Flower 18.981 2.525 21.506
14 Staffware 25.132 2.060 27.192 Flower 13.132 2.550 15.682
15 Flower 24.765 3.015 27.780 Staffware 6.677 740 7.417
16 Staffware 23.841 2.133 25.974 Flower 14.830 1.226 16.056
Experiment Data
Group First Test Run Second Test Run
Fig. 10. Raw Data Obtained from the Experiment.
Based on this raw data we calcluate descriptive statistics for our response variable im- plementation effort (cf. Fig. 11). When analyzing Fig. 11 one can observe the following:
– The mean effort values for FLOWer are higher than those for Staffware. This obser- vation holds for the overall implementation effort as well as for the base and change implementations. Obviously, this means that implementation effort are smaller for the WfMS Staffware when compared to the CHS FLOWer.
– The mean effort values for the base implementation are much higher than those for the change implementation for both Staffware and FLOWer.
– The effort values for implementing theeTravel business process using FLOWer in the first test run are higher than those for using FLOWer in the second test run.
– The effort values for implementing theeTravel business process using Staffware in the first test run are higher than those for using Staffware in the second test run.
4.2.2. Data Plausibility
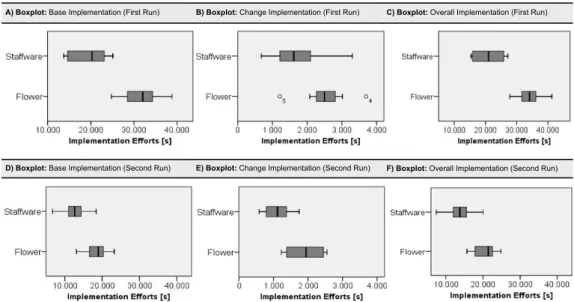
We analyze data plausibility based onbox-whisker-plot diagrams. Such diagrams visualize the distribution of a sample and particularly show outliers. A low number of outliers indicates plausible data distributions of the base implementation effort in our experiment.
The diagram takes the form of a box that spans the distance between the 25% quantile and the 75% quantile (the so calledinterquantile range) surrounding the median which splits the box into two parts. The “whiskers” are straight lines extending from the ends of the box. As such, the length of a whisker is at most 1.5 times the interquartile range.
All results outside the whiskers can be considered as outliers. As can be seen in Fig. 12A, there are no outliers regarding thebaseimplementation effort for the first test run; i.e., all data from these samples lie within the boxed area. However, there exist two outliers (i.e., o4 and o5) in the distribution of thechange implementation effort for the first test run (cf. Fig. 12B), and no outliers regarding the distribution of the overallimplementation effort for the first test run (cf. Fig. 12C). For the second test run no outliers can be identified at all (cf. Fig. 12D-F).
System Object Test Run N Minimum Maximum Mean Standard Deviation
1st Time [s] 7 24.765 38.814 31.615,29 4.769,575
2nd Time [s] 7 13.132 23.261 18.470,43 3.498,155
Total Time [s] 14 13132 38814 25042,86 7916,249
1st Time [s] 7 1.215 3.695 2.509,00 768,146
2nd Time [s] 7 1.226 2.550 1.910,57 586,197
Total Time [s] 14 1.215 3.695 2.209,79 726,184
1st Time [s] 7 27.780 41.275 34.124,29 4.332,368
2nd Time [s] 7 15.682 24.782 20.381,00 3.492,184
Total Time [s] 14 15.682 41.275 27.253 8.071
1st Time [s] 7 13.747 25.132 19.250,71 4.837,774
2nd Time [s] 7 6.677 18.420 12.652,43 3.697,932
Total Time [s] 14 6.677 25.132 15.951,57 5.369,811
1st Time [s] 7 679 3.301 1.745,00 885,549
2nd Time [s] 7 586 1.745 1.112,00 439,266
Total Time [s] 14 586 3.301 1.428,50 747,577
1st Time [s] 7 15.364 27.192 20.995,71 5.327,046
2nd Time [s] 7 7.417 20.050 13.764,43 4.007,169
Total Time [s] 14 7.417 27.192 17.380,07 5.881,059
Staff
Overall Base
Change
Descriptive Statistics
Flower
Overall Base
Change
Fig. 11. Descriptive Statistics for Response Variable.
A) Boxplot: Base Implementation (First Run)
D) Boxplot: Base Implementation (Second Run)
B) Boxplot: Change Implementation (First Run) C) Boxplot: Overall Implementation (First Run)
E) Boxplot: Change Implementation (Second Run) F) Boxplot: Overall Implementation (Second Run)
Fig. 12. Data Distribution (Box-Whisker-Plot Diagrams).
4.2.3. Testing for Differences in Implementation Effort
In this section we describe the data analysis for our Hypothesis H0,1. We analyze this 0-hypothesis based on a two-sided t-test [30] (and an additional sign test if the t-test fails). Doing so, we are able to assess whether the means of the WfMS sample and the CHS sample are statistically different from each other. A successful t-test (with|T|> t0
where T is the observed t-statistic and t0 is a predefined value depending on the size of samplexand significance level α) rejects our 0-hypothesis. Specifically, the following steps (1) - (4) have to be executed in order to accomplish a t-test (withα= 0.05 as the level of significance):
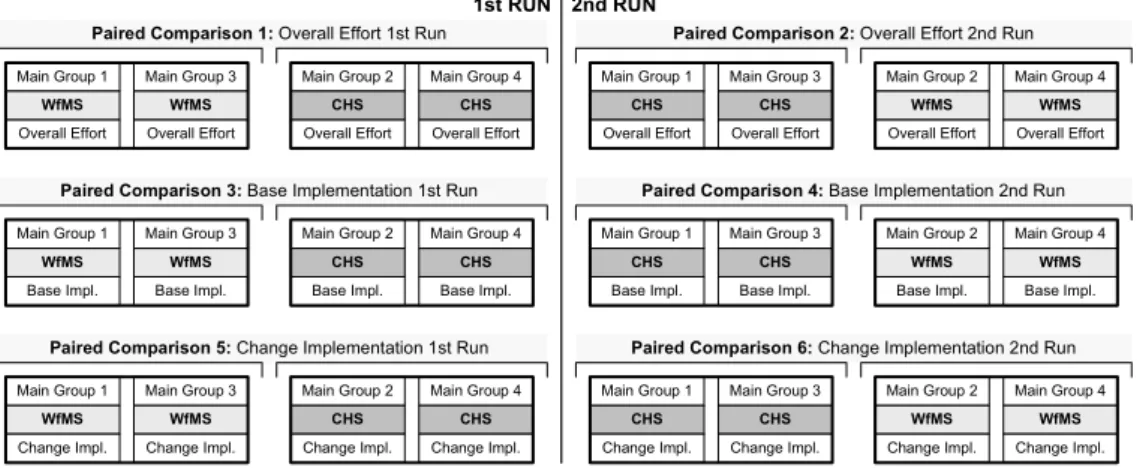
(1) Paired Comparison: The t-test is combined with apaired comparison [30], i.e., we analyze “pairs of effort values”. Each pair comprises one effort value from the WfMS sample and one from the CHS sample. Note that we compose pairs according to the performance of the teams, i.e., effort values of “good” teams are not combined with effort values of “bad” teams (cf. [21]). Paired Comparison 1 in Fig. 13, for example, combines effort values from Main Groups 1 and 3 with effort values from Main Groups 2 and 4 (precise pairs are shown in Fig. 14).
Main Group 1 Main Group 3 Main Group 2 Main Group 4
WfMS WfMS CHS CHS
1st RUN
Overall Effort Overall Effort Overall Effort Overall Effort
2nd RUN Paired Comparison 1: Overall Effort 1st Run
Main Group 1 Main Group 3 Main Group 2 Main Group 4
WfMS WfMS
CHS CHS
Overall Effort Overall Effort Overall Effort Overall Effort Paired Comparison 2: Overall Effort 2nd Run
Main Group 1 Main Group 3 Main Group 2 Main Group 4
WfMS WfMS CHS CHS
Base Impl. Base Impl. Base Impl. Base Impl.
Paired Comparison 3: Base Implementation 1st Run
Main Group 1 Main Group 3 Main Group 2 Main Group 4
WfMS WfMS
CHS CHS
Base Impl. Base Impl. Base Impl. Base Impl.
Paired Comparison 4: Base Implementation 2nd Run
Main Group 1 Main Group 3 Main Group 2 Main Group 4
WfMS WfMS CHS CHS
Change Impl. Change Impl. Change Impl. Change Impl.
Paired Comparison 5: Change Implementation 1st Run
Main Group 1 Main Group 3 Main Group 2 Main Group 4
WfMS WfMS
CHS CHS
Change Impl. Change Impl. Change Impl. Change Impl.
Paired Comparison 6: Change Implementation 2nd Run
Fig. 13. Paired Comparison.
(2) Standardized Comparison Variable: For each pair, astandardized comparison variable Xj is derived. It is calculated by dividing the difference of the two com- pared effort values by the first effort value:
Xj:= EF F ORTj+m/2−EF F ORTj
EF F ORTj+m/2
·100%
In other words,Xjdescribes how much effort teamTj saves using workflow techno- logy when compared to teamTj+m/2which uses case handling technology. Together, all Xj constitute a standardized comparison sample x = (X11, ..., X1m/2), which we use as basis when performing the t-test.
(3) Statistical Measures: For the standardized comparison samplexwe calculate its median(m),interquantile range (IQR),expected value(µ),standard deviation(σ), andskewness (sk).
(4) Two-sided t-Test: Finally, we apply the t-test to x. Note that the t-test will be only applicable if x is taken from a normal distribution and the WfMS and CHS sample have same variance. The first condition can be tested using the Kolmogorov/Smirnov test[34]. In particular, the result of this test has to be smaller thanK0(withK0being a predefined value depending on the size ofxand the cho- sen significance level α). The second condition can be tested using the test for identical variance [34]. The variance of the WfMS and CHS sample will be identi-
cal, if the result of this test is smaller than F0 (withF0 being a predefined value depending on the size of the samples and the chosen significance levelα).
Fig. 14A shows the results of our analysis regarding overall implementation effort.
When studying the effort for the workflow implementation, we can see that they are lower than the ones for the case handling implementation. This difference is confirmed by the results of the (successful) t-tests for both the first and the second run, i.e., our 0- hypothesisH0,1 is to be rejected. In the first run, the use of workflow technology results in effort savings of 43.04% (fluctuating between 27.51% and 50.81%) when compared to the effort for using CHS-based technology. In the second run, the use of workflow technology still results in savings of 28.29% (fluctuating between 11.48% and 53.16%).
Fig. 14B and Fig. 14C show results for thebase implementation as well as the change implementation. Again, our results allow the rejection of the 0-hypothesisH0,1(the failed t-test can be compensated with a successfulsign test). Using workflow technology results in effort savings of 43.01% for the base implementation in the first run (fluctuating between 32.03% and 50.06%). In the second run, the use of workflow technology results in effort savings of 28.52% when compared to case handling effort. Regarding the change implementation the use of workflow technology results in effort savings of 44.11% in the first run (fluctuating between 16.29% and 56.45%) and 40.46% in the second run.
Fig. 15 illustrates that the obtained effort of the WfMS sample are smaller for all six effort categories when compared to the CHS sample.
The additional analysis of our questionnaire provides possible explanations for these differences. Fig. 16A shows that the concepts underlying workflow technology seem to be easier to understand, i.e., the case handling paradigm is considered as being more difficult. Finally, Fig. 16B deals with the usability of the applied process management systems. The subjective results obtained from the questionnaire show that the students perceive Staffware as beeing more user-friendly when compared to FLOWer.
Based on the results of the questionnaire we asume that the observed differences in implementation effort between case handling and workflow technology are (1) due to conceptual differences (i.e., the case handling concept was perceived as being more com- plicated) and (2) due to differences in the tools (i.e., the used case handling system FLOWer is perceived as being less user-friendly). Further experiments with different designs are needed to confirm these assumptions.
4.2.4. Testing for Learning Effects
To investigate learning effects we compare the effort values of the groups using Staffware in the first run with those groups using Staffware in the second test run. In addition, we repeat this procedure for FLOWer.
As all preconditions for the t-test are met (samples are normally distributed and have same variance), we test 0-hypothesisH0,2 regarding the learning effects using the t-test (withα= 0.05 as the level of significance). The t-test reveals that there is a statistically significant difference between effort values for the first test run and for the second one.
Fig. 17A and Fig. 17B show the results for FLOWer and Staffware in respect to overall implementation effort. When comparing the effort values for the two test runs, it can be observed that for both systems the effort for the first run are generally higher than those for the second run. Regarding FLOWer in the second run even the slowest group is
A) Paired Comparison (Overall Efforts)
0 2 0 4 0 6 0 8 0 10 0 12 0
11|15 6 |8 1|12 16 |4 14 |7 2 |10 13 |3 15 |11 8 |6 12 |1 4 |16 7 |14 10 |2 3 |13 WfMS CHS 1st run
Statistical Data
Paired Comparison 1 Paired Comparison 2
2nd run
= 43.048
= [27.51 ; 50.81]
first run second run
IQR
m
= 38.6896
= 12.7703
= 28.2913
= [11.48 ; 53.16]
IQR
m
= 31.2358
= 20.6792
= -0.6309 = 0.4490
K= 0.135 ( )K0= 0.349 K= 0.129 ( )K0= 0.349
F= 0.661 ( )F0= 4.284 F= 0.76 ( )F0= 4.284
T = -5.059 ( )t0= 2.179 T= -3.294 ( )t0= 2.179
! sk
! sk
normalized effort values
pairs of effort values pairs of effort values
0 2 0 4 0 6 0 8 0 10 0 12 0
11|15 6 |8 1|12 16 |4 14 |7 2 |10 13 |3 15 |11 8 |6 12 |1 4 |16 7 |14 10 |2 3 |13 0
2 0 4 0 6 0 8 0 10 0 12 0
11|15 6 |8 1|12 16 |4 14 |7 2 |10 13 |3 15 |11 8 |6 12 |1 4 |16 7 |14 10 |2 3 |13 B) Paired Comparison (Base Implementation)
C) Paired Comparison (Change Implementation)
Statistical Data
Statistical Data
Paired Comparison 3 Paired Comparison 5
Paired Comparison 4 Paired Comparison 6
1st run 2nd run
1st run 2nd run
= 43.0116
= [32.03 ; 50.06]
first run second run
!
IQR
m
= 39.2788
= 11.9261
= 28.5209
= [8.11 ; 54.90]
IQR
m
= 29.3332
= 23.5067
sk= -09141 = 0.4401
K= 0.138 ( )K0= 0,349 K= 0.198 ( )K0= 0,349 F= 0.972 ( )F0= 4,284 F= 0.895 ( )F0= 4,284 T= -4.816 ( )t0= 2,179 T= -3.024 ( )t0= 2,179
= 44.1152
= [16.29 ; 56.45]
first run second run
IQR
m
= 29.9807
= 32.4034
= 40.4666
= [26,63 ; 52,20]
IQR
m
= 41.4368
= 14.4722
= -1.3034 = 0.8501
K= 0.172 ( )K0= 0.349 K= 0.198 ( )K0= 0.349 F= 0.752 ( )F0= 4.284 F= 1.784 ( )F0= 4.284
T= -1.724 ( )t0= 2.179 T= -2.884 ( )t0= 2.179
! sk
! sk
! sk
normalized effort values
pairs of effort values pairs of effort values
normalized effort values
pairs of effort values pairs of effort values t-test failed
WfMS CHS WfMS CHS
m IQR
K F T
! sk
… median … interquantile range …standard deviation …expeted vaue …skewness
… Kolmogorov/ Smirnov Z-value …observed f-statistic …observed t-statistic
K0…critical value for K F0…critical value for F t0 …critical value for T
Fig. 14. Experimental Results
faster then the fastest one in the first run. These differences are confirmed by the results of the t-test for both FLOWer and Staffware, i.e., our 0-hypothesisH0,2 is rejected at a significance level of 0.05. For FLOWer the mean difference between first and second test run is 13743 seconds (fluctuating between 9161 and 18326) and for Staffware it is 7231 seconds (fluctuating between 1742 and 12721).
Fig. 17C and 17D show the results for FLOWer and Staffware in respect to base implementation effort. Like for the overall implementation effort the differences in im- plementation effort between the first and the second test run are statistically significant, which leads to a rejection of 0-hypothesisH0,2. For FLOWer the mean difference between