How Social Distance of Process Designers Affects the Process of Process Modeling:
Insights From a Controlled Experiment
Jens Kolb, Michael Zimoch
Ulm University, Germany
{jens.kolb, michael.
zimoch}@uni-ulm.de
Barbara Weber
Quality Engineering Research Group, University of
Innsbruck, Austria
barbara.weber@uibk.ac.at
Manfred Reichert
Ulm University, Germany
manfred.reichert
@uni-ulm.de
ABSTRACT
The increasing adoption of process-aware information sys- tems (PAISs) by enterprises has resulted in large process model collections. Usually, process models are created ei- ther by in-house domain experts or external consultants.
Thereby, high model quality is crucial, i.e., process mod- els should be syntactically correct and sound, and also re- flect the real business processes properly. While numerous guidelines exist for creating correct and sound process mod- els, there is only little work dealing with cognitive aspects affecting process modeling. This paper addresses this gap and presents a controlled experiment using construal level theory. We investigate the influence the social distance of a process designer to the modeled domain has on the creation of process models. In particular, we are able to show sig- nificant differences between high and low social distance in respect to model quality and granularity. The results may help enterprises to compose adequate teams for creating or optimizing business process models.
Categories and Subject Descriptors
H.1.2 [User/Machine Systems]: Software Psychology
Keywords
business process modeling, construal level theory
1. INTRODUCTION
Due to the increasing adoption of process-aware informa- tion systems (PAIS), more and more enterprise repositories comprise large process model collections [1]. Usually, process models vary in respect to their quality and level of granu- larity, and contain a wide range of problems that impede upon their understandability [2]. However, high quality of process models is crucial for enterprises to guarantee proper
Permission to make digital or hard copies of all or part of this work for personal or classroom use is granted without fee provided that copies are not made or distributed for profit or commercial advantage and that copies bear this notice and the full citation on the first page. To copy otherwise, to republish, to post on servers or to redistribute to lists, requires prior specific permission and/or a fee.
SAC’14March 24-28, 2014, Gyeongju, Korea.
Copyright 2014 ACM 978-1-4503-2469-4/14/03 ...$15.00.
process execution in PAIS [3]. As a prerequisite for the lat- ter, process models should reflect the real-world processes properly and at the right level of granularity [4]. To ad- dress this issue, considerable work on criteria that ensure process model quality and comprehensibility has been con- ducted [5, 6]. Further, different modeling guidelines (e.g., GoM, 7PMG) exist, supporting process designers in creat- ing process models of high quality [7, 8]. However, there is only little work evaluating the influence of cognitive as- pects on theprocess of process modeling [9] and their effects on the resulting process models [10, 11]. However, if we do not understand the cognitive aspects affecting process model quality, process modeling projects might not deliver the re- quired results or even fail. This paper investigates a fun- damental factor presumably influencing the process of pro- cess modeling—social distance [12]. The latter is addressed by the Construal Level Theory (CLT) [13] and constitutes an important part of psychological distance. In particular, studies have shown that human thinking and acting are both strongly influenced by psychological distance [14]. Accord- ing to CLT, we experience only thehere and now, and form an abstract mental construal of distant objects [12, 14]; e.g., when thinking about a concert we plan to visit, it is impor- tant to know which bands will be playing, but details about the trip are not in our mind set yet. In turn, just before the concert, it is important to know with whom to visit or how to get there, i.e., planning is at a more fine-grained level.
Similarly, in the process of process modeling, various actors having different distance to the modeled business process and its environment may be involved. While certain process models are directly designed by process participants, oth- ers are modeled by external consultants or in-house experts (e.g., from the quality assurance department) not involved in the process (i.e., people having ahigh social distanceto the process). A relevant question in this context is how social distance influences resulting process models. Taking CLT as theoretical basis, we conduct a controlled experiment in- vestigating the influence social distance has on the process of process modeling as well as the quality and granularity of the resulting process models. Our results show a signifi- cant influence of social distance on the granularity of process models. Regarding process model quality, significant effects can be observed as well. Respective insights allow companies when composing process modeling teams. In particular, our results indicate that it is advisable to involve process design- ers with low social distance in any process modeling team.
The experiment has been conducted and results are used in the context of theproView project1, which utilizes experi- mental results aiming at user-centered business process sup- port. In particular, proView provides techniques enabling personalized process models (i.e., process views [15, 16]) as well as user-friendly process model visualizations (e.g., dia- grams and trees [17]) and interactions [18, 19].
Sect. 2 provides backgrounds on CLT. Sect. 3 introduces our research question and defines the experiment. Sect. 4 deals with experiment preparation and its execution. Results are presented and analyzed in Sect. 5. Finally, Sect. 6 discusses related work and Sect. 7 summarizes the paper.
2. FUNDAMENTALS ON CONSTRUAL LEVEL THEORY
Construal Level Theory (CLT) describes the effectspsy- chological distance has on objects or events [12, 14]. Gen- erally, CLT states that increasing psychological distance af- fects our mental representation of these objects or events.
In turn, this influence on human perception has a strong impact on our actions and thoughts [13], i.e., everything be- ing distant to us creates more abstract mental reflections.
The reason behind this phenomenon is thelevel of construal (LOC), which describes how individuals interpret and per- ceive objects and events. Increasing psychological distance affects the cognitive abilities of individuals and leads to a change in their perception of an object or event.
CLT describes two levels of thinking: high- and low-level construal. High-level construals are abstract, imprecise, co- herent, and superordinate representations compared tolow- level construals. If an object is further away, we think about it in terms of high-level construals. However, the smaller our distance to objects or events is, the more we think in low-level construals. Moreover, these two levels of constru- als are influenced by psychological distance. While objec- tive distance describes the quantitative spatial distance in the real world,psychological distancedescribes our feelings, thoughts and emotions in relation to an object or event. In turn, an object or event is defined aspsychological distant, if it is not experienced physically. For this case, a mental representation must be constructed. Psychological distance can be further subdivided intosocial, spatial,temporal, and hypothetical distance. Social distance, on which we focus in this paper, describes our relation to other individuals (cf.
Fig. 1); e.g., whether choosing a more distant seat in a bus from another individual or not is directly reflected by social distance [20]. Other psychological distances included in our work, but not considered in this paper arespatial,temporal, andhypothetical distance [13, 21, 22, 23].
Low Distance High Distance
abstract, imprecise
specific, precise Person
Figure 1: Construal Level Theory - Social Distance
3. RESEARCH QUESTION AND EXPERI- MENT DEFINITION
This section deals with definition and planning of our ex- periment for measuring the influence of social distance on
1www.dbis.info/proView
theprocess of process modelingand resulting artifacts. Sect.
3.1 explains the context of the experiment and defines its goal. Sect. 3.2 introduces the hypothesis considered for testing and Sect. 3.3 presents the experimental setup. Sect.
3.4 explains the design of our experiment. Finally, Sect. 3.5 discusses factors threatening the validity of results.
3.1 Context Selection and Goal Definition
In companies, processes are typically either modeled by in-house teams or external consultants. Respective process designers are responsible for interviewing process partici- pants and capturing gathered knowledge in process models.
However, these designers are often not directly involved in the process to be modeled; e.g., they may be member of the quality assurance department. In other cases, due to limited resources, companies assign such modeling tasks to external consultants. However, it is not well understood how such an increased social distance affects the quality and granularity of resulting process models. To close this gap, this paper investigates the following fundamental research question:
Is the process of process modeling, i.e., quality and granularity of the process models resulting from it, affected by the social distance process designers have on
respective business processes?
Despite the large number of work on process model qual- ity [2, 8, 24, 25, 26] and granularity of process modeling [27], there exists only little work dealing with cognitive aspects of process modeling [10, 11, 28, 29]. In particular, it is not well understood how these factors actually lead to minor process quality, i.e., deficiencies regarding syntactic, seman- tic, and perceived quality, and how they impact granularity of process models. What has not been considered so far, is the social distance process designers have to the process models created by them. According to CLT, however, ex- isting social distance to objects influences the way we act and therefore presumably also impacts the way how process models are created. Based on a controlled software exper- iment, this paper investigates the influence social distance has on the process of process modeling and its outcomes.
The experiment varies social distance to learn whether it has any influence on the quality and granularity of the re- sulting process models. The goal may be formulated as:
Analyze process models
for the purpose of evaluating with respect to their level of construal from the point of view of the researchers
in the context of students and research staff.
3.2 Hypothesis Formulation
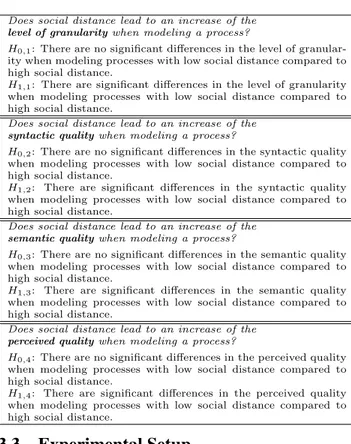
Based on the goal of our experiment, the following hy- potheses are derived. The experiment investigates whether social distance influences the level of construal during the process of process modeling, and thus the quality and gran- ularity of the resulting process model. In total, we have derived four hypotheses, one for thelevel of granularity and three for the quality dimensions, i.e., syntactic, semantic, andperceived quality:
Does social distance lead to an increase of the level of granularitywhen modeling a process?
H0,1: There are no significant differences in the level of granular- ity when modeling processes with low social distance compared to high social distance.
H1,1: There are significant differences in the level of granularity when modeling processes with low social distance compared to high social distance.
Does social distance lead to an increase of the syntactic qualitywhen modeling a process?
H0,2: There are no significant differences in the syntactic quality when modeling processes with low social distance compared to high social distance.
H1,2: There are significant differences in the syntactic quality when modeling processes with low social distance compared to high social distance.
Does social distance lead to an increase of the semantic qualitywhen modeling a process?
H0,3: There are no significant differences in the semantic quality when modeling processes with low social distance compared to high social distance.
H1,3: There are significant differences in the semantic quality when modeling processes with low social distance compared to high social distance.
Does social distance lead to an increase of the perceived qualitywhen modeling a process?
H0,4: There are no significant differences in the perceived quality when modeling processes with low social distance compared to high social distance.
H1,4: There are significant differences in the perceived quality when modeling processes with low social distance compared to high social distance.
3.3 Experimental Setup
This section describessubjects,object, andresponse vari- ables of our experiment as well as its instrumentation and data collection procedure.
Subjects. Ideally, process designers in enterprises are mod- eling experts. But, often they only obtain basic training and have limited process modeling skills [30]. Hence, from sub- jects we require that they are at least moderately familiar with process modeling, but we do not require expert level.
Object. The object is a process model using theBusiness Process Model and Notation (BPMN). To ensure familiarity of subjects and that differences in quality and granularity are not caused due to a lack of familiarity, but rather due to dif- ferences in social distance, we choose a well-known scenario.
More precisely, the modeling task deals with the process ofvisiting the university canteen. We created task descrip- tions in two versions reflecting different social distances (cf.
Tab. 1). To ensure that the gap between the two distances is big enough, a pilot study is performed. In the context of low social distance, visiting the canteen with a good friend shall be modeled. Regarding high social distance, visiting the canteen with a foreign (i.e., unknown) student shall be modeled. Note that task description are rather abstract to give subjects the possibility to model as detailed as they like.
Low Social Distance: A good friend of you starts to study at your university. Since it is essential for students to know the canteen, model the process of a characteristic visit of the canteen.
Start the process at the point, the student enters the canteen.
High Social Distance:A foreign student visits your university.
Since it is essential for students to know the canteen, model the process of a characteristic visit of the canteen. Start the process at the point, the student enters the canteen.
Table 1: Task Descriptions
Factor and factor levels. The factor considered in our experiment issocial distance with levelshigh andlow. Ac- cordingly, the task description is adjusted to vary social dis-
tance: i.e., modeling the canteen process either for a foreign student (i.e., high) or good friend (i.e., low social distance).
Response variable. As response variable, we consider the level of construal which cannot be directly measured. Con- sidering the level of construal, everything being distant from us is created more abstract (cf. Sect. 2). Hence, we as- sume that the level of construal impactsqualityandgranu- larity of the resulting process model. Therefore, high so- cial distance may lead to course-grained, more abstract, and imprecise process models (i.e., reflecting a low qual- ity/granularity), while low social distance may result in more fine-grained and precise process models (i.e., reflecting a high quality/granularity). Hence, process model quality is characterized by three dimensions, i.e.,syntactic,semantic, andperceived quality, making use of semiotic theory [31].
Syntactic quality of a process model is measured by count- ing syntactical errors (i.e., syntactical rule violations) of the applied modeling language (i.e., BPMN) [32]. In turn, se- mantic quality covers correctness, completeness, relevance, andauthenticity of a process model. Correctness expresses that all elements in a process model are correct and rele- vant. Completeness implies that relevant aspects about the domain are missing. Further, relevance signifies that all el- ements in the process model are relevant for the process (i.e., superfluous elements are considered as well). Finally, authenticity expresses that the chosen representation gives a true impression of the domain. All four dimensions of semantic quality are rated by two modeling experts in a consensus building process from each other and based on a 7-point Likert scale [33]: i.e., between 0 (strongly disagree) and 6 (strongly agree). Finally, perceived quality depends on the degree to which a subject agrees with the result- ing model [34]. Perceived quality can be further subdivided into agreement, missing aspects, accurate description, mis- takes, and satisfaction. It is rated by each subject on a 5-point Likert scale, i.e., between 0 (strongly disagree) and 4 (strongly agree), after finishing the modeling task. Agree- ment expresses to which degree the process model matches with the real-world business process. Missing aspects rates whether significant aspects are missing in the resulting pro- cess model. In turn,accurate description expresses how ac- curate the process model matches the real-world process.
Mistakescorresponds to the subject rate indicating whether there are serious mistakes in the resulting process model.
Finally, satisfaction expresses the degree of satisfaction a subject has with the process model created by him or her.
Process granularity is measured through the complexity of the resulting process models, i.e.,number of activities, edges, gateways, andexecution paths. Fig. 2 summarizes the vari- ables considered in a research model.
3.4 Experimental Design
We apply guidelines for designing experiments as described in [35] and conduct arandomized balanced single factor ex- periment. The experiment israndomized since subjects are assigned to groups randomly. Further, only asingle factor varies, i.e., the level of construal. Fig. 3 illustrates the setup.
Instrumentation and data collection procedure. To precisely measure response variables in a non-intrusive man- ner, we use the Cheetah Experimental Platform (CEP)[9].
CEP provides a BPMN modeling environment that records all modeling steps and their attributes (i.e., timestamp, type
Psychological Distance
F: Syntactic Quality
O: Number of Syntactical Errors Quality
Legend:
F: Theoretical Factor O: Factor Operationalization
F: Semantic Quality O: Correctness Authenticity Relevance Completness F: Perceived Quality O: Agreement Missing Aspects Accurate Description Mistakes
Satisfaction Granularity
F: Granularity O: Number of Activities Number of Edges Number of Gateways Number of Elements Number of Exec. Paths F: Social Distance O: Level of Social Distance
Figure 2: Research Model
Low Social Distance Process Model
n Subjects Factor
Subject 1
...
Subject n/2
High Social Distance Process Model Subject n/2+1
...
Subject n
Object Task
Subject Group 1Subject Group 2
Object
Figure 3: Experiment Design
of modeling action). Further, resulting process models are stored. Finally, demographic data and qualitative feedback is gathered from subjects based on questionnaires.
3.5 Risk Analysis
Generally, any experiment bears risks that might affect its results. Thus, its validity or—more precisely—its levels of validity need to be checked: internal validity (“Are effects caused by independent response variables?”) and external validity(“May results be generalized?”).
Risks tointernal validity. Risks that might influence the modeling outcome include process modeling experience of subjects involved and uneven distributions of subjects over two groups. Furthermore, post data validation ensures that in both groups subjects are at least moderately familiar with process modeling (cf. Sect. 4.3). It is assured that both groups show about the same familiarity level (i.e., median is 5.0 and 4.5 for groups). The chosen modeling task consti- tutes another risk to internal validity. To ensure familiarity of subjects and to guarantee that differences in quality and granularity are due to social distance, we choose a scenario all subjects know well (i.e., the campus has only one canteen, which is used by all subjects). Particularly, this prevents faulty models due to lack of domain knowledge. To further ensure that subjects are not negatively influenced by tired- ness, boredom, or hunger, the experiment is conducted at a time of the day for which the mentioned frame of mind can be excluded. Finally, expected duration of modeling tasks is 15 min. This should prevent faulty models due to lack of motivation. Subjects are recruited on a voluntary basis.
Risks to external validity. The subjects have academic
background (i.e., students and research staff), which might limit generalizability of results. However, the subjects rather have profound knowledge in process modeling (cf. Sect. 4.3).
Hence, we may consider them as proxies for professionals who have obtained basic training so far. As another risk for external validity, process model quality may depend on the appropriateness of the chosen modeling languages and tools.
To mitigate this risk, both groups use an easy-to-use process modeling tool as well as an established process modeling language. Finally, a potential risk for external validity is that we measure social distance with one modeling task. To mitigate this and to improve generalizability, experiments in different environments or conditions one may conduct.
4. EXPERIMENT OPERATION
Based on the provided experiment definition, Sect. 4.1 summarizes the experiment preparation. Sect. 4.2 describes the execution of the experiment, while Sect. 4.3 introduces the validation of the data collected during the experiment.
4.1 Experiment Preparation
Students and research staff familiar with process modeling are invited to join the experiment. Subjects are not informed about aspects intended to investigate. However, they know the experiment takes place in the context of a thesis. For all subjects, anonymity is guaranteed. Before conducting the experiment, a pilot study is performed whose results are used, to eliminate ambiguities and misunderstandings as well as to improve the description of the modeling task.
Additionally, it is checked whether social distance between the tasks is sufficiently large. Finally, an evaluation sheet is created to assess the level of construal by analyzing quality and granularity of resulting process models.
4.2 Experiment Execution
The experiment is executed in a computer lab at Ulm Uni- versity. All in all 44 students and research staff participate.
Due to spatial constraints, up to 12 subjects may partici- pate at the same time and several sessions within a period of four weeks are offered. Each session lasts about 15 min- utes and runs as follows: The procedure of the experiment is explained and worksheets with task description are handed out. Thereby, subjects are randomly assigned to one of the subject groups (cf. Sect. 3.4). Then, subjects fill out an initial questionnaire capturing their actual modeling experi- ence. This information is used to test whether the subjects are familiar with process modeling. Finally, subjects model the process based on the textual description from the work- sheets. After finishing the task, subjects provide their rating forperceived quality (cf. Sect. 3.3). At the end, they may give feedback. All results are stored in the CEP database.
4.3 Data Validation
In total, data is collected from 44 subjects. Two of them are excluded due to invalidity of the process models ob- tained; i.e., one contains only one start node and the other one differs substantially from the postulated task descrip- tion. Finally, 42 subjects are considered for data analysis;
i.e., 32 subjects are students and 10 are research staff; 5 sub- jects are female. In addition, we screened the subjects for familiarity with BPMN (process modeling language we use in our models), since our research setup requires subjects to be familiar with BPMN. On a Likert scale from 0 to 6 the
median value forfamiliarity with BPMN is 5.0 (i.e., above average). For confidence in understanding BPMN process models, a median value of 5.0 is obtained. Perceived com- petence in creating BPMN models has a median value of 4.0. Prior to the experiment, subjects analyzed 38 process models and created 18 in average. Since all values range above average and subjects are familiar with process mod- eling, we may conclude that the participating subjects fit to the targeted profile. The full data set can be found in [36].
5. DATA ANALYSIS & INTERPRETATION
Sect. 5.1 presents descriptive statistics for data gathered during the experiment. Sect. 5.2 discusses whether a data set reduction is needed. Sect. 5.3 tests hypotheses from Sect. 3.2.
5.1 Data Analysis and Descriptive Statistics
Figure 4 shows box plots (i.e., median, min, and max val- ues as well as 1st and 3rd quartiles) of all measures related to granularity of process models, i.e., number ofactivities, edges,gateways,total process elements, andpossible paths.
Low High
Low High High Low
0 20 10 30 40
#Edges #Gateways #Elements #Paths High
#Activities 50
60
77 513
Low High Low
Figure 4: Measurements for Granularity
Figure 4 shows, all measured values are higher in the con- text of low social distance. In particular, differences in the numbers of possible paths are especially large. Note that low social distance results have a median of 21 possible paths, while high distance only leads to 3.50 possible paths.
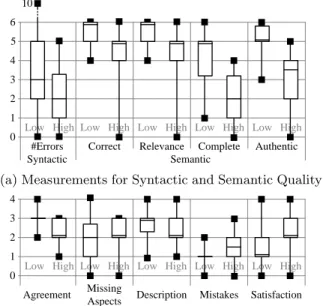
Next, Figure 5a displays box plots of measurements for syntacticandsemantic quality.
As shown in Figure 5a, process models with low social dis- tance seem to give a better account of the domain; however, subjects make more syntactical errors (median of 3 for low, 2 for high). Further, Figure 5b gives an overview of mea- sures regardingperceived quality of subjects. It shows that subjects with low social distance believe that the description of their designed process models matches the real-world pro- cess more accurately (median of 3 for low, 2 for high). It is noteworthy that in conjunction with low distance, satisfac- tion leads to a median of 1, while high distance leads to a median of 2. Our observations are merely based on descrip- tive statistics. For a more rigid investigation, hypotheses will be tested for statistical significance in Sect. 5.3.
5.2 Data Set Reduction
Generally, results of any statistical analysis depend on the quality of its input data, i.e., faulty data might contribute to incorrect conclusions. Therefore, it is important to identify outliers and evaluate whether they shall be excluded, i.e., a
Low High Low High Low High Low High Low High
0 2 1 3 4
Correct Relevance Complete Authentic 5
6
#Errors 10
Semantic Syntactic
(a) Measurements for Syntactic and Semantic Quality
Low High Low High Low High 0
2 1 3 4
Missing
Aspects Description Mistakes Satisfaction Low High Low High
Agreement
(b) Measurements for Perceived Quality Figure 5: Measurements for Quality Metrics
data set reduction might become necessary. Note that the latter might be also critical due to potential loss of informa- tion. In our experiment, several outliers can be identified.
We decided not to remove them since we consider them as correct, i.e., they are not a result of wrong modeling. One subject modeled a process model with 513 possible execution paths. Another subject modeled a task with 10 syntactical errors. Removing them would bias results obtained. Fur- thermore, we do not have to remove results from any sub- ject due to missing process modeling knowledge—since all subjects are familiar with process modeling (cf. Sect. 4.3).
5.3 Hypothesis Testing
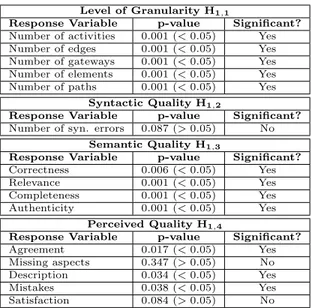
Sect. 5.1 indicates differences regarding low and high so- cial distance. In the following, we test whether observed differences are statistically significant. We test our response variables based on anon-parametric two-sample u-test [37].
A successful u-test (withp < p0 at risk levelα= 0,05) will reject a null hypothesis. Table 2 shows results of hypothesis testing (cf. Sect. 3.2).
In summary, hypothesesH1,1 and H1,3 can be accepted.
In turn, hypothesisH1,4is only partially supported and thus it cannot be accepted. Further, hypothesisH1,2 must be re- jected. From this, we can conclude that low social distance has a positive impact on thegranularity(H1,1) andseman- tic quality (H1,3) of resulting process models. We may also assume that low social distance has a positive impact on the perceived quality (H1,4); however, since it is partially sup- ported, it cannot be generalized. Regardingsyntactic quality (H1,2), no statistically significant difference is observed.
6. RELATED WORK
This paper investigates the impact of social distance on the quality and granularity of process models. Hence, it is related to existing research regarding the quality and gran- ularity of process models. There are different frameworks and guidelines in respect to process model quality. Among
Level of Granularity H1,1
Response Variable p-value Significant?
Number of activities 0.001 (<0.05) Yes Number of edges 0.001 (<0.05) Yes Number of gateways 0.001 (<0.05) Yes Number of elements 0.001 (<0.05) Yes Number of paths 0.001 (<0.05) Yes
Syntactic Quality H1,2
Response Variable p-value Significant?
Number of syn. errors 0.087 (>0.05) No Semantic Quality H1,3
Response Variable p-value Significant?
Correctness 0.006 (<0.05) Yes
Relevance 0.001 (<0.05) Yes
Completeness 0.001 (<0.05) Yes Authenticity 0.001 (<0.05) Yes
Perceived Quality H1,4
Response Variable p-value Significant?
Agreement 0.017 (<0.05) Yes
Missing aspects 0.347 (>0.05) No Description 0.034 (<0.05) Yes
Mistakes 0.038 (<0.05) Yes
Satisfaction 0.084 (>0.05) No
Table 2: Results of Hypothesis Testing
others, the SEQUAL framework uses semiotic theory for identifying various aspects of process model quality [26], whereas GoM (Guidelines of Process Modeling) describes quality considerations for process models [7] and 7PMG (Seven Process Modeling Guidelines) characterize desirable proper- ties of a process model [8]. Moreover, significant research on factors affecting process model comprehensibility and main- tainability exists. The influence of model complexity on pro- cess model comprehensibility is investigated in [5]. In turn, [38] analyzes the effect of modularity on process understand- ing. The influence of grammatical styles for labeling activ- ities on model understanding is discussed in [39], and an experiment investigating the impact of secondary notations is presented in [40]. The impact of different quality metrics on error probability is discussed in [41].
[42] provides prediction models for true usability and main- tainability of process models. Effects of how and at which level of granularity a designer models a particular process is described in [27]. Regardless, in the context of process mod- eling there exists little work taking cognitive aspects into ac- count. [29] presents the effects of reducing cognitive load on end user understanding of conceptual models. Understand- ing complex models quickly reaches cognitive limits. [11]
describes the cognitive difficulty of understanding different relations between model elements.
Common to all these works is the focus on the resulting process model (i.e., the product of process modeling), while little attention has been paid on the process of the process modeling itself. The Nautilus project complements these works by investigating the process of process modeling for tracing model quality back to different modeling strategies resulting in process models of different quality [43, 44].
7. DISCUSSION AND CONCLUSION
This paper investigates whether social distance affects pro- cess modeling and quality as well as granularity of the re- sulting process models. In particular, an experiment is con- ducted showing that for social distance there is a significant
difference depending on whether a process designer has a low or high social distance to the modeled domain. For enter- prises, our results indicate that process designers showing a high social distance to a particular business process tend to create a more coarse-grained and abstract process model. In addition, process models, whose designers show a high social distance, reflect a lower semantic model quality. In particu- lar, these models tend to be more incomplete and less correct with respect to the domain to be modeled. Further, process designers with low social distance are more self-confident about the process models they create. In the context of an enterprise, it is thus recommended to involve process de- signers being more confident with corresponding business processes; e.g., to achieve a high process model quality.
Based on our results, in general, one can assume that lower social distance leads to more precise and fine-grained process models. However, while results look promising, their gener- alization needs to be confirmed by additional experiments;
i.e., in order to obtain more accurate results allowing such a generalization, additional studies are needed either through replication or similar studies in other environments to in- vestigate the influence of social distance on the process of process modeling.
Furthermore, our experiments related to other psycholog- ical distances (i.e., spatial, temporal and hypothetical dis- tance) will be subject of future papers. Combining experi- ment results for all psychological distances enables us to ex- tract guidelines on how modeling teams in enterprises should be put together and optimal process models can be achieved.
Finally, experiments with practitioners are planned to vali- date results in a real-world setting.
8. REFERENCES
[1] Weber, B., Reichert, M., Mendling, J., Reijers, H.A.:
Refactoring Large Process Model Repositories.
Computers in Industry62(2011) 467–486
[2] Mendling, J.: Metrics for Process Models: Empirical Foundations of Verifiation, Error Prediction, and Guidelines for Correctness. Springer (2008) [3] Reijers, H., Mendling, J.: A Study into the Factors
that Influence the Understandability of Business Process Models. Systems, Man and Cybernetics, Part A: Systems and Humans, IEEE Transactions on (2011) 1–14
[4] Moody, D.: Theoretical and Practical Issues in Evaluating the Quality of Conceptual Models: Current State and Future Directions. DKE55(2005) 243–276 [5] Mendling, J., Reijers, H.A., Cardoso, J.: What Makes Process Models Understandable? In: Proc. 5th BPM.
(2007) 48–63
[6] Mendling, J., Strembeck, M.: Influence Factors of Understanding Business Process Models. In: Proc.
11th Int’l Conf. Business Inf. Systems. (2008) 142–153 [7] Becker, J., Rosemann, M., Uthmann, C.V.: Guidelines
of Business Process Modeling. In: Proc. 1st BPM.
Volume 1806., Springer-Verlag (2000) 30–49 [8] Mendling, J., Reijers, H.A., van Der Aalst, W.M.:
Seven Process Modeling Guidelines (7PMG). Inf. &
Software Techn.52(2010) 127–136
[9] Pinggera, J., Zugal, S., Weber, B.: Investigating the
Process of Process Modeling with Cheetah Experimental Platform. In: Proc. 1st Int’l WS Empirical Research Proc.-Oriented Inf. Sys., Hammamet (2010)
[10] Figl, K., Weber, B.: Individual Creativity in Designing Business Processes. In: Advanced Information Systems Engineering Workshops, Springer (2012) 294–306 [11] Figl, K., Laue, R.: Cognitive Complexity in Business
Process Modeling. In: Advanced Information Systems Engineering, Springer (2011) 452–466
[12] Trope, Y., Liberman, N., Wakslak, C.: Construal Levels and Psychological Distance: Effects on
Representation, Prediction, Evaluation, and Behavior.
Journal of Consumer Psychology17(2007) 83–95 [13] Todorov, A., Goren, A., Trope, Y.: Probability as a
Psychological Distance: Construal and Preferences. J Experimental Social Psychology43(2007) 473–482 [14] Trope, Y., Liberman, N.: Construal-level Theory of Psychological Distance. Psychological Review117 (2010) 440–463
[15] Kolb, J., Kammerer, K., Reichert, M.: Updatable Process Views for User-centered Adaption of Large Process Models. In: Proc 10th Intl. Conf. on Service Oriented Computing (ICSOC’12), Shanghai (2012) [16] Kolb, J., Reichert, M.: Data Flow Abstractions and
Adaptations through Updatable Process Views. In:
Proc 27th Symposium On Applied Computing (SAC’13), Coimbra, Portugal (2013)
[17] Kolb, J., Reichert, M.: Using Concurrent Task Trees for Stakeholder-centered Modeling and Visualization of Business Processes. In: Proc S-BPM ONE 2012, CCIS 284. (2012) 237–251
[18] Kolb, J., Rudner, B., Reichert, M.: Towards Gesture-based Process Modeling on Multi-Touch Devices. In: Proc 1st Int’l Workshop on
Human-Centric Process-Aware Information Systems (HC-PAIS’12), Gdansk, Poland (2012) 280–293 [19] Kolb, J., Rudner, B., Reichert, M.: Gesture-based
Process Modeling Using Multi-Touch Devices.
International Journal of Information System Modeling and Design (IJISMD)4(2013) (to appear)
[20] Pronin, E., Olivola, C.Y., Kennedy, K.a.: Doing Unto Future Selves As You Would Do Unto Others:
Psychological Distance and Decision Making.
Personality & Social Psych. Bulletin34(2008) 224–36 [21] Day, S., Bartels, D.: Representation over Time: The
Effects of Temporal Distance on Similarity. Cognition 106(2008) 1504–1513
[22] Liberman, N., Sagristano, M.D., Trope, Y.: The Effect of Temporal Distance on Level of Mental Construal. J Exp. Social Psychology38(2002) 523–534
[23] Fujita, K., Henderson, M.D., Eng, J., Trope, Y., Liberman, N.: Spatial Distance and Mental Construal of Social Events. Psych. Science17(2006) 278–82 [24] Moody, D.L.: The ”Physics” of Notations: Toward a
Scientific Basis for Constructing Visual Notations in Software Engineering. Software Eng.35(2008) 756–779
[25] Siau, K., Rossi, M.: Evaluation Techniques for Systems Analysis and Design Modelling Methods: a Review and Comparative Analysis. Information
System Journal21(2011) 249–268
[26] Krogstie, J.: Model-Based Development and Evolution of Information Systems. Springer (2012)
[27] Holschke, O., Rake, J., Levina, O.: Granularity as a Cognitive Factor in the Effectiveness of Business Process Model Reuse. LNCS5701(2009) 245–260 [28] Figl, K., Derntl, M.: The Impact of Perceived
Cognitive Effectiveness on Perceived Usefulness of Visual Conceptual Modeling Languages. In: Lecture Notes in Computer Science, Springer (2011) 78–91 [29] Moody, D.: Cognitive Load Effects on End User
Understanding of Conceptual Models: An
Experimental Analysis. In: Advances in Databases and Information Systems, Springer (2004) 129–143 [30] Wolf, C., Harmon, P.: The State of Business Process
Management 2012. BPTrends Report (2012) [31] Lindland, O.I., Sindre, G., Solvberg, A.:
Understanding Quality in Conceptual Modeling. IEEE Software11(1994) 42–49
[32] OMG: Business Process Management Notation (BPMN) 2.0 (2010)
[33] Recker, J., Safrudin, N., Rosemann, M.: How Novices Model Business Processes. In: Proc. 9th Int’l Conf Business Process Management (BPM’10), New York, USA (2010) 29–44
[34] Rittgen, P.: Quality and Perceived Usefulness of Process Models. In: Proc. ACM SAC 2010, New York, New York, USA, ACM Press (2010) 65—-72
[35] Wohlin, C., Runeson, P., H¨ost, M., Ohlsson, M.C., Regnell, B., Wesslen, A.: Experimentation in Software Engineering - An Introduction. Kluwer (2000)
[36] Zimoch, M.: Experiments on Influence of Construal Level During Process Modeling. Bachelor Thesis, Ulm University (2012)
[37] Siegel, S., Castellan, J.: Nonparametric Statistics for the Behavioral Sciences. McGraw-Hill Editions (1988) [38] Reijers, H., Mendling, J.: Modularity in Process
Models: Review and Effects. Proc. 5th BPM (2008) 20–35
[39] Mendling, J., Reijers, H.A., Recker, J.: Activity Labeling in Process Modeling: Empirical Insights and Recommendations. Inf. Sys.35(2010) 467–482 [40] Schrepfer, M., Wolf, J., Mendling, J., Reijers, H.A.:
The Impact of Secondary Notation on Process Model Understanding. Proc. PoEM 09 (2009) 161–175 [41] Mendling, J., Verbeek, H.M.W., van Dongen, B.F.,
van der Aalst, W.M.P., Neumann, G.: Detection and Prediction of Errors in EPCs of the SAP Reference Model. Data and Knowledge Eng.64(2008) 312–329 [42] Aguilar, E.R., Sanchez, L., Carballeira, F.G., Ruiz, F.,
Piattini, M., Caivano, D., Visaggio, G.: Prediction Models for BPMN Usability and Maintainability.
Proc. CEC 09 (2009) 383–390
[43] Pinggera, J., Soffer, P., Zugal, S., Weber, B., Weidlich, M., Fahland, D., Reijers, H., Mendling, J.: Modeling Styles in Business Process Modeling. Proc. BPMDS
’12 (2012) 151–166
[44] Pinggera, J., Soffer, P., Fahland, D., Weidlich, M., Zugal, S., Weber, B., Reijers, H., Mendling, J.: Styles in business process modeling: an exploration and a model. Software & Systems Modeling (2013) 1–26
![Fig. 1); e.g., whether choosing a more distant seat in a bus from another individual or not is directly reflected by social distance [20]](https://thumb-eu.123doks.com/thumbv2/1library_info/5214417.1669144/2.918.93.427.884.936/fig-choosing-distant-individual-directly-reflected-social-distance.webp)