Collaborative Process Modeling with Tablets and Touch Tables — A Controlled Experiment
Klaus Kammerer, Jens Kolb, Sebastian Ronis, Manfred Reichert Institute of Databases and Information Systems
Ulm University, Germany
Email:{klaus.kammerer, jens.kolb, sebastian.ronis, manfred.reichert}@uni-ulm.de Abstract—Collaborative process modeling involves business
analysts and subject matter experts in order to properly capture and document process knowledge. In this context, appropriate tool support is required to motivate these user groups to actively participate in collaborative process modeling. This paper presents a collaborative process modeling tool that enables the experts to create, visualize and evolve process models based on multi- touch devices (e.g., tablets and touch tables). In particular, users may edit process models on their tablets and share the created or changed process models with other team members on a common touch table. For this purpose, a sophisticated and intuitive interaction concept is provided. Furthermore, results of a controlled experiment, evaluating the influence the use of tablets has on collaborative process modeling based on touch tables, are presented. Altogether the experimental results emphasize the high potential of multi-touch tools for collaborative process modeling.
Keywords—Collaborative Process Modeling, Gesture-based Pro- cess Modeling, Controlled Experiment
I. INTRODUCTION
Capturing knowledge about business processes and docu- menting it in process models may involve multiple domain experts (e.g., business analysts and subject matter experts).
Thus, a collaborative environment for process modeling is needed, which allows each expert to contribute his or her spe- cific process knowledge [1]. In general, collaborative process modeling shall support experts in sharing process knowledge and in creating end-to-end process models.
In general, collaborative process modeling may be local or remote. A remote collaboration does not require that the experts involved in a process modeling task meet at a particular place. In turn,local collaborationmeans that the experts inter- act face-to-face, increasing the adoption of process modeling.
Contemporary Process-aware Information Systems (PAIS) allow for remote collaboration features through sharing process models. Furthermore, the increasing adoption of touch-enabled devices in business environments fosters collaborative tasks as demonstrated, for example, in the healthcare domain [2], [3].
In particular, mobile touch devices may be used to create, vi- sualize, or change process models, while interviewing process participants [4]. Furthermore, touch tables allow users to work on a large workspace, simplifying interactions with modeling tools when facing large process models [4].
Process modeling based on multi-touch gestures has al- ready been addressed by us and other groups in previous work [5], [6]. For example, we developed intuitive gestures as well as interaction concepts for process modeling in [4],
[5]. Still, there is a lack of touch-enabled collaborative process modeling.
To enable an efficient local collaboration, it must be ensured that bothpersonalandgroup workare supported [7].
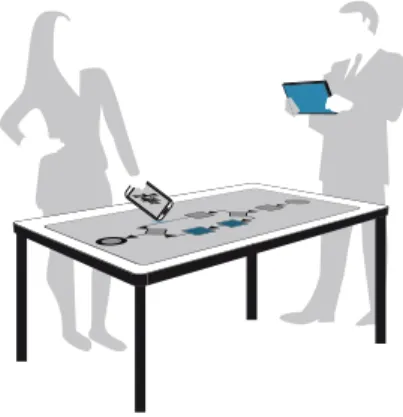
Personal work shall be accomplished by the experts on their own, e.g., using tablets. In turn, results should be discussed and optimized in group work supported with touch tables. In particular, using tablets in combination with touch tables will allow for an integrated support of personal and group work (cf. Figure 1). So far, no work exists on how to combine the various touch devices in the context of collaborative process modeling. Furthermore, it is unclear whether such a setup has any influence on the resulting process models created.
This paper introduces an advanced interaction concept that combines tablets and a touch table in order to enable collaborative process modeling. Furthermore, a controlled ex- periment is presented investigating the influence the combined use of touch devices (i.e., tablets and touch tables) has on the process of process modeling. In particular, we analyze the quality and granularity of the resulting process models as well as the usability of the proof-of-concept collaborative process modeling tool we developed.
Fig. 1. Combining a Touch Table and Tablets for Local Process Modeling
Experimental results have been exploited in the proView project1. The latter aims at a user-centered approach for business process modeling. In particular, proView enables per- sonalized process models (i.e., process views [8]–[10]) as well as user-friendly process model visualizations (e.g., diagrams and trees [11]). Furthermore, gesture-based interactions are supported [4], [5].
1http://www.dbis.info/proView
The remainder of this paper is organized as follow: Sec- tion II presents fundamentals of process modeling and gesture- based interactions required for understanding this paper. Sec- tion III describescollabTouch, the collaborative process mod- eling environment we first implemented and then evaluated in an experiment. Section IV introduces the design of this experiment and the research question addressed. Section V describes experiment preparation and experiment execution.
Experimental results are presented and analyzed in Section VI.
Finally, Section VIII discusses related work and Section IX summarizes the paper.
II. FUNDAMENTALS
A. Process Modeling
A process model represents a business process and is described in terms of a directed graph whose node set com- prises activities, gateways, events, and data elements (cf.
Figure 2) [12]. An activity either corresponds to ahuman task (i.e., it requires user interaction) or to a service representing an automated task. In turn, gateways can be classified into AND, XOR and Loop gateways and be used for modeling parallel branchings, conditional branchings, and loops. Edges between activities or between activities and gateways represent precedence relations, i.e., thecontrol flowof the process model (cf. Figure 2). Events may signal thestartor endof a process and, thus, influence the control flow.
Furthermore, data elements describe elementary data ob- jects of the process model having one of the following types:
integer, float, boolean, string, date, or URI. Based on data elements, the data flow is defined by a set of directed edges connecting data elements and activities.Writinga data element is expressed through an edge pointing from an activity to the data element. In turn, reading a data element is expressed by an edge pointing from this data element to the respective activity. We presume that process models may be unstructured, i.e., sequences, branchings and loops need not necessarily be specified as blocks with well-defined start and end nodes hav- ing the same gateway type [13]. Hence, the process modeling style users may follow allows for a certain degree of freedom (cf. Section V). As visual representation we use the Business Process Model and Notation (BPMN) 2.0 [14].
A
B
C F G
D E Start Event Activity
ANDsplit Gateway
End Event LOOPsplit
Gateway LOOPjoin
Gateway XORsplit
Gateway
XORjoin Gateway
ANDjoin Gateway Control Flow
Data Element
Fig. 2. Example of a Process Model
B. Touch-enabled Device Types
Different device types with touch capabilities exist, e.g., smartphones, tablets, or touch tables. These can be distin- guished according to theirscreen sizesand, thus, theirmobility, field of application, andappropriateness for group work. For example, a touch table seems to be well suited for supporting
group work due to its large screen, whereas tablets are more appropriate forpersonal work.
Typically, a tablet comprises a capacitive touch display capable of detecting hands or fingers when touching it, i.e., touch detection is integrated into the display. A touch table (cf. 1in Figure 3), in turn, may consist of a semi-transparent surface and a camera (cf. 2 in Figure 3). The latter is connected to the touch table server (cf. 4 in Figure 3) and perceives changes in the camera’s brightness when touching the surface (cf. 3in Figure 3).
C. Gesture-Based Interaction
Applications developed for touch devices may offer dif- ferent ways to interact with them, e.g., menus and gestures.
Menus, as known from desktop applications, provide sets of items to execute related actions. In turn, gestures describe a sequence of touch points on a display and represent a certain system state change (e.g., tapping a displayed item may correspond to its selection). Furthermore, gestures can be divided into single-andmulti-touchgestures. For example, tapping on an item corresponds to a single-touch gesture, whereas pinching with two fingers represents a multi-touch one.
Fig. 3. Touch Table Setup
D. Collaboration with Touch Devices
When designing applications for touch devices, the follow- ing collaborative design guidelines need to be considered [15]:
G1 Enabling interpersonal interaction,
G2 Allowing for rapid transitions between activities,
G3 Allowing for transitions between personal and group work, G4 Combining touch table collaboration with personal work, G5 Using physical objects,
G6 Accessing shared physical and digital objects, G7 Enabling flexible user arrangements, and G8 Enabling concurrent user actions.
In a local collaboration, interactions between different users (i.e., G1 interpersonal interactions) are required in order to effectively work together. Respective applications, therefore, should support this type of interaction, e.g., by enabling users to exchange information. Applications for touch tables should further supportrapid transitions between activities (G2), e.g., switching between process modeling and documentation [16], [17]. Guideline G3 (transition between personal and group work) addresses the effective usage of corresponding appli- cations, as users tend to separate personal work from group work by creating distinct areas [17]. Furthermore, respective applications should enable users to move local collaborative work to remote work on distinct devices and vice versa (G4), e.g., by sharing process models. Theuse of physical objectsfor system interactions (G5), in turn, should be considered as well as theaccess to shared physical and digital objects (G6). This allows for the mapping and exchange of information between real and virtual environments. Other guidelines relevant for collaborative work include flexible user arrangements (G7) around the touch table to allow for a flexible collocation of users and concurrent user actions (G8)supporting collabora- tive work.
III. THECOLLABTOUCHTOOL
We developed the CollabTouch tool and implemented it prototypically to investigate the combination of multiple touch device types in a local collaboration. In particular,CollabTouch offers different methods to create and change process models on a touch table as well as on tablets.
CollabTouch provides an intuitive user interface for cre- ating BPMN 2.0 process models. In particular, CollabTouch offers a gesture-enabled workspace users are able to inter- act with. Menu-based interaction is used to create process models and process elements (i.e., activities, gateways, events, sequence flows, sub-processes, and data elements) as well as to change them. To be more precise, acircle menumay be opened by a pinch gestureeither on a free workspace or between two connected elements to insert a new element (cf. Figure 4).
b) Opening the Circle Menu (between two Elements) a) Opening the Circle Menu
(free workspace)
Fig. 4. Inserting Process Elements
Alternatively, CollabTouch allows users to change process models by using touch gestures. For this purpose, a standard gesture set has been developed (cf. Table I). In order to foster ease of use and understandability, all touch devices using CollabTouch rely on the same gesture set. Existing process elements may either be selected and deselected by tapping on them (cf. Figure 5a+c) or by drawing a lasso around them, i.e., circling around respective process elements while tapping continuously on free workspace (cf. Figure 5b).
New process elements (e.g., an activity or gateway) may be created by sketching their shape on the workspace (cf.
b) Selection with Lasso Gesture
a) Selection with a Tap c) Deselection with a Tap
Fig. 5. Gestures for Selecting Process Elements
Figure 6). For example, an activity may be created by drawing a rectangle. In turn, two process elements may be connected by dragging a process element to another one (cf. Figure 7a).
Afterwards, an edge appears connecting the two elements. In this context, CollabTouch provides various checks preventing users from creating incorrect process models [18].
b) Gateway Creation
a) Activity Creation c) Event Creation d) Data Element Creation
Fig. 6. Gestures Enabling Process Element Creation
Process elements may be deleted using a cross-out ges- ture (cf. Figure 7b). Furthermore, a process element may be duplicated by tapping on it for some time and pressing the appearing duplicate button (cf. Figure 7c).
b) Deleting an Element
a) Connecting two Elements c) Duplicating an
Element (menu-based)d) Duplicating an Element (gesture-based)
abclong hold drag
Fig. 7. Gestures Enabling Process Element Connection/Deletion/Duplication
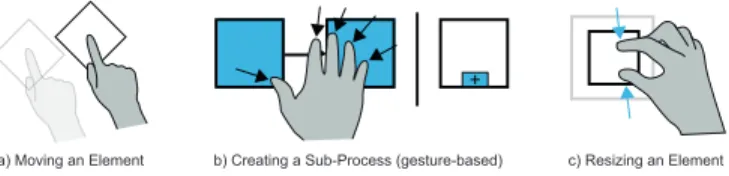
Generally, a process element may be arbitrarily moved throughout the workspace by tapping the respective element continuously (cf. Figure 8a).
A sub-process may be created by selecting two or more process elements and pinching them together (cf. Figure 8b).
Finally, every process element is resizable. For this purpose, the user must pinch in/out on the respective process element (cf. Figure 8c).
b) Creating a Sub-Process (gesture-based)
a) Moving an Element c) Resizing an Element
Fig. 8. Gestures for Process Element Move, Sub-menu Creation, and Resize
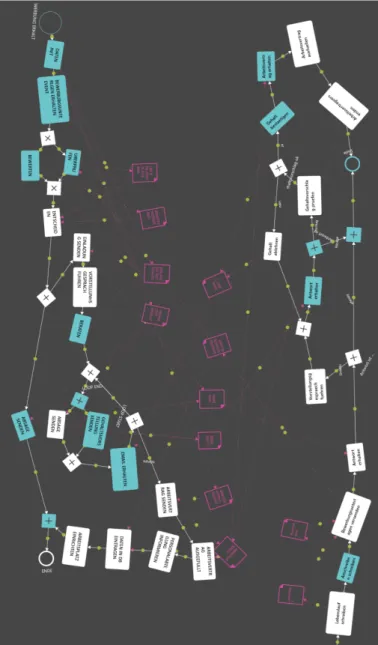
The elements of a process model are manually positioned on the screen to offer a maximum freedom for users. A force- directed-placementalgorithm keeps process fragments together while moving them across the workspace [19]. Figure 9 shows
TABLE I. COLLABTOUCHGESTURESET
Action Gesture Description
Selecting process elements Tapping on the process element; multi- selection of process elements based on lasso gesture
(cf. Figure 5b)
Deselecting process elements Tapping on free workspace (cf. Figure 5c)
Creating a process element Sketching the shape of a process ele- ment on free space (e.g., rectangle for an activity, cf. Figure 6) or creating the respective element through the circle menu (cf. Figure 4)
Connecting two process elements Moving from one process element to the other (cf. Figure 7a).
Deleting a process element Crossing out the respective process ele- ment (cf. Figure 7b).
Moving one or more process elements Tapping on and holding process el- ements while moving them (cf. Fig- ure 8a).
Creating a sub-process Selecting two or more activities or gate- ways pinching them together (cf. Figure 8b).
Resizing process elements Pinching gesture on process elements (cf. Figure 8c).
an example of a process model with manually positioned process elements.
In order to support guideline G4 (cf. Section II-D), Col- labTouch is able to transfer process fragments between tablets and touch table. Technically, this is realized by a time-based synchronization of the tablet’s acceleration sensor (cf. 6 in Figure 3). The latter recognizes the moving direction of the tablet and matches it with a corresponding touch on the touch table (cf. 5 in Figure 3). To be more precise, to transfer a process fragment from the tablet to the touch table, the respective process elements are selected on the tablet.
Subsequently, the user tabs on the touch table with the tablet (i.e., he applies a bump gesture, cf. 7 in Figure 3) and the selected process fragment is displayed on the touch table.
Note that CollabTouch considers several of the guidelines presented in Section II. However, guideline G2 (Rapid Transi- tions between Activities) is not relevant in our context, since CollabTouch focuses on process modeling. In turn, transitions between personal and group work (G3) are considered by offer- ing a large-area workspace on a touch table. Hence, users may interact with the CollabTouch system by using a touch table for group work and a tablet for personal work. Exchanging the resulting process fragments with other experts by pushing them across the touch table addresses guideline G4. The use of physical objects (see G5 + G6) is not considered in the current development state. A flexible user arrangement (G7) is ensured by the use of tablets facilitating mobile interactions as well as the use of large-screened touch tables. Finally, concurrent user actions are enabled by using a multi-touch table fostering collaborative work. Additionally, the use of tablets allows for concurrent user actions: while certain users may interact with the touch table at the same time, others may work individually on their private tablets.
Fig. 9. CollabTouch Screenshot
Sync (ticks)
ClickDetected deltaTicks
State, Data
Run
AddTouchDown OnTouch
IsTabletTouch ViewModel
ClickDetected
Callback Run Run
Run
Sync :UI
:Communication :TabletTouch :UI
:TouchManager :ServiceHost
proCollaTouch
Fig. 10. Transferring a Process Fragment between Tablet and Touch Table
IV. RESEARCHQUESTION ANDEXPERIMENTDEFINITION
This section gives insights into the definition and planning of the experiment for investigating the appropriateness of the developed collaboration concepts, and, hence, for evaluating the influence the use of tablets, in combination with a touch table, has on the process of process modeling. We first present the context of the experiment and define its goal. Then, we introduce the considered hypotheses and present the setup as well as the exploitation of experimental results. Finally, we discuss factors threatening the validity of these results.
A. Context Selection and Goal Definition
In general, a business process involves different subject matter experts. Thus, process modeling tools should enable these experts as well as business analysts to create process models collaboratively. In particular, collaborative process modeling shall be supported by the combined use of tablets and touch tables. Currently, to the best of our knowledge, there exists no approach using both tablets and touch tablets in the context of collaborative process modeling. Furthermore, no investigations have been made on whether and—if yes—on how this combination of different touch devices influences the process of process modeling [20].
Altogether, the paper investigates the following research question:
How appropriate is the use of tablets for the process of process modeling in collaborative scenarios
with touch tables?
Although there exists considerable work on process model quality (i.e., syntacticandsemantic quality) [21]–[25] as well as granularity issues in process modeling [26], only little is known about the quality of process models created with touch- based devices in a collaborative setting. In particular, no studies exist on how the use of a touch table as collaborative device, in combination with tablets enabling personal work, affects process model quality and process model granularity. Based on a controlled experiment, this paper investigates the influence, collaborative touch-based modeling has on the process of process modeling as well as on the artifacts (i.e., process models) it produces. The experiment investigates whether or not the use of tablets, in combination with a touch table, has any influence on the quality or granularity of process models.
Using the goal definition template presented in [27], the goal of the experiment can be defined as follows:
Analyze process models
for the purpose of evaluating
with respect to their quality and granularity affected by the application and usability of tablets in collaborative process modeling scenarios with touch tables
from the point of view of the researchers
in the context of students and research staff.
Finally, the risks, that might affect experimental results are discussed in Section IV-E.
B. Hypothesis Formulation
Starting with the experiment goal, hypotheses are derived.
The experiment investigates whether the combination of different touch devices influences the process of process modeling, and thus the quality and granularity of the resulting process models. In total, we derive four hypotheses, one related to the level of granularity and two related to the quality dimensions (i.e., syntactic and semantic quality). In addition, we consider a hypothesis related to the appropriateness of the designed CollabTouch system setup by assessing its usability:
Hypothesis 1 (Granularity).Does the combined use of tablets and a touch table affect thegranularityof the resulting process models?
H1,0:There is no significant difference in the level of granular- ity when creating process models using both tablets and touch tables.
H1,1:There is a significant difference in the level of granularity when creating process models using both tablets and touch tables.
Hypothesis 2 (Syntactic Quality).Does the combined use of tablets and a touch table lead to an increasedsyntactic quality of the created process models?
H2,0:There is no significant difference in the syntactic quality when creating process models using both tablets and touch tables.
H2,1 :There is a significant difference in the syntactic quality when creating process models using both tablets and touch tables.
Hypothesis 3 (Semantic Quality).Does the combined use of tablets and a touch table lead to an increasedsemantic quality of the created process models?
H3,0:There is no significant difference in the semantic quality when creating process models using both tablets and touch tables.
H3,1 :There is a significant difference in the semantic quality when creating process models using both tablets and touch tables.
Hypothesis 4 (System Usability).Does the combined use of tablets and a touch table lead to increasedsystem usability?
H4,0: There is no significant difference in the system usability when creating process models using both tablets and touch tables.
H4,1: There is a significant difference in the system usability when creating process models using both tablets and touch tables.
C. Experimental Setup
This section describes the subjects, object, factor levels, and response variables of the experiment as well as its instrumentationanddata collection procedure.
Subjects.Ideally, business analysts and subject matter ex- perts are able to model processes. In practice, however, they only obtain basic training on process modeling and, hence, have limited process modeling skills [28]. From the subjects of this experiment we require that they are at least moderately familiar with process modeling, but we do not require expert
level. In order to enable local collaboration, two subjects work together on a modeling task.
Object.The object is a process model expressed in terms of the Business Process Model and Notation (BPMN) 2.0 [14]. To ensure familiarity of subjects as well as to guarantee that differences in quality, granularity and usability are due to differences in the collaboration style, we provide the same scenario to all subjects. More precisely, the modeling task deals with the process of a job application. We provide separate task scenarios to each subject, i.e., the applicant and the respective company (cf. Table II). The separate task descriptions simulate the different process knowledge of the subjects.
TABLE II. TASKDESCRIPTIONS
Applicant:An applicant prepares his application documents. More precisely, he creates a curriculum vitae and a corresponding appli- cation letter. Afterwards, he sends the application to the company he wants to apply for. As response, he receives either a rejection or an invitation to an interview. In case of an invitation, the interview is conducted. Following the interview, the candidate receives a response which contains either a rejection or a salary proposal. In case of receiving a salary proposal, the candidate checks the latter and accepts it if it meets his or her expectations. Otherwise, the applicant requests a higher salary. Consequently, he or she may receive a new proposal from the company. This procedure repeats until the applicant accepts the salary—or receives a rejection of the company.
Company:The company receives an application from an appli- cant. Following a review and evaluation of the application either a rejection or an invitation for an interview is sent as response.
After the interview, all participants of the interview discuss results and send their decision to the applicant. The response may be a rejection or a salary proposal. In case the applicant does not accept the proposal, the company considers a higher salary. After the company has received a commitment, it sends a contract. If a filled contract is received, the candidate is recruited. For this purpose, the HR department is informed about the contract. The latter must be entered into an employee database and a workplace for the new employee must be established.
Factor and factor levels. The factor considered in the experiment is the use of tablets enabling subjects to perform personal work. For collaborative process modeling, the tablets are used in combination with a touch table. The two factor levels areusageandnon-usageof tablets by the subjects.
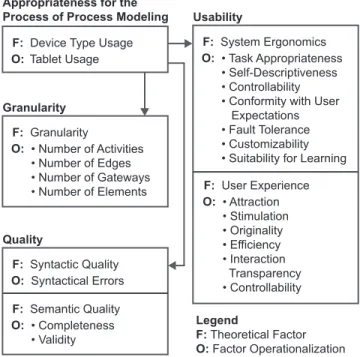
Response variable. As response variable, we consider the appropriateness of using both tablets and a touch table for the process of process modeling. Note that appropriateness cannot be directly measured. Hence, we assume that it is reflected by thegranularityandqualityof the resulting process models as well as the usability of the CollabTouch tool. Figure 11 summarizes the considered response variables.
In general, process modelqualitymay be characterized by two dimensions, i.e., syntactic and semantic quality, making use of semiotic theory [29]. Syntactic quality of a process model is measured in terms of the number of syntactical errors (i.e., syntactical rule violations) with respect to the process modeling language (i.e., BPMN) used [14]. In turn,semantic quality coverscompleteness andvalidity of a process model.
Appropriateness for the Process of Process Modeling
F: Device Type Usage O: Tablet Usage
F: Granularity O:
Granularity
• Number of Activities
• Number of Edges
• Number of Gateways
• Number of Elements
F: Syntactic Quality O:
Quality
Syntactical Errors F: Semantic Quality O: • Completeness
• Validity
F: System Ergonomics O:
Usability
• Task Appropriateness
• Self-Descriptiveness
• Controllability
• Conformity with User Expectations
• Fault Tolerance
• Customizability
• Suitability for Learning F: User Experience O: • Attraction
• Stimulation
• Originality
• Efficiency
• Interaction Transparency
• Controllability Legend
F: Theoretical Factor O: Factor Operationalization Fig. 11. Research Model
Completeness indicates whether or not relevant aspects about the domain are missing. Validity, in turn, expresses that all elements in the process model are correct and relevant (i.e., redundant elements are considered as well). Semantic quality is rated by two modeling experts in a consensus building process based on a 7-point Likert scale [30], which ranges from 1 (strongly disagree) to 7 (strongly agree).
Usabilitydescribes whether the system (i.e., CollabTouch) can be used to achieve specific goals in respect to effec- tiveness, efficiency and satisfaction [31]. Usability of the system may be evaluated by two standardized questionnaires:
the ISO-Norm 9241/10for evaluating system ergonomics and the user experience questionnaire (UEQ) for assessing user satisfaction [32], [33]. The ISO-Norm questionnaire consists of the following factors:appropriateness,self-descriptiveness, controllability, conformity with user expectations, fault toler- ance, customizability, and suitability for learning. Thereby, appropriateness expresses the ability of the system to support the execution of a user task without unnecessarily straining the user.Self-descriptiveness, in turn, describes whether the system offers enough explanations and is sufficiently understandable.
Controllability expresses the ability to influence the way the user interacts with the system. Furthermore, conformity with user expectations measures whether system behavior meets expectations (i.e., by providing a uniform and comprehensible interaction design). Fault tolerance describes that, despite erroneous inputs, the system offers users the opportunity to achieve the intended results with little or no compensation effort.Customizabilityexpresses the ability to adapt the system to the individual needs and requirements of users with little efforts. Finally, suitability for learningmeasures whether the system has been designed such that users can be incorporated with little efforts. Suitability measures whether the system offers user support to facilitate the learning of new functions.
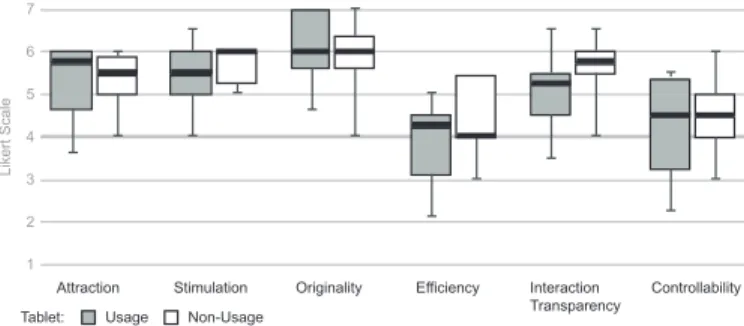
In turn, UEQ describes the personal experience of a subject. It is divided into the following factors: attraction, stimulation, originality, efficiency, interaction, transparency, andcontrollability.Attractionrepresents the overall impression of the system. Stimulation expresses whether or not a user is motivated and stimulated to use the system. Originality refers to the question whether the system is perceived as being innovative and creative, and whether it draws attention to itself.
Efficiency emphasizes that a user is able to work fast and efficiently with the system. In turn, interaction transparency expresses whether the system is comprehensible to users, and, thus, whether it is easy to learn. Finally, controllability expresses the ability to influence the way the user interacts with the system.
Each factor of the ISO-Norm and the UEQ is rated by each subject on a 7-point Likert scale, which ranges from 1 (strongly disagree) to 7 (strongly agree).
D. Experimental Design
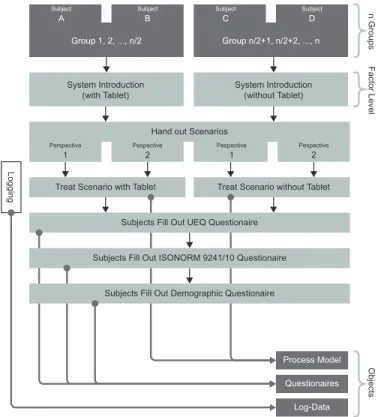
We apply the guidelines described in [27] for designing the experiment. In particular, we conduct a randomized balanced single factor experiment. The experiment is randomized since subjects are assigned to groups randomly. Furthermore, only a single factor varies, i.e., whether or not tablets are used in addition to the touch table. Figure 12 illustrates the design.
Instrumentation and data collection procedure. Col- labTouch is installed on a Samsung SUR40 touch table and Microsoft Surface 1 tablets. To precisely measure response variables in a non-intrusive manner, we use log files gener- ated by CollabTouch. Furthermore, CollabTouch provides a BPMN modeling environment that records all modeling steps together with their attributes (i.e., timestamp, type of modeling action). Furthermore, the created process models are stored in a database. Finally, demographic data and feedback are gathered from the subjects based on paper-based questionnaires that reflect both the ISO-Norm and UEQ (cf. Section IV-C).
E. Risk Analysis
An experiment bears risks that might affect its results.
Thus, its validity or, more precisely, its levels of validity need to be checked, i.e., internal validity (”Are effects caused by independent response variables?”) andexternal validity(”May results be generalized?”).
Risks to internal validity. Risks that might influence the modeling outcome include process modeling experience of the subjects involved as well as an uneven distribution of subjects to the two groups. Furthermore, post data validation ensures that in both groups the subjects are at least moderately familiar with process modeling (cf. Section V-C). It is further assured that both groups have the same or similar familiarity level, i.e., the median on the 7-point Likert scale must be at least 5.0 for individuals and 4.5 for groups. The chosen modeling task constitutes another threat to internal validity. To ensure familiarity of the subjects as well as to guarantee that dif- ferences in quality and granularity result from an appropriate tablet usage, we choose a scenario the subjects know well (i.e., a textually described job application process). Particularly, this prevents faulty models due to lacking domain knowledge. To further ensure that subjects are not negatively influenced due to
Group 1, 2, ..., n/2
System Introduction (with Tablet)
Hand out Scenarios
Treat Scenario with Tablet Treat Scenario without Tablet Subjects Fill Out UEQ Questionaire
Subjects Fill Out ISONORM 9241/10 Questionaire Subjects Fill Out Demographic Questionaire
System Introduction (without Tablet)
Logging
Perspective
1 Pespective2 Pespective1 Pespective2
Subject
A SubjectB
Group n/2+1, n/2+2, ..., n Subject
C Process ModelSubjectD n GroupsFactor LevelObjects
Questionaires Log-Data
Fig. 12. Experiment Design
tiredness, boredom, or hunger, the experiment is conducted at a time of the day for which the mentioned frame of mind can be excluded. Finally, the expected duration of modeling tasks is 60 min. This should prevent faulty models due to lacking motivation. Subjects are recruited on a voluntary basis.
Risks to external validity.The subjects have academic back- ground (i.e., students and research staff), which might limit the generalizability of the results. However, subjects rather have profound knowledge in process modeling (cf. Section V-C).
Hence, we may consider them as proxies for professionals who have obtained basic training so far. As another threat to external validity, process model quality may depend on the appropriateness of the chosen modeling languages and tools.
To mitigate this risk, both groups use an intuitive process mod- eling tool as well as an established process modeling language.
V. EXPERIMENTOPERATION
Based on the provided experiment definition, Section V-A summarizes the experiment preparation. Section V-B describes the execution of the experiment. Section V-C discusses how the data collected during the experiment are validated.
A. Experiment Preparation
Students and research staff familiar with process modeling are invited to join the experiment. Subjects are not informed about the aspects we intend to investigate. However, they know that the experiment takes place in the context of a thesis. For all subjects, anonymity is guaranteed. Before conducting the experiment, CollabTouch and its functions are introduced to the subjects, i.e., by explaining its handling as well as the
gestures supported. Furthermore, a pilot study is performed whose results are used to eliminate ambiguities and misunder- standings as well as to improve the description of the scenario.
B. Experiment Execution
The experiment is executed in a seminar room at Ulm University. All in all 20 subjects (i.e., students and research staff) participate. Thereby, at a time two subjects form a collab- orative modeling group. Several sessions within a period of two weeks are offered. Each session consists of one collaborative modeling group, lasts about 60 minutes, and runs as follows (cf. Figure 12): The procedure of the experiment is presented, CollabTouch and its functions are explained, and worksheets with task descriptions are handed out. Thereby, groups are randomly assigned to one of the two factor levels (cf. Sec- tion IV-D). Then, subjects fill out the initial questionnaire indicating their process modeling experience. This information is used to check whether subjects are familiar with process modeling. Finally, subjects model the process based on task descriptions from the worksheets. After finishing the task, subjects provide their rating regarding system usability (cf.
Section IV-C). Finally, they may provide feedback. All results are stored in the log database of CollabTouch.
C. Data Validation
In total, data from 20 subjects are collected and considered for data analysis; 10 subjects are students and 10 are research associates; three subjects are female. In addition, we check the familiarity of the subjects with BPMN as the experiment design requires subjects to be at least familiar with BPMN. On a 7-point Likert scale, the median value for familiarity is 5.5 (i.e., above average). Prior to the experiment, subjects created 25.6 process models on average over the last 12 months and have known BPMN on average for 3.5 years. Since all values range above average and subjects are familiar with process modeling, we argue that they fit to the targeted profile. The complete data set of the experiment can be accessed (see [18]).
VI. DATAANALYSIS
Section VI-A presents descriptive statistics for the data gathered during the experiment. Section VI-B discusses whether or not a data set reduction is needed. Finally, Sec- tion VI-C tests the hypotheses from Section IV-B.
A. Data Analysis and Descriptive Statistics
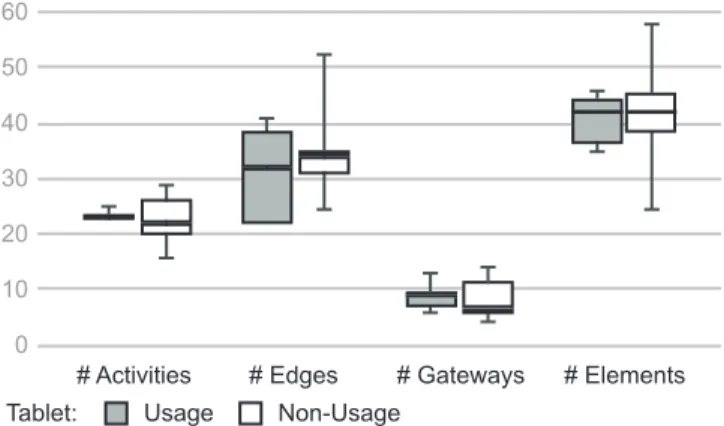
Figure 13 shows box plots (i.e., average, minimum and maximum values as well as 1st and 3rd quartiles) of all measures related to the granularity of process models, i.e., the number of activities, gateways, edges, and total elements. In particular, box plots show that all values measured for tablet usage are similar to the ones measured for non-tablet usage.
However, a higher distribution of model granularity can be observed when not using tablets.
Measurements related to the syntactic quality of process models (cf. Figure 14a) show that subjects using tablets pro- duce fewer syntactical errors in process models. Furthermore, semantic quality is higher for tablet-usage compared to non- usage. In particular, tablet usage results in higher completeness
0 10 20 30 40 50 60
Usage
# Activities # Edges # Gateways # Elements Non-Usage
Tablet:
Fig. 13. Measurements for Granularity
1 2 3 4 5 6 7
Likert Scale
Completeness Validity 0
3 6 9 12
# Syntactical Errors
a) Syntactical Quality b) Semantical Quality Usage Non-Usage
Tablet:
Fig. 14. Measurements for Syntactic and Semantic Quality
(cf. Figure 14b). In turn, validity shows less distributed values when using tablets.
Figure 15 presents results related to the ISO-Norm 9241/10 questionnaire. It shows that all categories for tablet usage, except self-descriptiveness, show the same or higher results.
Especially, this can be observed forcustomizability(+2 Likert points),controllability(+1.5 Likert points), andfault tolerance (+1 Likert point).
1 2 3 4 5 6 7
Likert Scale
TaskAppropriatenessSelf-
DescriptivenessControllability Conformity with User Expectations Fault
Tolerance Customizability Suitability for Learning Usage Non-Usage
Tablet:
Fig. 15. Results of ISO-Norm Questionnaire
Results related to the user experience questionnaire are shown in Figure 16. On average, each dimension of the questionnaire is similar. Regarding differences within each di- mension there is no clear tendency. Thus, it can be summarized that both factor levels tend to provide a similar user experience with respect to attraction and efficiency.
1 2 3 4 5 6 7
Likert Scale
Attraction Stimulation Originality Efficiency Interaction
Transparency Controllability Usage Non-Usage
Tablet:
Fig. 16. Results of User Experience Questionnaire
Figure 17 displays logs resulting from experiment exe- cution. When not using tablets, on average, 28 additional elements are used compared to the combined use of the touch table with tablets. In turn, the average number of deleted elements is 25 elements higher. The number of created edges is about 21 elements higher and shows a higher distribution for tablet non-usage. However, the number of typed characters as well as the modeling duration do not significantly differ.
0 20 40 60 80 100 120
# Created Elements # Deleted Elements # Typed
Characters (x10)# Created Edges Modeling Duration (Minutes) Usage Non-Usage
Tablet:
Fig. 17. Results of CollabTouch Log
B. Data Set Reduction
Generally, results of a statistical analysis depend on the quality of its input data, i.e., faulty data might contribute to incorrect conclusions. Therefore, it is important to identify outliers and to evaluate whether they shall be excluded, i.e., a data set reduction might become necessary. In the experiment, however, no outliers could be identified. Consequently, no data have to be removed.
C. Hypothesis Testing
Due to the small number of subjects (i.e., 20 persons) differences of response variables are not statistically signifi- cant. Thus, we may only indicate tendencies in this section.
The semantic quality tends to be higher for tablet usage. The syntactic quality of process models, in turn, is on average slightly higher at the factor level for tablet usage (1.6 errors less on average). The granularity is about the same for both factor levels. The usability reveals no significant differences as well. Thus, none of the four hypotheses presented in Section IV-B can be rejected.
VII. DISCUSSION
Data analysis reveals tendencies regarding syntactic and semantic quality as well as usability (cf. Section VI). Gran- ularity of process models is similar for both factor levels, however, there is a higher value distribution for non-usage of tablets. One reason might be the higher adoption of, and, thus, familiarity with tablets. Furthermore, process models created by subjects with tablets show fewer syntactical errors. This might be a result of the implemented process model syntax checking provided by CollabTouch (cf. Section III). Semantic quality tends to be higher for tablet usage. In particular, there is a trend towards a higher completeness as well as less distributed values in respect to validity.
The usage of tablets results in a higher usability re- garding system ergonomics (i.e., ISO-Norm questionnaire).
Self-descriptiveness points up higher distribution when using tablets. The more flexible the user arrangement for tablet usage is, the higher customizability turns out to be. Tendencies regarding task appropriateness cannot be discovered. The lack of consensus might be a result of different work practices and personal preferences.
Finally, the interpretation of the log data reveals that subjects create and delete more elements and edges in case of non-usage of tablets. This might be caused by an imprecise touch table screen, demonstrating the importance of a reli- able handling of process modeling tools. Regarding modeling duration, tablet usage tends to require more modeling time.
Subjects might be unfamiliar with the experiment setup (i.e., combination of tablet and touch table). In turn, this might affect quality of process models as well.
Altogether, a trend towards better usability for tablet usage can be observed, but the latter is not significant. Tablet usage tends to produce fewer syntactical errors in process models and show higher syntactical quality. Influences on the granularity of process models can be highlighted in the sense that non- tablet usage shows a higher distribution of created elements.
VIII. RELATEDWORK
This paper investigates the impact of tablet usage, in combination with a touch table, on the quality and granularity of process models. Accordingly, our work relates to existing research on the quality and granularity of process models.
Several frameworks and guidelines in respect to process model quality exist. Among others, the SEQUAL framework uses semiotic theory for referring to different perspectives on process model quality [34], whereas GoM (Guidelines of Process Modeling) describes quality considerations for process models [35]. 7PMG (Seven Process Modeling Guidelines) does not characterize the syntactic or semantic quality of process models, but considers pragmatic quality (e.g., restricting the maximum number of process elements in a process model) [22]. A quality assessment approach of collaborative process modeling is presented in [36]. None of them considers tablet usage in the context of collaborative modeling.
Moreover, significant research on factors affecting process model comprehensibility and maintainability exists. The influ- ence of model complexity on process model comprehensibility has been investigated in [37]. In turn, [38], [39] analyze the
effects of modularity on process understanding. Furthermore, [40] presents empirical results with respect to the understand- ing of declarative process modeling. Numerous approaches exist for creating and changing process models [12], [41], [42]. In particular, [43] presents evidenced change patterns for modifying process models.
Related work in the field of touch gestures needs to be considered as well. A touch table tool supporting users in sharing ideas is presented in [44], [45]. In turn, Touch &
Interact corresponds to an interaction pattern for executing different actions on a prepared display with the help of smartphones [46]. Furthermore, the MARPLE project aims at the integration of process management technology with mobile computing frameworks, and, thus, touch devices [3].
Finally, [2] presents a touch-based application supporting task definition during medical ward rounds with tablets.
In the domain of collaborative process modeling various approaches exist. The Augmented Surfaces system illustrates how laptops with a common display may be applied in the context of collaborative work [47]. In turn, [48] investigates the effectiveness of process modeling on touch tables. Further- more, [6] shows possibilities for creating process models on touch tables collaboratively. In particular, multiple virtual key- boards simplify group work. As a result, even users with little modeling knowledge integrate well in collaborative work with experts. [49] proves the effectiveness of collaborative process modeling. Furthermore, software-assisted process modeling increases process model quality [50]. New process modeling approaches, utilizing 3D world environments for collaborative process modeling, are described in [51]. Finally, Tangible BPM offers a methodology to support subject matter experts during interviews and enables them to participate in closer collaboration with business analysts by using a tangible toolkit [52].
Common to these proposals is their focus on the resulting process model (i.e., the product of process modeling), whereas little attention has been paid on the process of process mod- eling itself [20]. The Nautilus project complements these ap- proaches by investigating the process of process modeling, e.g., to trace model quality back to different modeling strategies resulting in process models of different quality [53], [54].
IX. CONCLUSION
This paper presents a tool enabling users to collaboratively create process models based on tablets and a touch table.
Furthermore, it evaluates whether the combined use of the different devices affects the process of process modeling regarding the quality and granularity of the resulting process models. In particular, an experiment is conducted evaluating whether it is more appropriate for experts to apply tablets and touch tables in combination, or to just use a touch table in collaborative process modeling sessions.
Our results indicate that subject matter experts tend to create less error-prone process models regarding syntactical quality when using tablets. Furthermore, the usability analyses indicate that the use of tablets tends to be more fault tolerant and controllable. For this case, fewer elements are created and deleted. This may be the result of better tablet usability. In an
industrial context, therefore, it is recommendable to use tablets, in addition to a touch table, for process modeling rather than only relying on a touch table for local collaboration.
Future work will investigate the generalization of the presented results in additional experiments as well as the future involvement of subject matter experts from industry.
REFERENCES
[1] P. Dourish, “Process Descriptions as Organisational Accounting De- vices: The Dual Use of Workflow Technologies,” Proc Int’l ACM SIGGROUP Conf on Supporting Group Work, pp. 52–60, 2001.
[2] R. Pryss, D. Langer, M. Reichert, and A. Hallerbach, “Mobile Task Management for Medical Ward Rounds - The MEDo Approach,”
in Business Process Management Workshops, ser. Lecture Notes in Business Information Processing. Springer, 2013, vol. 132, pp. 43–54.
[3] R. Pryss, J. Tiedeken, U. Kreher, and M. Reichert, “Towards Flexible Process Support on Mobile Devices,” in Information Systems Evolu- tion, ser. Lecture Notes in Business Information Processing, vol. 72.
Springer, 2011, pp. 150–165.
[4] J. Kolb, B. Rudner, and M. Reichert, “Towards Gesture-Based Process Modeling on Multi-touch Devices,” inAdvanced Information Systems Engineering Workshops, ser. Lecture Notes in Business Information Processing. Springer, 2012, vol. 112, pp. 280–293.
[5] ——, “Gesture-based Process Modeling Using Multi-Touch Devices,”
Int’l Journal of Information System Modeling and Design, vol. 4, no. 4, pp. 48–69, 2013.
[6] S. D¨oweling, T. Tahiri, B. Schmidt, A. Nolte, and M. Khalilbeigi,
“Collaborative Business Process Modeling On Interactive Tabletops,”
inProc 21st European Conf on Information Systems (ECIS’13), 2013.
[7] G. M. Olson and J. S. Olson, “Distance Matters,” Human-Computer Interaction, vol. 15, no. 2, pp. 139–178, 2000.
[8] J. Kolb, K. Kammerer, and M. Reichert, “Updatable Process Views for User-Centered Adaption of Large Process Models,” inProc 10th Int’l Conf on Service Oriented Computing (ICSOC’12), 2012, pp. 484–498.
[9] ——, “Updatable Process Views for Adapting Large Process Models:
The Proview Demonstrator,” in Proc Business Process Management 2012 Demonstration Track, 2012.
[10] J. Kolb and M. Reichert, “Data Flow Abstractions and Adaptations through Updatable Process Views,” inProc 28th Annual ACM Sympo- sium on Applied Computing (SAC’13), 2013, pp. 1447–1453.
[11] J. Kolb, M. Reichert, and B. Weber, “Using Concurrent Task Trees for Stakeholder-centered Modeling and Visualization of Business Pro- cesses,” in Proc S-BPM ONE 2012, ser. CCIS, no. 284. Springer, 2012, pp. 237–251.
[12] M. Reichert and B. Weber, Enabling Flexibility in Process-aware Information Systems: Challenges, Methods, Technologies. Springer, 2012.
[13] M. Reichert, “ADEPT flex Supporting Dynamic Changes of Workflows Without Losing Control,”Journal of Intelligent Information Systems, vol. 10, no. 2, pp. 93–129, 1998.
[14] OMG, Business Process Model and Notation (BPMN), Version 2.0, Object Management Group Std., 2011.
[15] S. D. Scott, K. D. Grant, and R. L. Mandryk, “System Guidelines for Co-located, Collaborative Work on a Tabletop Display,”Proc 8th Conf on Computer Supported Cooperative Work (ECSCW’03), no. 5, pp. 159–
178, 2003.
[16] S. A. Bly, “A Use of Drawing Surfaces in Different Collaborative Settings,” inProc ACM Conf on Computer-supported Cooperative Work (CSCW ’88). New York, USA: ACM Press, 1988, pp. 250–256.
[17] J. C. Tang, “Findings from Observational Studies of Collaborative Work,”Int’l Journal of Man-Machine Studies, vol. 34, no. 2, pp. 143–
160, Feb. 1991.
[18] S. Ronis, “Collaborative Modeling of Business Processes on Co-located Tabletop Systems,” Master’s Thesis, Ulm University, 2014.
[19] T. M. J. Fruchterman and E. M. Reingold, “Graph Drawing by Force- directed Placement,”Software: Practice and Experience, vol. 21, no. 11, pp. 1129–1164, 1991.
[20] J. Pinggera, S. Zugal, and B. Weber, “Investigating the Process of Process Modeling with Cheetah Experimental PlatformTool Paper,”
in Proc 1st Intl WS Empirical Research Proc.-Oriented Inf. Sys., Hammamet, 2010.
[21] J. Mendling, “Metrics for Business Process Models,” in Metrics for Process Models, ser. Lecture Notes in Business Information Processing.
Springer, 2008, vol. 6, pp. 103–133.
[22] J. Mendling, H. Reijers, and W. M. P. van der Aalst, “Seven Process Modeling Guidelines (7PMG),”Information and Software Technology, vol. 52, no. 2, pp. 127–136, 2010.
[23] D. L. Moody, “Notations in Software Engineering,”IEEE Transactions on Software Engineering, vol. 35, no. 5, pp. 756–778, 2009.
[24] K. Siau and M. Rossi, “Evaluation Techniques for Systems Analysis and Design Modelling Methods - a Review and Comparative Analysis,”
Information Systems Journal, vol. 21, no. 3, pp. 249–268, May 2011.
[25] J. Krogstie, Model-based Development and Evolution of Information Systems: A Quality Approach. Springer, 2012.
[26] O. Holschke, J. Rake, and O. Levina, “Granularity as a Cognitive Factor in the Effectiveness of Business Process Model Reuse,”Lecture Notes in Computer Science, vol. 5701, pp. 245–260, 2009.
[27] C. Wohlin, P. Runeson, M. H¨ost, M. Ohlsson, B. Regnell, and A. Wessl´en,Experimentation in Software Engineering. Springer, 2012.
[28] C. Wolf and P. Harmon, “The State of Business Process Management,”
BPTrends Report, Tech. Rep., 2014.
[29] O. Lindland, G. Sindre, and A. Solvberg, “Understanding Quality in Conceptual Modeling,”IEEE Software, vol. 11, no. 2, pp. 42–49, 1994.
[30] J. Recker, N. Safrudin, and M. Rosemann, “How Novices Model Busi- ness Processes,” in Proc Business Process Management, ser. Lecture Notes in Computer Science. Springer, 2010, vol. 6336, pp. 29–44.
[31] “ISO 9241/11- Ergonomics of Human System Interaction - Guidance on Usability,” International Organization for Standardization, Standard, 1996.
[32] “ISO 9241/10 - Ergonomics of Human System Interaction - Dialogue Principles,” 1996.
[33] B. Laugwitz, T. Held, and M. Schrepp, “Construction and Evaluation of a User Experience Questionnaire,” inHCI and Usability for Education and Work, ser. Lecture Notes in Computer Science. Springer, 2008, vol. 5298, pp. 63–76.
[34] J. Krogstie, Model-Based Development and Evolution of Information Systems. Springer, 2012.
[35] J. Becker, M. Rosemann, and C. von Uthmann, “Guidelines of Business Process Modeling,” in Business Process Management: Models, Tech- niques, and Empirical Studies, vol. 1806. Springer, 2000, pp. 30–49.
[36] D. Ssebuggwawo, “Analysis and Evaluation of Collaborative Modeling Processes,” Ph.D. dissertation, Radboud Universteit Nijmegen, 2012.
[37] J. Mendling, H. Reijers, and J. Cardoso, “What Makes Process Models Understandable?” inProc Business Process Management, ser. Lecture Notes in Computer Science. Springer, 2007, vol. 4714, pp. 48–63.
[38] H. Reijers and J. Mendling, “Modularity in Process Models: Review and Effects,” inProc Business Process Management, ser. Lecture Notes in Computer Science. Springer, 2008, vol. 5240, pp. 20–35.
[39] S. Zugal, P. Soffer, C. Haisjackl, J. Pinggera, M. Reichert, and B. Weber,
“Investigating Expressiveness and Understandability of Hierarchy in Declarative Business Process Models,”Software & Systems Modeling, pp. 1–23, 2013.
[40] C. Haisjackl, I. Barba, S. Zugal, P. Soffer, I. Hadar, M. Reichert, J. Pinggera, and B. Weber, “Understanding Declare Models: Strategies, Pitfalls, Empirical Results,”Software & Systems Modeling, pp. 1–28, 2014.
[41] M. Reichert and P. Dadam, “Enabling Adaptive Process-Aware Infor- mation Systems with ADEPT2,” inHandbook of Research on Business Process Modeling. Hershey, New York, 2009, pp. 173–203.
[42] J. Becker, M. Rosemann, and C. Uthmann, “Guidelines of Business Process Modeling,” in Business Process Management, ser. Lecture Notes in Computer Science. Springer, 2000, vol. 1806, pp. 30–49.
[43] B. Weber, M. Reichert, and S. Rinderle-Ma, “Change Patterns and Change Support Features–Enhancing Flexibility in Process-Aware In- formation Systems,”Data and Knowledge Engineering, vol. 66, no. 3, pp. 438–466, 2008.
[44] S. Oppl and C. Stary, “Facilitating Shared Understanding of Work Sit- uations Using a Tangible Tabletop Interface,”Behaviour & Information Technology, vol. 33, no. 6, pp. 619–635, 2014.
[45] D. Wachholder and S. Oppl, “Interactive Coupling of Process Models:
A Distributed Tabletop Approach to Collaborative Modeling,” inProc European Conf on Cognitive Ergonomics. ACM, 2014, pp. 31:1–31:8.
[46] R. Hardy and E. Rukzio, “Touch & Interact: Touch- based Interac- tion of Mobile Phones with Displays,” Proc. of the 10th Int’l Conf on Human Computer Interaction with Mobile Devices and Services (MobileHCI’08), pp. 245–254, 2008.
[47] J. Rekimoto and M. Saitoh, “Augmented Surfaces: a Spatially Contin- uous Work Space for Hybrid Computing Environments,”Proc SIGCHI Conf on Human Factors in Computing Systems: The CHI Is The Limit, pp. 378–385, 1999.
[48] H. Wittern, “Empirical Study Evaluating Business Process Modeling on Multi-touch Devices,”IEEE Int’l Conf on Software Science, Technology and Engineering (SWSTE’12), pp. 20–29, 2012.
[49] B. Scholtz, A. Calitz, and I. Snyman, “The Usability of Collaborative Tools: Application to Business Process Modelling,”Proc South African Institute for Computer Scientists and Information Technologists Conf (SAICSIT ’13), pp. 347–358, 2013.
[50] P. Rittgen, “Collaborative Modeling of Business Processes A Com- parative Case Study,” inProc ACM symposium on Applied Computing (SAC’09), 2009, pp. 225–230.
[51] R. A. Brown, “Conceptual Modelling in 3D Virtual Worlds for Process Communication,”Proc 7th Asia-Pacific Conf on Conceptual Modelling (APCCM’10), vol. 110, pp. 25 – 32, 2010.
[52] A. Grosskopf, J. Edelman, and M. Weske, “Tangible Business Process Modeling Methodology and Experiment Design,” inBusiness Process Management Workshops, 2010, vol. 43, pp. 489–500.
[53] J. Pinggera, P. Soffer, S. Zugal, B. Weber, M. Weidlich, D. Fahland, H. Reijers, and J. Mendling, “Modeling Styles in Business Process Modeling,”Enterprise, Business-Process and Information Systems Mod- eling, vol. 113, pp. 151–166, 2012.
[54] J. Pinggera, P. Soffer, D. Fahland, M. Weidlich, S. Zugal, B. Weber, H. Reijers, and J. Mendling, “Styles in Business Process Modeling: an Exploration and a Model,” Software & Systems Modeling, pp. 1–26, 2013.
![Figure 2) [12]. An activity either corresponds to a human task (i.e., it requires user interaction) or to a service representing an automated task](https://thumb-eu.123doks.com/thumbv2/1library_info/5209681.1668829/2.918.528.820.514.843/figure-activity-corresponds-requires-interaction-service-representing-automated.webp)