Navigating in Process Model Repositories and Enterprise Process Information*
Markus Hipp
Group Research & Advanced Engineering Daimler AG, Germany
markus.hipp@daimler.com
Bela Mutschler and Bernd Michelberger University of Applied Sciences Ravensburg-Weingarten, Germany bela.mutschler@hs-weingarten.de bernd.michelberger@hs-weingarten.de
Manfred Reichert Institute of Databases and
Information Systems University of Ulm, Germany manfred.reichert@uni-ulm.de
Abstract—Although process-aware information systems have been adopted in enterprises for many years, they still do not properly link the business processes they implement with re- lated enterprise process information (e.g., guidelines, checklists, templates, and e-mails). On one hand, process management technology is used to design, implement, enact, and monitor processes. On the other, enterprise process information is spread over various sources like shared drives, databases, and enterprise information systems. As a consequence, users often manually link process information with particular process objects (e.g., using process portals). What is needed instead, however is an integrated access to both processes and related enterprise process information. This paper establishes such a link by introducing an integrated navigation space for process model collections and related enterprise process information. In particular, this navigation space allows process participants to flexibly navigate within process model collections, single process models, and related process information. In turn, this enables advanced end- user support for process repositories.
I. INTRODUCTION
In many domains, large and complex processes can be found [1]. Examples include automotive engineering [2] and patient treatment [3]. Usually, respective processes refer to a variety of enterprise process information (process information for short) like, for example, guidelines, checklists, corporate rules, e-mails, forms, and best practices [4].
Process-aware information systems have been adopted in enterprises for many years and large process model repositories have emerged in this context [5]. In general, a process model repository not only comprises process models, but related pro- cess information as well. To cope with this information load, various services for querying, comparing and handling process models as well as related process information have been developed [6], [7]. What is missing, however, are advanced concepts enabling an integrated access to both process models and related process information [8]. On one hand, process man- agement technology is used to design, implement, enact, and monitor processes. On the other, relevant process information is spread over various sources like shared drives, databases, and enterprise information systems. To establish a link between the different artifacts, i.e., to provide an integrated view
*This research has been done in the niPRO project funded by the German Federal Ministry of Education and Research (BMBF) under grant number 17102X10. More information can be found at http://www.nipro-project.org.
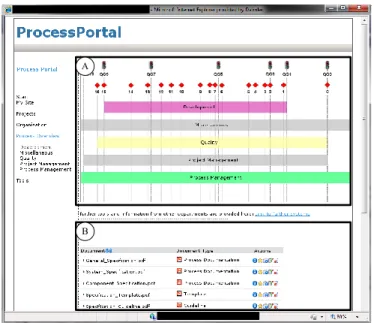
on business process models and related process information, process portals have been introduced. As an example consider the snapshot of a process portal from the automotive domain as shown in Fig. 1. Process model collections are visualized in terms of colored rectangles (cf. Fig. 1A). Process models of a particular collection may be accessed by double-clicking on the respective rectangle. Finally, process information related to an entire process model collection or a single process model is presented to users through a document list [5] (manually created by an administrator) (cf. Fig. 1B).
A: Process Model Collection; B: Process Information B
A
Fig. 1. Example of a process portal from the automotive domain.
As a major drawback of such a rigid process portal, the link between process models and process information is defined statically. In two case studies, which we performed in this context (cf. [9], [10]), we showed that this usually leads to large and static process maps [11]. Instead, process participants need intuitive support for navigating in process model collections as well as for accessing related process information. In this context,navigationrefers to the way, users may interact with a process model repository. For example, a user may want to navigate from the visualization of a process model collection to the one of a single process task enriched
with required process information.
In previous work, we presented the niPRO framework for integrating process models with related process informa- tion [12]. Specifically, niPRO comprises two major compo- nents:POIL(Process-Oriented Information Logistics) [13] and ProNaVis (Process Navigation and Visualization) [14], [15].
The former enables the semantic integration, analysis and delivery of process models and related process information, whereas the latter deals with the visualization of and the navigation in process model collections. This paper comple- ments this work by introducing a navigation space that enables users to navigate in process model collections, single process models, and related process information in an integrated and intuitive way.
The remainder of this paper is organized as follows: Section II gives background information required for understanding this paper. Section III introduces an example from the auto- motive domain and Section IV discusses related requirements.
Section V then presents our conceptual approach whose use is illustrated in Section VI. Finally, Section VII discusses related work and Section VIII concludes the paper.
II. THE NIPRO FRAMEWORK
To enable an integration of process models with related process information, the niPRO framework was introduced in [12]. Fig. 2 depicts its four architectural layers, which are organized in two components: POIL and ProNaVis.
ProNaVis POIL
Integration (A) Analysis (B) Navigation (C) Visualization (D)
Fig. 2. The niPRO framework.
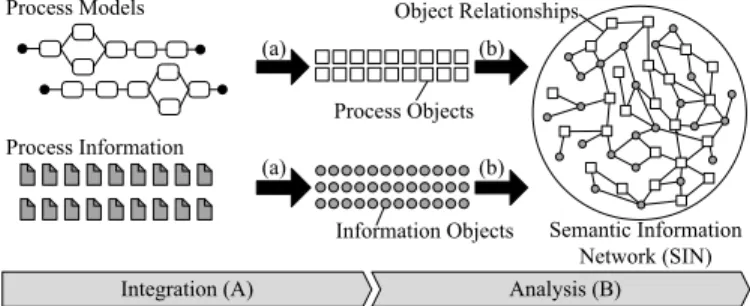
The POIL component comprises two layers: Integration (A) and Analysis (B) [16]. The former layer deals with the semantic integration of process models and related process information that stems from distributed, heterogeneous data sources (cf. Fig. 3a). For this purpose, each process model is automatically split into its atomic process objects1 (e.g., all elements provided by the BPMN standard such as tasks, gateways, events, roles, and data objects) [13], [17]. In turn, process information, such as checklists or best practices, is represented throughinformation objects.
Process and information objects are then analyzed and linked on layer B (cf. Fig. 3b). During this analysis phase, the relationships between process objects, between information objects, and between process and information objects are identified (cf. Tab. I).
Relationship between Implicit Explicit
process objects semantic analysis process model information objects semantic analysis manual links process and information objects semantic analysis manual links
TABLE I. IMPLICIT AND EXPLICIT OBJECT RELATIONSHIPS.
An object relationship may be either explicit or im- plicit [13]. Explicit relationships are directly contained in
1An open-source plugin for integrating process models is available at http://sourceforge.net/projects/signaviocontent/.
process models. For example, the sequence flow contained in a process model can be directly mapped to process object relationships (cf. Fig. 4a). In fact, the entire structure of a process model can be mapped to process object relation- ships [13]. For example, consider Fig. 4b, which shows a structural relationship between a swimlane and a process task, indicating that the task is contained in the swimlane.
Process Models
Process Information
Information Objects Process Objects
Semantic Information Network (SIN) Object Relationships
Analysis (B)
(a) (b)
Integration (A)
(a) (b)
Fig. 3. Integrating process models and related process information.
In turn, implicit relationships connect objects related to the same topic or used in the same working context (e.g., a guideline similar to another one) (cf. Fig. 4c). Such relations can be determined based on semantic algorithms (cf. [16]).
Guideline Guideline is similar;0.86 sequence;1.0
Task Swimlane
structure;1.0
Task (c)
(a) (b)
Task
Fig. 4. Examples of object relationships.
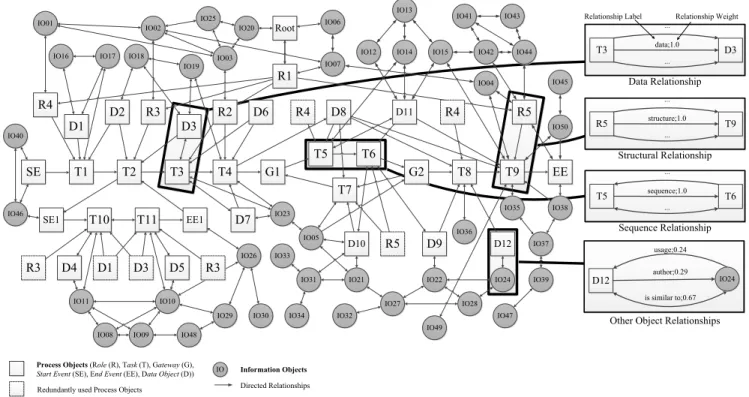
Relationships are both labeled (e.g., ”is similar”) and weighted. A weight is expressed in terms of a value ranging from 0 to 1: 1 indicates the strongest possible relationship and 0 the weakest one [18]. Note that this allows documenting the semantics as well as the strengths of an object relationship.
As a result of the described integration (layer A) and analysis (layer B), we obtain a semantic information network (SIN) [13]. A SIN consists of process models (i.e., sets of process objects), process information (i.e., information ob- jects), and object relationships (cf. Fig. 3). Particularly, it provides a uniform view on process models and related process information, and hence constitutes the interface between the aforementioned POIL and ProNaVis components (cf. Fig. 2).
In the following, we describe how a navigation space for process model collections and related process information can be constructed from a given SIN.
III. ILLUSTRATINGEXAMPLE
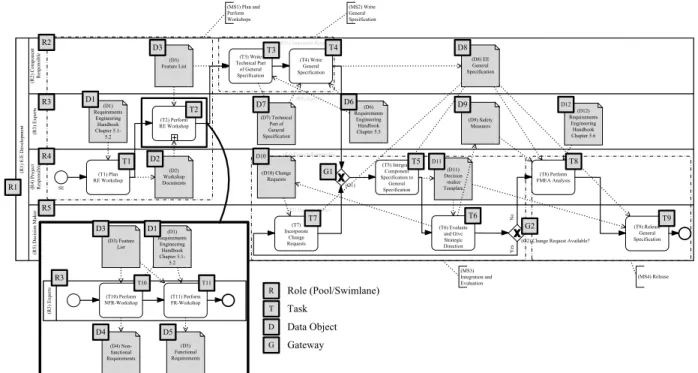
In order to illustrate our approach, we refer to a real- world scenario from the automotive domain. It consists of a process model collection dealing with the development of electric/electronic systems for cars [2]. In detail, the scenario comprises process models related torequirements engineering.
We consider a general specification process (cf. Fig. 5) that involves 5 roles:E/E development (R1),Component Responsi- ble (R2),Expert (R3),Project Responsible (R4), and Decision Maker (R5). In addition, the process comprises 11 tasks (i.e., T1-T11)related to the preparation, creation and validation of a
(R1) E/E Development (R3) Experts
(R3) Experts
(T2) Perform RE Workshop (D1)
Requirements Engineering
Handbook Chapter 5.1- 5.2
(D7) Technical Part of General Specification
(D9) Safety Measures (D6)
Requirements Engineering Handbook Chapter 5.5
(D12) Requirements
Engineering Handbook Chapter 5.6 (R2) Component Responsible
(R2) Component Responsible (T3) Write
Technical Part of General Specification
(T4) Write General Specification (D3)
Feature List
(D8) EE General Specification
(R4) Project Responsible
(R4) Project Responsible (T1) Plan
RE Workshop SE
(T5) Integrate Component Specification to
General Specification
(T8) Perform FMEA Analysis (D11)
Decision -maker Template (D10) Change
Requests (D2)
Workshop
Documents (G1)
(R5) Decision Maker (R5) Decision Maker
(T6) Evaluate and Give Strategic
Direction (G2) Change Request Available?
(T7) Incorporate
Change Requests
(T9) Release General Specification (MS1) Plan and
Perform Workshops
(MS2) Write General Specification
(MS3) Integration and Evaluation
(MS4) Release
YesNo
(R3) Experts
(T10) Perform
NFR-Workshop (T11) Perform FR-Workshop (D3) Feature
List
(D1) Requirements Engineering
Handbook Chapter 5.1- 5.2
(D4) Non- functional Requirements
(D5) Functional Requirements
R1 R2
R3
R4
R5
T1
T2
T3 T4
T5
T7 T6
T8
T9
T10 T11
D1
D3
D2
D4 D5
D1 D3
D7 D6
D8
D9
D10
D11
D12
R Role (Pool/Swimlane) T Task
D Data Object R3
G1
G2
G Gateway
Fig. 5. Thegeneral specificationprocess.
general specification of a car component. In turn, these process tasks refer to 12 data objects D1-D12.
The SIN representation of this process model that results after completing the integration (layer A) is shown in Fig. 6.
We use a shared drive as data source for information objects.
These information objects are integrated into the SIN based on semantic and syntactic analyses (layer B). For the sake of simplicity, detailed information on single relationship labels and weights are only illustrated in few examples. Further, note that the SIN from Fig. 6 is simplified regarding its overall size, i.e., it only covers a part of the actual SIN representing the scenario of our running example. Usually, a SIN may comprise hundreds or thousands of linked process and information objects.
IV. REQUIREMENTS
First of all, we summarize fundamental requirements for navigating in process model collections and related process information (cf. Table II). The requirements were identified in the context of two case studies ([9], [10]) in the healthcare and automotive domains as well as a comprehensive literature survey [19]. Both case studies are based on expert interviews and questionnaires. Considering the similar observations made in the two domains, we may assume that these requirements are applicable to other domains as well.
Req #1 (Integration): Process model collections and related process information shall be provided in an integrated manner.
For example, an engineering process usually refers to hundreds or thousands of documents. In turn, in healthcare, paper-based medical records should be linked to the tasks emerging during medical ward rounds [20].
Req #2 (Interaction): Process stakeholders must be able to effectively interact with process model collections and related
process information. For example, consider a requirements en- gineer creating the specification of a car control unit. Usually, an engineer is solely interested in process information related to specific process tasks. Hence, flexible interaction support is required that allows hiding non-relevant process information or switching to preceding/succeeding process tasks.
Req #3 (Personalization): Process stakeholders need to be supported with personalized visualizations of a process model collection and related process information. For example, when a requirements engineer starts creating a specification, certain process information is needed. First, he might be interested in temporal process information (e.g., deadlines). Second, after completing the specification, he might need information on follow-up process tasks or contact persons.
Req #4 (Detail Level): Process model collections and related process information should be presented to users at different levels of detail. For example, a requirements engineer needs detailed process information (e.g., checklists, guidelines, and task description) when working on a particular process task. In turn, a project manager asks for process information on a more abstract level, e.g., a management summary or an overview of the currently executed process tasks.
Req #5 (Consistency): Process model collections and re- lated process information need to be presented in a consistent manner. The use of different formats and tools might distract process stakeholders.
V. THEPRONAVISNAVIGATIONSPACE
This section introduces advanced concepts for constructing a navigation space for a given process model collection and related process information based on a SIN. Section V-A presents our overall vision. Sections V-B and V-C then describe how the navigation space can be constructed.
T1 T2
SE T3 T4 G1
T5 T6
T7
G2 T8 T9 EE
SE1 T10 T11 EE1
R4 D1
D2 R3 D3
R2 D6
R3 D4 D1 D3 D5 R3
D7
R4 D8 D11 R4 R5
D10 R5 D9 D12
R1
IO01 Root
IO02
IO03
IO04
IO05 IO06
IO07
IO08 IO09
IO10 IO11
IO12 IO13
IO14 IO15
IO16 IO17 IO18
IO19
IO20
IO21 IO22
IO23
IO24 IO25
IO26
IO27 IO28
IO29 IO30
IO31
IO32 IO33
IO34
IO35
IO36
IO37 IO38
IO39 IO40
IO41
IO42 IO43
IO44
IO45
IO46
IO47
IO48 IO49
IO50
Process Objects (Role (R), Task (T), Gateway (G), IO
Start Event (SE), End Event (EE), Data Object (D)) Information Objects Directed Relationships Redundantly used Process Objects
D12 IO24
usage;0.24
is similar to;0.67 author;0.29
Other Object Relationships T5
...
...
sequence;1.0
T6 Sequence Relationship R5
...
...
structure;1.0
T9 Structural Relationship T3
...
...
data;1.0
D3 Data Relationship
Relationship Label Relationship Weight
Fig. 6. A SIN representing thegeneral specificationprocess from Fig. 5 (partial view).
Req # Requirement Source
Lit CS1 CS2
Req #1 Integration
Process model collections and process information should be provided in an integrated manner.
l l
Req #2 Interaction
Process stakeholders should be enabled to interact with process model collec- tions and related process information.
l l
Req #3 Personalization
Process stakeholders should be sup- ported with personalized presentations of process model collections and related process information.
l l l
Req #4 Detail Level
Process model collections and related process information should be presented to users at different levels of detail.
l l
Req #5 Consistency
Process model collections and related process information should be presented in a consistent manner.
l l
Lit:Literature Study;CS1:Case Study 1 (healthcare);CS2:Case Study 2 (automotive)
TABLE II. MAIN REQUIREMENTS.
A. Vision
In order to construct the navigation space, first of all, we reorganize the SIN (cf. Sect. III). Specifically, we transform the existing network into a hierarchical structure that allows us to derive three navigation dimensions: the semantic dimension, geographic dimension, and view dimension. The semantic dimension allows displaying process and information objects on different levels of detail. The latter range from abstract process information (e.g., names of process tasks) to more detailed one (e.g., all information available for process tasks).
The geographic dimension enables visual zooming without changing the level of detail. Think of a magnifier while reading a newspaper. Finally, the view dimension allows users to
focus on specific process aspects while eliminating others. For example, a temporal view on a process shall enable process participants to easily identify deadlines or other temporal con- straints, whereas an organizational view should provide access to information objects like contact persons or documents.
Using these three navigation dimensions in combination, the requirements from Table II can be met. Altogether, the three navigation dimensions form the navigation space.
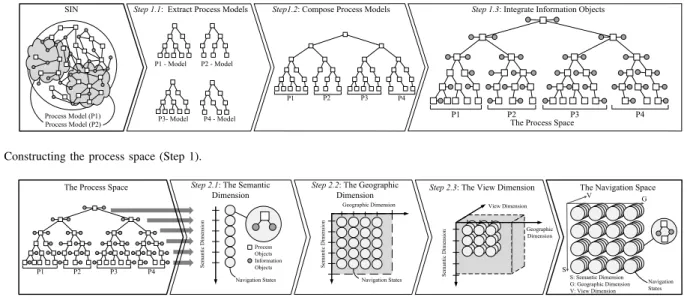
Basically, the navigation space is constructed in two con- secutive steps taking a SIN as input:
Step 1 (Process Space) First, the process space is con- structed. It represents a harmonized, but preliminary data structure that is used to construct the navigation space. For deriving the process space of a SIN, we first extract the objects related to single process models from the SIN (cf. Fig. 7, Step 1.1). Each extracted process model is then represented as a tree-like structure2. Then, we compose the extracted models to a single structure representing the entire process model collection (cf. Fig. 7, Step 1.2). Finally, we add the information objects retrieved from the SIN by following the object relationships between the extracted process objects and their related information objects (cf. Fig. 7, Step 1.3). Section V-B explains these sub-steps in detail.
Step 2 (Navigation Space)Taking the process space derived in Step 1 as input, the navigation space is constructed in this context. In particular, the already mentioned navigation dimensions (cf. Sect. V-A) need to be covered. First, the semantic dimension is constructed based on the tree levelsof the process space. Thereby, all process and information objects belonging to the same level constitute a particular navigation
2This structure can be determined based on the structural object relation- ships of the SIN. i.e., structural relationships.
SIN Step 1.1: Extract Process Models Step1.2: Compose Process Models Step 1.3: Integrate Information Objects
The Process Space Process Model (P1) P3- Model P4 - Model
P2 - Model P1 - Model
Process Model (P2)
P1 P2 P3 P4
P1 P2 P3 P4
Fig. 7. Constructing the process space (Step 1).
The Process Space Step 2.1: The Semantic
Dimension Step 2.2: The Geographic Step 2.3: The View Dimension
Dimension The Navigation Space
S V G
S: Semantic Dimension G: Geographic Dimension V: View Dimension View Dimension
Geographic Dimension
Semantic Dimension
Geographic Dimension
Semantic Dimension
Navigation States
P1 P2 P3 P4 S
emantic Dimension
Process Objects Information Objects
Navigation States Navigation
States
Fig. 8. Constructing the navigation space (Step 2).
state (cf. Fig. 8, Step 2.1). Second, the geographic dimension extends the semantic one by adding zooming functions (cf.
Fig. 8, Step 2.2). Third, the view dimension visualizes process and information objects of both the semantic and geographic dimension (cf. Fig. 8, Step 2.3). By combining the three navigation dimensions, we obtain the overall navigation space.
Section V-C presents the details regarding the construction of the navigation space.
B. Step 1: Constructing the Process Space
As a first challenge, we need to construct the process space. A process space constitutes a harmonized data structure that provides the basis for deriving the navigation space. The construction of the process space comprises three steps:
Step 1.1 (Extract Process Models from the SIN)
We first extract process models from the SIN and represent each model in terms of a hierarchical data structure. In this context, we introduce a generic root nodeas unique identifier for each process model. Then, we create a hierarchical struc- ture for each process model. For this purpose, we utilize the relations of a SIN, e.g., object relationships (cf. Fig. 9). Note that there exist various types of object relationships (cf. Fig.
4). During Step 1.1, structural and data relationships are taken into account. Sequence relationships, in turn, are ignored in this context.
T2 T3 T4
R3 R2
R1 Root
R4 T1
0
1
2 2 2
3 3 3 3
Annotated Process Level Process Object
D14 D24 D34 D74
Process Object from type „data object“
Process Level
0 1 2 3
Structural Relationships 4
Data Relationships
T2 T3 T4
R3 R2
R1 Root
R4 T1
0
1
2 2 2
3 3 3
Process Level 3
0 1 2 3
Root 0
Process Level
0
(a) (b) (c)
Using Structural Relationships
Using Data Relationships
Fig. 9. Extracting process models from the SIN (Step 1.1).
Consider again thegeneral specificationprocess we intro- duced in Section III. In particular, we can extract this process model from the SIN shown in Fig. 6. First, we identify the root node (cf. Fig. 9a), which corresponds to process level 0. Then, we analyze the object relations of the SIN. In our example, only process objectR1(i.e., poolE/E development) is directly related to the root node through a structural relationship. Thus, we assign R1 to process level 1. When consideringR1, roles R2 (i.e., lane component responsible), R3 (i.e., lane expert), and R4 (i.e., lane project responsible) can be identified as related process objects. Accordingly, these roles are assigned to process level 2. Finally, process objectsT1,T2,T3, andT4, of which each represents a single process task, are assigned to process level 3. Due to space limitations, Fig. 9b does not show the resulting hierarchical structure entirely, but only a small part of it. Finally, data objects (i.e., D1, D2, D3, and D7) are assigned to process level 4 (cf. Fig. 9c) based on their relations.
Based on the data structure so far, users may navigate within a single process model, e.g., starting with the root node and then accessing other process objects (e.g., process tasks or data objects). In order to also enable navigation across different process models within a process model collection, the extracted hierarchical structures of the process models need to be composed.
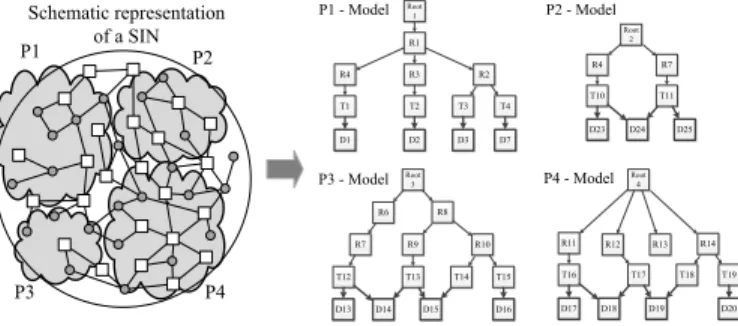
Step 1.2 (Composing Process Models)
First, the process models referring to the same topic are combined. For this purpose, every topic is represented by a manually or automatically created process object (i.e., a topic node). In turn, a topic node belongs to process level -1 and connects all process models exhibiting topical similarity.
Finally, an additional meta topic node is added on process level -2 representing the entire process model collection (cf.
Fig. 11).
As the SIN from Fig. 6 only covers one process model, for the purpose of illustration, we use a schematic representation of a SIN comprising 4 process models (cf. Fig. 10). In our scenario, two relevant topics can be identified (cf. Fig. 11).
T2 T3 T4
R3 R2
R1 Root 1
R4 T1
D1 D2 D3 D7
Schematic representation of a SIN
T11 R7 Root
2 R4 T10
D23 D24 D25
T17 T18 T19
R12 R13 R14
Root 4
R11 T16
D17 D18 D19 D20
P1 - Model P2 - Model
P4 - Model P3 - Model
T13 T14 T15
R9 R10
R8 Root
3 R6
T12
D13 D14 D15 D16
R7
P1 P2
P3 P4
Fig. 10. Four process models extracted from the SIN (Step 1.1).
Both are represented as topic nodes and are assigned to process level -1. In particular, process models P1 and P2 are assigned to topic component specification, whereas process models P3 and P4 are assigned to topicsystem specification. Finally, both topic nodes are connected by a generic node on process level -2 representing the entire process model collection. Starting with this generic node, a user may access all process models of the respective collection as well as related information (i.e., process objects such as tasks).
Generally, process participants are not only interested in navigating across process models, but also want to access pro- cess information. For example, after navigating to a particular process task, the user wants to access process information (e.g., guidelines or checklists) related to this task. Thus, we have to consider the integration of process and information objects.
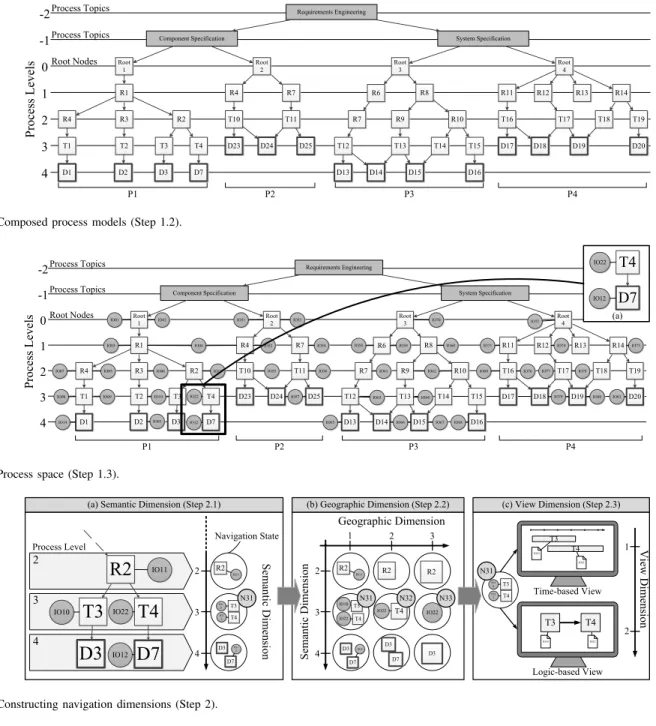
Step 1.3 (Integrate Information Objects)
We integrate SIN information objects based on their se- mantic relations with process objects. As a result, we obtain a hierarchical structure denoted asprocess space(cf. Fig. 12).
The latter allows for a centralized and harmonized access to all process models of a given process model collection and its related process information.
As example consider a requirements engineer creating a component specification for an ABS3 control unit. In order to perform the task write general specification (T4 in our process example from Fig. 5), the engineer may access the process model collection on process level -2 (cf. Fig. 12).
Then, he navigates via topic node requirements engineering to process modelcomponent specification (P1 represented by Root1), and via R1 (representing poolE/E development) and R2 (representing role component responsible) to the task of interest (i.e., T4) on process level 3. At this level, he may further access all information related toT4(cf. Fig. 12a), e.g., a specification guideline (IO22).
C. Step 2: Constructing the Navigation Space
Taking the process space resulting from Step 1 as input, the navigation space can now be derived by consecutively constructing the three navigation dimensions (cf. Fig. 8).
Step 2.1 (Deriving the Semantic Dimension)
All process and information objects that belong to a partic- ular process level of the process space correspond to a single navigation state. In turn, each navigation state represents a
3ABS: Anti-lock Braking System.
particular value of the semantic dimension. Accordingly, the process levels of the process space correspond to values on a discrete scale represented by the semantic dimension of the navigation space (cf. Fig. 13a). Note that this approach has been inspired by the concept of semantic zooming as originally introduced in [21].
Due to lack of space, we only consider a small part of the process space from Fig. 12 as shown in Fig. 13a. Assume that a navigation starts with objectR2 on process level 2, i.e., only process and information objects on process levels 2-4 are considered. Regarding the selected part, the navigation state corresponding to process level 2 includes objects R2 and IO11. In turn, navigation state N31, which corresponds to process level 3, comprises objectsIO10,T3,IO22, andT4.
Step 2.2 (Deriving the Geographic Dimension)
In general, a navigation state may comprise a large number of process and information objects. To cope with this, the geographic dimension allows users to control the number of process and information objects to be displayed (cf. Fig. 13b).
Decreasing the scale of the geographic dimension increases the number of objects displayed (cf.N31in Fig. 13b). In turn, increasing this scale allows users to focus on fewer or even single objects (cf. N33 in Fig. 13b). Technically, we apply zooming and panning techniques as proposed in [11] and [22].
Like the semantic dimension, the geographic one is divided into discrete values. Thus, each combination of values of the geographic dimension (i.e., a certain scale) and the semantic one (i.e., a certain process level) may be represented as a navigation state in a 2-dimensional navigation space (cf. Fig.
13b). From a conceptual point of view, the 2-dimensional navigation space corresponds to the matrix depicted in Fig.
13b.
As an example consider navigation state N31 in Fig.
13a. It comprises objects T3,T4, IO10, and IO22. Assume that a requirements engineer who is creating a component specification wants to learn more about his current process task (i.e., T4). For this purpose, he selects process level 3 in the semantic dimension, which includes task T4 as well as all other objects assigned to this level. By default, the resulting navigation state N31 is associated with geographic value 1 (i.e., a small scale). The requirements engineer may now reduce the number of objects included inN31by zooming into this state, i.e., by increasing the scale of the geographic dimension. When selectingT4, a state transition to navigation state N32is triggered, which, in turn, focuses on process task T4 and its related information objects (IO22 in the given case). In order to view details of IO22(i.e., the specification template) another state transition toN33may be performed.
Step 2.3 (Deriving the View Dimension)
The view dimension deals with the visualization of process as well as information objects, i.e., the visualization of navigation states. In particular, the view dimension allows transforming process and information objects into various representations (cf. Fig. 13c). On one hand, a time-based view can be used to visualize temporal aspects. Tasks, for example, may be represented by rectangles of different widths indicating their actual durations. On the other, a
T2 T3 T4
R3 R2
R1 Root 1
R4
T1
D1 D2 D3 D7
T13 T14 T15
R9 R10
R8 Root
3 R6
T12
D13 D14 D15 D16
T11 R7 Root
2 R4
T10
D23 D24 D25
T17 T18 T19
R12 R13 R14
Root 4 R11
T16
D17 D18 D19 D20
P1 P2 P3 P4
R7
Component Specification System Specification
Requirements Engineering
-2 -1 0 1 2 3 4
Process Levels
Process Topics Process Topics Root Nodes
Fig. 11. Composed process models (Step 1.2).
T2 T3 T4
R3 R2
R1 Root
1
R4
T1
D1 D2 D3 D7
T13 T14 T15
R9 R10
R8 Root
3 R6
T12
D13 D14 D15 D16
T11 R7 Root
2 R4
T10
D23 D24 D25
T17 T18 T19
R12 R13 R14
Root 4 R11
T16
D17 D18 D19 D20
R7
Component Specification System Specification
Requirements Engineering
IO01 IO02
IO03 IO04
IO05 IO06
IO07
IO09
IO08 IO10
IO11
IO03 IO12 IO14
IO51
IO52 IO53
IO54
IO55 IO56
IO57 IO22
IO58 IO59
IO61 IO62
IO63 IO64
IO67
IO65 IO66 IO68
IO60
IO69
IO70 IO71
IO73
IO76 IO77 IO74
IO79 IO80 IO81
IO78
IO75
P1 P2 P3 P4
T4 D7
IO12 IO22
(a)
-2 -1 0 1 2 3 4
Process Levels
Process Topics Process Topics Root Nodes
Fig. 12. Process space (Step 1.3).
T3 T4 R2
D3 D7
IO10
IO11
IO12 IO22
Semantic Dimension
R2
IO11
T3 T4
IO1 0 IO2 2
D3 D7
IO1 2
2 3 4
Navigation State Process Level
R2
IO11
T3 T4 IO10 IO22
D3 D7
IO12
R2
T4
IO22
D3 D7
R2
IO22
Semantic Dimension D3
Geographic Dimension
View Dimension
T3 T4
IO1 0 IO2
2 Time-based View
Logic-based View T3
T4
IO10 IO22
IO10 IO22
T4 T3
(a) Semantic Dimension (Step 2.1) (b) Geographic Dimension (Step 2.2) (c) View Dimension (Step 2.3)
4 3 2
1 2 3
4 3 2
1
2
N31 N31 N32 N33
N31
Fig. 13. Constructing navigation dimensions (Step 2).
logic-based view may be used to emphasize logical relations, i.e., predecessor/successor relations between tasks. Other views, not shown in Fig. 13c, might focus on the visualization of information objects (e.g., documents).
Overall, the constructed navigation space allows tailoring the number of displayed process and information objects. The latter can be visualized according to specific user needs based on the view dimension. Accordingly, navigation corresponds to transitions between navigation states. A formal model for representing such transitions is presented in [15].
Table III summarizes how the presented navigation ap- proach meets the requirements discussed in Section IV.
Req # Requirement Process Space Navigation Space
S G V
Req #1 Integration 3
Req #2 Interaction 3 3 3 3
Req #3 Personalization 3 3 3
Req #4 Detail Level 3 3
Req #5 Consistency 3
S:Semantic Dimension;G:Geographic Dimension;V:View Dimension
TABLE III. REQUIREMENTS FULFILMENT.
VI. IMPLEMENTATION ANDPRELIMINARYVALIDATION
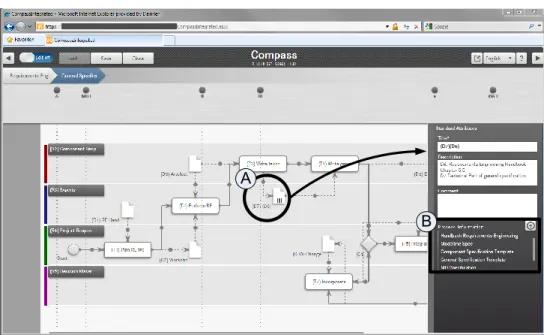
This section presents results from the application of the pre- sented navigation concept in a real-world environment from the automotive domain. Section VI-A introduces Compass, a tool implementing our concept with particular focus on processes for developing electric/electronic components of a car [23].
However, we do not only present Compass, but also validate the developed concept. For the latter purpose, we perform a controlled user experiment comparing this navigation concept with the static one used in the process portal depicted in Fig. 1. Section VI-B presents the experiment design, Section VI-C discusses experiment results, and Section VI-D addresses threats of validity.
A. Implementing our Navigation Concept in Compass Compass is a tool that aims to support knowledge workers who deal with the engineering of electric/electronic com- ponents for cars, trucks, and buses. In particular, Compass allows navigating in process model collections based on the navigation space described in Section V.
The Compass user interface comprises three major com- ponents (cf. Fig. 14): First, theprocess management area(cf.
Fig. 14A) provides management functions (e.g., a breadcrumb navigation and a timeline showing important dates). Second, the tool area (cf. Fig. 14B) provides functions for interacting with process model collections. Third, contents (i.e., process models and process information) are depicted in the content area (cf. Fig. 14C).
Compass allows integrating process models with relevant process information (Req #1). Further, it supports the interac- tions between users and process models (Req #2). In the latter context, the tool provides three different views: a time-based view (cf. Fig. 14), a logic-based view (cf. Fig. 15), and a text view (not shown) (Req #3). It also implements the presented navigation dimensions (i.e., semantic, geographic, and view dimension) (Req #4). Finally, Compass enables an integrated access to process models and enterprise process information through a single user interface (Req #5).
Figs. 14 and 15 refer to the example from Section III. Fig.
14 shows the visualization of the Requirements Engineering process model collection on process level -1 in the semantic dimension. It comprises three process topics (Component, System, and General Specification) represented as rectangles in the time-based view. Thereby, different colors indicate different roles involved in these process topics. Increasing the geographic and semantic dimension, in combination with a change of the view dimension, allows the user to display the underlying process model (cf. Fig. 15), i.e., the logic- based view of our general specification process from Fig. 5, together with related process information on process level 3.
In this context, data objectsD6andD7are displayed as icons (cf. Fig. 15A). By clicking on one of these icons, a window on the right hand side is displayed, which provides detailed information about the data object, including a list with related process information (cf. Fig. 15B) (e.g., additional documents such as guidelines or best practices).
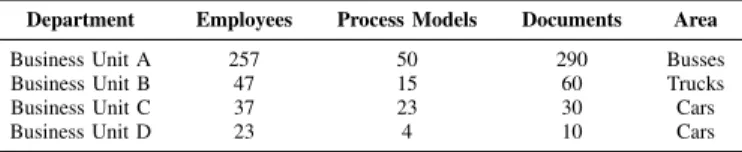
Compass is currently run by 4 business units of an auto- motive manufacturer (cf. Tab. IV) and 364 employees use it during their daily work. Process model collections maintained by Compass comprise between 4 and 50 process models (including between 8 and 37 process tasks) depending on the business unit. 390 documents such as guidelines, checklists, and handbooks are included.
Department Employees Process Models Documents Area
Business Unit A 257 50 290 Busses
Business Unit B 47 15 60 Trucks
Business Unit C 37 23 30 Cars
Business Unit D 23 4 10 Cars
TABLE IV. DETAILS ON THE USE OFCOMPASS.
B. Experiment Design
In order to validate our navigation concept, we performed a controlled user experiment, involving 18 subjects from the automotive domain. Our goal is to investigate the benefit of the developed navigation concept compared to a static, one-dimensional navigation concept. The research question corresponding to our experiment is as follows:
Is three-dimensional process navigation more suitable for navigating in complex process model collections when com- pared to a static, one-dimensional navigation concept. If ’yes’, how strong is this difference?
On one hand, we assume that provision of three navigation dimensions makes navigation more difficult and less intuitive, since the number of navigation options increases. On the other, a more sophisticated navigation support becomes possible.
When designing our experiment, the following criteria are taken into account [24], [25]:
• The design of an experiment shall allow for the collection of as much data as possible with respect to the major goals of the experiment.
• The collected data should be unambiguous.
• The experiment must be feasible for a given setting.
Considering these design criteria, we conduct acontrolled single factor experiment. Subjects are randomly divided into two groups with nine subjects each. The experimental group works with Compass and thus applies the developed navigation concept (experimental system), whereas the control group works with an older version of Compass providing solely a static, one-dimensional navigation concept (control system).
Prior to the start of the experiment, we inform the subjects about goals and procedures. Afterwards, subjects have to perform three introductory tasks in order to become familiar with their tool (and thus with their navigation concept). Then, the actual experiment starts. Based on three typical use cases for requirements engineers in the electric/electronic domain, we derive 6 specific tasks the subjects have to complete. For example, subjects must navigate to a specific process task and search for a related document. While performing the tasks, all subjects are captured on video and encouraged to give direct feedback during the entire session (Think Aloud Method [26]). For each task execution times are captured as well. After finishing all tasks, subjects must fill out a questionnaire concerning their subjective impressions on the navigation concept. In the latter context, they use a 5-step Likert scale reaching from 1 (I totally disagree) to 5 (I totally agree).
Our results do not show normal distribution (calculated with a Kolmogorov-Smirnov test and a Shapiro-Wilk test).
A
B C
A: Process Management Area B: Tool Area
C. Content Area
Fig. 14. Time-based view on the process model collection.
A
B
Fig. 15. Logic-based view on thegeneral specificationprocess.
Thus, a Mann-Whitney U test is applied to calculate signifi- cance values. Applying this test, we are able to assess whether the means of the experimental samples and the control samples are statistically different from each other [27]. All tests are executed based on a 5% significance level (α= 0.05).
C. Experiment Results
Fig. 16 shows results of the experiment. Both navigation concepts are considered as equallyinteresting. Even though the experimental system (ES) shows a higher mean (3.89) than the control system (CS) (3.78), the difference is not significant (p = 0.931). Further, the experimental system is considered as being more vivid (3.78) than the control system (3.22).
Again, no significant difference can be identified (p= 0.297).
All subjects agreed that the navigation in a process model
collection is traceable based on both systems (4.22 for the ES, 4.00for the CS).
The experimental as well as the control system wereeasy to learnfor the participants. More precisely, the control system shows a higher mean (4.56 for the CS and4.33for the ES).
The experimental system is very understandable (4.44), even if it provides more navigation possibilities than the control system, which is perceived as very understandable (4.11) as well. Subjects agreed that navigation iseasywith both systems (4.22 for the ES and 4.00 for the CS), though there are no significant differences (p= 0.863). Finally, the experimental system is moreintuitive(4.33) than the control system (3.78), though this difference is not significant (p= 0.436). The latter is surprising, considering the complexity of our navigation concept (i.e., three navigation dimensions instead of one).
The used process navigation concept is...
interesting
ProNaVis Navigation Concept Control Concept
traceable easy to learn
vivid understandable easy intuitive
* *
*
*
* I totally agree *
I agree
Neutral
I totally disagree I disagree
Fig. 16. Comparing two navigation concepts.
Interestingly, subjects using the experimental system were able to perform their tasks by an average of 13.19 seconds faster than subjects working with the control system. How- ever, this result is not significant (p = 0.370). Finally, the experimental group made significantly less mistakes (0.778 mistakes per task) than the control group (2.278mistakes per task) (p= 0.031∗).
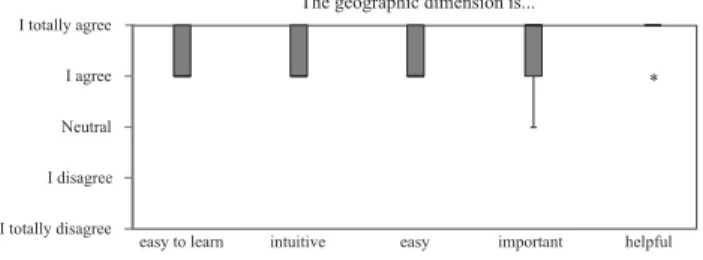
Furthermore, we investigated the three navigation dimen- sions. Note that only the experimental group can be considered here. Fig. 17 shows that subjects agreed or even totally agreed that the geographic dimension iseasy to learn,intuitive,easy, important, and helpfulfor users navigating in process model collections.
I totally agree I agree Neutral
I totally disagree
The geographic dimension is...
intuitive important helpful
I disagree
easy
*
easy to learn
Fig. 17. The geographic dimension.
Subjects further agreed that the semantic dimension is intuitive, important, and helpful for process participants (cf.
Fig. 18). Only one out of the 18 subjects disagreed that the navigation concept iseasy to learn.
The semantic dimension is...
intuitive easy important helpful
easy to learn
*
*
* I totally agree
I agree Neutral
I totally disagree I disagree
Fig. 18. The semantic dimension.
Experiment results related to the view dimension are pre- sented in Fig. 19. As can be seen, this dimension is very importantandhelpfulfor users. Subjects further agreed that it is intuitiveandeasy to learn.
All results of our experiment confirm that the experimental system, which is based on the presented navigation concept,
The view dimension is...
intuitive helpful
easy to learn important
* I totally agree *
I agree Neutral
I totally disagree I disagree
Fig. 19. The view dimension.
is better suitable for navigating in complex process model collections than the control system. Though our experiment mostly did not reveal significant differences, it clearly indicates higher means for all (except one) variables. In particular, despite its increased complexity, the developed navigation concept does not negatively bias user experience. In contrast, subjects perform tasks faster and make fewer mistakes.
The main lessons learned from this experiment as well as the feedback obtained from Compass users are as follows:
• The provision of a geographic dimension allows for a better overview of a process model collection.
• The possibility to either decrease or increase the number of displayed information objects along the semantic dimension facilitates tool usage.
• Navigating across process models allows for a better understanding of the relations thet exist between single process models.
• The provision of different views allows supporting specific demands of users having different roles (e.g., engineers and managers).
D. Threats of Validity
Generally, there might be risks to be taken into account when performing experimental research. In particular, factors threatening theinternalandexternal validityof the experiment need to be considered. Regarding the described experiment, the threats of internal validity are as follows:
• Subjects. Different experience levels of the subjects involve a crucial factor threatening internal validity.
To limit this threat, we exclusively choose subjects from the industrial sector, i.e., process experts from the area of electric/electronic development processes
in order to guarantee for the same conditions among subjects. This fact also explains the small number of subjects since these experts are hard to recruit. Finally, we randomly assigned subjects to experiment groups in order to achieve a uniform distribution.
• Objects. Objects should not differ in more than one factor in order to make results traceable to this origin.
Note that in the context of the experiment, Compass was used for both groups, i.e., both groups were confronted with similar user interfaces, i.e., solely the applied navigation concepts differed.
• Training.Subjects have obtained the same amount of training for the respective navigation concepts in order to ensure similar levels of knowledge.
Finally, threats of external validity are as follows:
• Experience. In order to guarantee a similar level of experience, all subjects are familiar with the topic of business processes. This might have a negative impact on the external validity since all subjects are experts with respect to the topic of process navigation.
• Process Models.To not falsify results due to compre- hensibility issues regarding the process models used, we chose process models that are semantically easy to understand.
VII. RELATEDWORK
The integration of different enterprise resources is consid- ered in the areas of enterprise resource planning [28], [29]
and enterprise engineering [30], [31]. In this context, the inte- gration of process models, e.g., all information and activities related to a supply chain, constitutes a key factor. Though the benefit of integrated processes is discussed, however, neither the automated integration of enterprise process information nor sophisticated navigation and visualization concepts have been addressed so far.
Research on the flexible visualization of process models (i.e., on what we call view dimension) is presented in [32]
and [33]. More specifically, these approaches introduce aggre- gation and reduction techniques to create flexible views on complex business process models. In [34] and [35], a view framework allowing for updatable and user-centered process views as well as the user-centered modeling and visualization of business processes is presented. [36] focuses on timeline visualizations for documenting and visualizing continuously changing process models. Note that all these approaches solely deal with process models, while the combination of process models and related process information as well as the naviga- tion in respective process spaces are neglected.
Challenges related to zooming functionality in user inter- faces are addressed in [21], which presents zoomable user interfaces for navigating in complex information spaces. The JAZZ-framework [37] applies these concepts. Corresponding user interface concepts include Squidy [38], ZOIL [39], and ZEUS [40]. Zooming and moving in a 3D environment is realized by theFlight Navigatortool [41], which supports nu- merous interaction paradigms enabling users to present, inspect and analyze process models in a 3D environment. Similarly,
[42] and [43] use 3D technology to realize a collaborative approach for modeling business processes. An approach for efficient zooming is presented in [22].
Finally, there exists research on the provision of infor- mation on different detail levels (according to our semantic dimension). Both [44] and [45] make use of process hierarchies in order to efficiently visualize complex process models on small canvas. Respective approaches allow displaying large process hierarchies in their entirety in a compact manner and thus facilitate the presentation of information on different semantic levels. Furthermore, [46] discusses the representation of detailed information about a single activity without losing the overview of the global structure of an organization. Finally, this approach provides a representation technique embedding charts into cells of a tree map.
VIII. SUMMARY ANDOUTLOOK
As business processes are becoming increasingly complex, a static representation of the relationships between process models and process information is no longer sufficient in order to adequately support process stakeholders in their daily work.
This paper presents the ProNaVis navigation concept, a 3- dimensional navigation space enabling a repository support for navigating in large process model collections and related process information. We introduce three navigation dimensions (semantic, geographic, and view dimension) upon which we finally construct the navigation space. The latter allows for an integrated access to both process model collections and process information. We further present Compass, an applica- tion applying these concepts to complex real-world automotive process model collections. Finally, a user experiment shows that more sophisticated navigation possibilities, as provided by our navigation concept, justify the increased complexity.
Future work will include the full implementation of the mentioned concepts as well as their further evaluation based on Compass. Further, we will investigate the effort to establish such a system in an enterprise, as required effort might be a major obstacle for adopting the approach. Therefore, we plan to run Compass in other departments in the automotive sector in order to gather additional experiences and to optimize efforts. Finally, we will develop and empirically investigate additional view-concepts, e.g., visualization options.
REFERENCES
[1] S. K. ¨Ohgren, A., Information Overload in Industrial Enterprises - Results of an Empirical Investigation. in: Proc 2nd European Conf on Information Management and Evaluation (ICIME’08), pp. 343-350, 2008.
[2] D. M¨uller, J. Herbst, M. Hammori, and M. Reichert, IT Support for Release Management Processes in the Automotive Industry. in: Proc 4th Int’l Conf on Business Process Management (BPM’06), pp. 368–
377, 2006.
[3] R. Lenz and M. Reichert, IT Support for Healthcare Processes - Premises, Challenges, Perspectives. in: J on Data and Knowledge Engineering, 61(1), pp. 39–58, 2007.
[4] A. Edmunds and A. Morris,The Problem of Information Overload in Business Organisations: A Review of the Literature. in: Int’l J of Information Management, 20(1), pp. 17–28, 2000.
[5] B. Weber, M. Reichert, J. Mendling, and H. A. Reijers, Refactoring large process model repositories. in: J Computers in Industry 62(5), pp. 467–486, 2011.