Evolution of gene expression between closely related taxa of Mus
I n a u g u r a l – D i s s e r t a t i o n zur
Erlangung des Doktorgrades
der Mathematisch-Naturwissenschaftlichen Fakultät der Universität zu Köln
vorgelegt von
Christian Voolstra
aus
Offenbach am Main
Berichterstatter: Prof. Dr. Diethard Tautz Prof. Dr. Thomas Wiehe
Tag der letzten mündlichen Prüfung: 29.05.2006
Table of Contents
Table of Contents ... i
Danksagung... v
Zusammenfassung... vi
Abstract ...viii
1 Introduction ... 1
1.1 Microarrays as a tool to study evolution of gene expression ... 1
1.2 Intra-specific transcriptome variation ... 2
1.3 Inter-specific transcriptome variation - tempo and mode of transcriptome evolution3 1.4 Transcriptome divergence and speciation ... 4
1.5 The genetic basis of gene expression differences ... 5
1.6 Model/study system – the Mus species complex ... 6
1.7 Project description... 8
2 Material & Methods ... 9
2.1 Animals ... 9
2.2 Microarrays ... 11
2.3 Sample preparation... 11
2.4 Hybridization... 11
2.5 Data Acquistion... 12
2.6 Experimental design... 12
2.7 Genomic DNA hybridizations... 13
2.10 Identification of lineage-specific genes of subspecies of Mus musculus ... 14
2.11 Mitochondrial D-loop sequencing... 14
2.12 Confirmation of differentially expressed genes from the SAM analyses with quantitative real-time PCR (qRT-PCR) ... 15
2.13 Identification of functional categories within lists of differentially expressed genes with DAVID (Database for Annotation, Visualization and Integrated Discovery) ... 16
2.14 Identification of biological processes within lists of differentially expressed genes with PANTHER (Protein ANalysis THrough Evolutionary Relationships)... 17
2.15 Scaled divergence analysis... 17
2.16 dN/dS analysis... 18
3 Results ... 19
3.1 Differentially expressed genes between species and subspecies of Mus ... 19
3.1.1 Genomic DNA hybridizations (CGHs) ... 19
3.1.2 SAM (Significance Analysis of Microarrays) analysis – number of differentially expressed genes between species/subspecies for the different tissues ... 21
3.1.2.1 Gene expression differences between Mus musculus and Mus spretus ... 21
3.1.2.2 Gene expression differences between subspecies of Mus musculus ... 22
3.1.2.3 Comparison of gene expression differences between species and subspecies of Mus ... 22
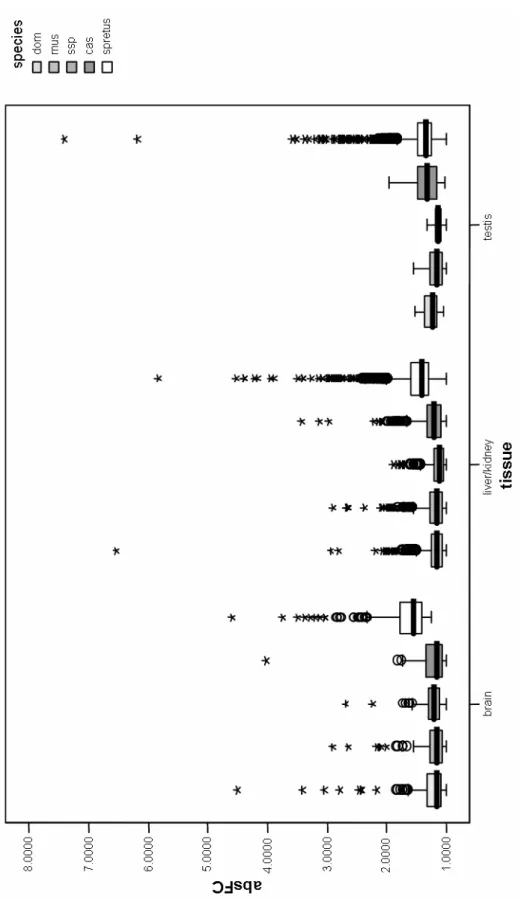
3.1.2.4 Distribution of fold-changes (FC) among significantly differentially expressed genes ... 26
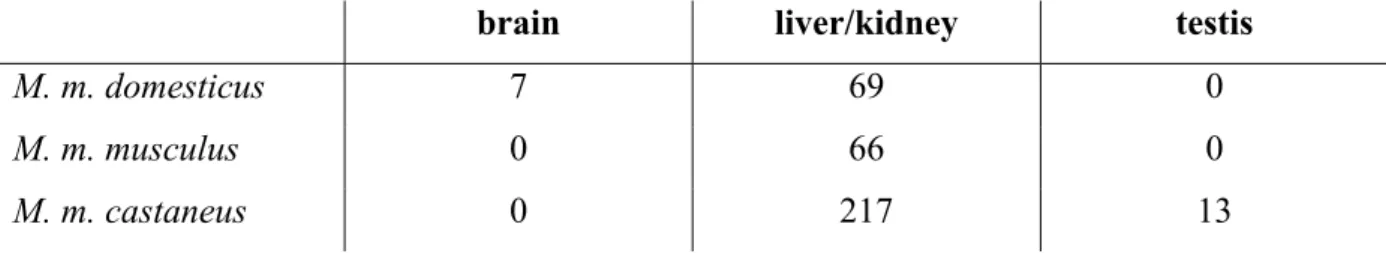
3.1.2.5 Lineage-specific genes in Mus musculus ... 29
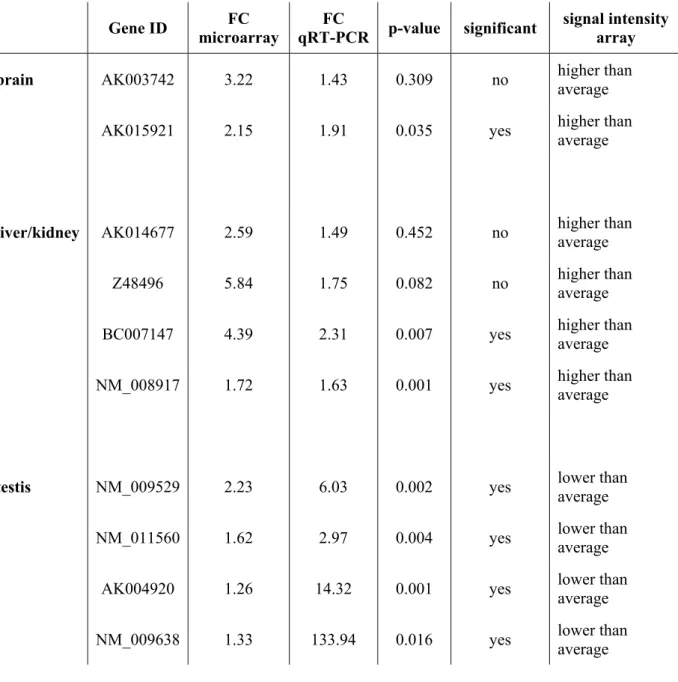
3.2 Confirmation of SAM candidate genes with quantitative real-time PCR (qRT-PCR) ... 32
3.2.1 Genes differentially expressed between Mus spretus and Mus musculus ... 32
3.2.2 Genes differentially expressed between subspecies of Mus musculus... 36
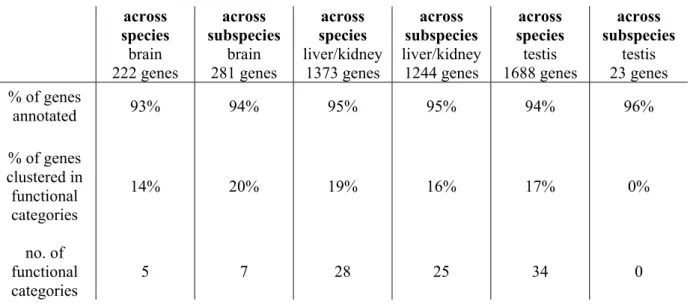
3.3 Identification of functional categories within lists of differentially expressed genes with DAVID (Database for Annotation, Visualization and Integrated Discovery) ... 37
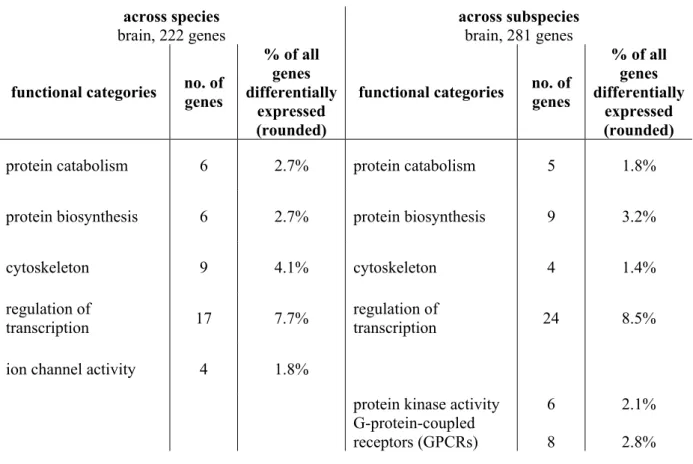
3.3.1 Categories of functional classification within the list of differentially expressed
genes identified in the brain ... 38
3.3.2 Categories of functional classification within the list of differentially expressed
genes identified in the liver/kidney ... 40
3.3.3 Categories of functional classification within the list of differentially expressed genes identified in the testis ... 42
3.4 Identification of biological processes within lists of differentially expressed genes with PANTHER (Protein ANalysis THrough Evolutionary Relationships)... 44
3.5 Genome-wide patterns of expression divergence... 47
3.5.1 Scaled divergence analysis... 47
3.5.2 dN/dS analysis... 53
3.5.2.1 Distribution of dN/dS ratios ... 55
3.5.2.2 Patterns of correlation of evolution of gene expression and sequence evolution ... 55
4 DISCUSSION ... 61
4.1 Gene expression differences between species and subspecies of Mus... 61
4.2 Taxonomic status of Mus musculus ssp. ... 62
4.3 Confirmation of differentially expressed genes with qRT-PCR ... 63
4.4 Functional annotation of candidate genes ... 64
4.5 Correlations of expression divergence and nucleotide sequence divergence ... 66
4.6 Towards evolutionary patterns of species divergence/speciation regarding gene expression divergence ... 67
5 Literature ... 71
6 Appendix ... 77
6.1 Differentially expressed genes between Mus spretus and Mus musculus (SAM 2- class unpaired analysis, 200 permutations, FDR < 5%)... 77
6.1.1 brain – over-expressed genes in Mus spretus... 77
6.1.2 brain – over-expressed genes in Mus musculus ... 78
6.1.6 testis – over-expressed genes in Mus musculus ... 89 6.2 Differentially expressed genes across subspecies of Mus musculus (SAM multiclass analysis, 200 permutations, FDR < 5%) ... 93
6.2.1 differentially expressed genes across subspecies of Mus musculus in the brain..
... 93 6.2.2 differentially expressed genes across subspecies of Mus musculus in the
liver/kidney... 95 6.2.3 differentially expressed genes across subspecies of Mus musculus in the testis..
... 103 6.3 Functional categories within the lists of differentially expressed genes (SAM, 200
permutations, FDR < 5%) identified by the DAVID software ... 104
6.3.1 Categories of functional classification for genes differentially expressed in the
brain between species... 104
6.3.2 Categories of functional classification for genes differentially expressed in the
brain between subspecies ... 104
6.3.3 Categories of functional classification for genes differentially expressed in the
liver/kidney between species... 104
6.3.4 Categories of functional classification for genes differentially expressed in the
liver/kidney between subspecies ... 106
6.3.5 Categories of functional classification for genes differentially expressed in the
testis between species... 107
6.4 List of genes with available UniGene ID and Mus-Rattus dN/dS ratio ... 109
Danksagung
“Everything is a result of comparison.”
J-F. Champollion (translator of the Rosetta Stone), Grenoble, April 1818, letter to his brother
Mein besonderer Dank gilt Professor Dr. Diethard Tautz, der mir diese Arbeit ermöglichte.
Ich konnte mich mit ihm immer austauschen, und seine Unterstützung hat maßgeblich zum Erfolg dieser Arbeit beigetragen. Seine innovativen Ideen und sein biologischer Scharfblick bezüglich Erzeugung, Interpretation und Auswertung von Daten, inspirieren mich und motivieren mich zu forschen.
Professor Dr. Thomas Wiehe möchte ich ausserordentlich danken für die „spontane“
Übernahme des zweiten Gutachtens.
Vielen Dank an Professor Dr. Siegfried Roth für die Übernahme des Prüfungsvorsitzes.
Dr. Bettina Harr möchte ich danken für den Beisitz in meinem Prüfungskomitee und die große Hilfe bei der Datenauswertung. Sie stand mir immer zur Seite und hat mir den Einstieg in die Welt der Statistik erleichtert. Außerdem möchte ich ihr danken, dass sie mir so bereitwillig einen Platz in ihrem Labor und Office zur Verfügung gestellt hat.
Ich möchte mich bei allen Mitgliedern des Tautz Labors bedanken. Ihr habt Anteil daran, dass ich immer gerne zur Arbeit komme. Im besonderen möchte ich mich bei Till Bayer und Ruth Rottscheidt bedanken, weil sie gute Freunde von mir geworden sind. Außerdem für die Mus spretus Samples aus Spanien, die Hilfe bei diversen Labor-/Office-Tätigkeiten und das Korrekturlesen der Dissertation. Bei Arne Nolte, weil er sich immer Zeit für mich genommen hat bei Fragen und Diskussionsbedarf. Bei Birgit Schmitz für diverse Sequenziertätigkeiten und die Koordination der alltäglichen Mensagänge. Bei Sonja Ihle, die mich in die Geheimnisse des Mäusefangens eingeweiht hat, und die mir zusammen mit Susanne Kipp die Mus musculus musculus Samples aus Tschechien zur Verfügung gestellt hat.
Vielen Dank an meine Familie und im speziellen an meine Mutter und meinen Vater, die
Zusammenfassung
Regulatorische Änderungen in der Expression von Genen scheinen für evolutionäre Divergenz von großer Bedeutung zu sein. Es wird angenommen, dass ein großer Teil der Änderungen, die relevant für differentielle Adaption und Artentstehung sind, auf Änderungen in der Regulation von Genen beruht. Unterschiede in der Expression von Genen sind vererbbar und können somit selektiert werden.
Um genomweite evolutionäre Muster in der Divergenz zwischen Spezies bzw. Subspezies zu untersuchen, wurde die evolutionäre Veränderung der Genexpression von Mus musculus mit ihrem nächsten Verwandten Mus spretus verglichen sowie innerhalb der Subspezies von Mus musculus (Mus musculus domesticus, Mus musculus musculus, Mus musculus castaneus und Mus musculus ssp.). Zu diesem Zweck wurde RNA aus Individuen verschiedener Wildpopulationen und wild gefangener Laborpopulationen isoliert und Expressionsunterschiede im Gehirn, in Leber und Niere und im Testis mit Hilfe von Microarrays untersucht. Es wurden je sechs männliche Individuen von M. m. domesticus, M.
m. musculus und M. m. ssp., sowie drei männliche Individuen von M. m. castaneus und M.
spretus verglichen. Ein „common reference“ Design wurde benutzt, d.h. alle Samples wurden gegen cDNA eines Pools von Labormäusen (C57BL/6) hybridisiert. Durch die Verwendung mehrerer Tiere jeder Population war es möglich, intra- und inter-spezifische Varianzen getrennt zu betrachten, um dadurch Erkenntnisse über individuenspezifische bzw.
populationsweite Divergenzmuster zu erhalten. Genexpression fungierte hierbei als gemeinsamer Nenner, um die evolutionäre Divergenz zwischen den verschiedenen Organen zu vergleichen.
Eine statistische Analyse der signifikant differentiell exprimierten Gene zeigt, dass die Anzahl der Gene, deren Expression zwischen den Taxa verschieden, ist sowohl von der Divergenzzeit als auch vom Gewebe abhängig ist. Zwischen Subspezies findet man die meisten Unterschiede in der Leber und Niere und nahezu keine Unterschiede im Testis. Im Gegensatz dazu findet man im Speziesvergleich die meisten differentiell exprimierten Gene im Testis.
Hybridisierungen genomischer DNA von Mus spretus auf den Microarrays zeigten, dass
Unterschiede in der Hybridisierungseffizienz als Ursache für das beobachtete Muster
ausgeschlossen werden können. Um die phylogenetischen Verhältnisse zu untersuchen,
wurden die mitochondrialen D-loop Sequenzen miteinander verglichen. Die Analyse zeigt,
dass Mus spretus klar von den Mus musculus Subspezies separiert ist, und dass Mus musculus
ssp. keine phylogenetische Einheit bildet. Die funktionelle Annotation der differentiell exprimierten Gene zeigt, dass eine Vielzahl verschiedener Gene betroffen ist, und dass Transkriptionsfaktoren eine große Gruppe der differentiell exprimierten Gene in allen drei untersuchten Geweben bilden. Es ist möglich, anhand der Klassifizierung funktioneller Annotationen die Identität der Gewebe zu bestimmen. Mittels quantitativer Realtime PCR wurde die Expression ausgesuchter Gene verifiziert.
Neben der Untersuchung differentiell exprimierter Gene wurde eine genomweite Analyse evolutionärer Divergenzmuster durchgeführt. Eine Analyse der genomweiten Expressionsdivergenz („scaled divergence“) zeigt dasselbe Muster wie die Studie der differentiell exprimierten Gene: Divergenz zwischen Subspezies ist in der Leber und Niere am höchsten und zwischen Spezies im Testis. Weiterhin wurde eine mögliche Korrelation von Sequenz- und Expressionsevolution untersucht. Die Analyse zeigt, dass eine negative Korrelation zwischen Expressionsevolution und Sequenzevolution („dN/dS ratio“) der differentiell exprimierten Gene zwischen den Subspezies besteht. Im Speziesvergleich ist diese Korrelation positiv.
Die Beobachtung, dass insbesondere in Leber und Niere Expressionsunterschiede zwischen
Subspezies zu finden sind deutet darauf hin, dass ökologische und physiologische
Anpassungen eine große Rolle in frühen Divergenzstadien spielen. Spätere Divergenzstadien
hingegen scheinen mehr von nichtökologischen Faktoren beeinflusst zu werden. Die
Korrelationsanalyse von Expressions- und Sequenzevolution deutet auf positive Selektion der
Gene hin, die sich zwischen Subspezies unterscheiden. Ob die Divergenz der Genexpression
in späteren Stadien Ursache oder Wirkung von Speziation ist und ob sexuelle Selektion oder
genetische Drift diese Divergenz bewirkt, bleibt zum jetzigen Zeitpunkt offen. Weitere
Experimente sind notwendig, um diese Fragen zu beantworten.
Abstract
Regulatory changes in gene expression are thought to play an important role in evolutionary divergence. It has been suggested that a large proportion of the changes relevant to the process of differential adaptation and species formation can be attributed to changes in gene regulation. Moreover, differences in gene expression are heritable and thus provide a target for selection.
To infer genome-wide evolutionary patterns of species divergence, I studied the evolution of gene expression in a comparison of Mus musculus with its closest relative Mus spretus, and among subspecies of Mus musculus (Mus musculus domesticus, Mus musculus musculus, Mus musculus castaneus, Mus musculus ssp.). RNA of individuals from different wild populations and wild-derived populations at and below the species level were screened for expression differences in three tissues (brain, pooled liver/kidney, testis) with a microarray approach. Six male individuals from M. m. domesticus, M. m. musculus and M. m. ssp. and three male individuals from M. m. castaneus and M. spretus were compared. A common reference design was employed, and all samples were hybridized against labeled cDNA from laboratory mice (C57BL/6). Using multiple animals from each population allowed to differentiate between the fraction of variation stemming from within- and that stemming from between-terms of population differences. Gene expression measures served as a common currency to compare evolutionary divergence across different tissues.
A statistical analysis based on the identification of differentially expressed genes
shows that the number of genes that changed expression between taxa depends on divergence
time and the tissue under study. Across subspecies most expression changes are identified in
the liver/kidney and almost none in the testis, whereas across species the highest number of
differentially expressed genes is identified in the testis. Comparative Genomic Hybridizations
(CGHs) ruled out hybridization differences as a cause for the observed pattern. Mitochondrial
D-loop sequencing shows that Mus spretus is separated from the Mus musculus subspecies
and that Mus musculus ssp. is not resolved as a phylogenetic entity. Functional annotation
analysis of the differentially expressed genes shows that a wide variety of genes change
expression, that transcription factors are a major group in all three tissues, and that functional
classification categorization is able to reflect the tissues identity. Quantitative real-time PCR
was used to confirm chosen target loci.
In another approach, genome-wide patterns of evolution of gene expression were investigated. A study of the overall rates of divergence of gene expression shows the same tendency as the study based on gene counts: across subspecies, divergence is highest in the liver/kidney and across species, it is highest in the testis. In addition, it was tested whether a correlation between sequence divergence and gene expression divergence exists. Across subspecies there is a negative correlation between variation in gene expression and dN/dS ratios for genes that changed expression, whereas across species this correlation is positive.
The observation of divergent gene expression in metabolic organs among incipient
subspecies of the house mouse suggests a pervasive role of ecological and physiological
adaptations in the early stage of divergence while late divergence seems to be primarily
driven by non-ecological factors. The dN/dS analysis points to a role of positive selection for
the genes that changed expression between subspecies. Whether or not gene expression
divergence in later stages of divergence is a cause or a consequence of speciation and whether
sexual selection or genetic drift is the major driving force behind this divergence remains
open. Additional experiments are necessary to answer these questions.
1 Introduction
1.1 Microarrays as a tool to study evolution of gene expression
The study of molecular evolution began in the 1950s when it first became possible to compare the amino acid sequences of proteins among related species. With advances in DNA sequencing technologies, homologous genes and their regulatory regions could be analyzed between and within different taxa, respectively populations. The advent of microarray technology over the past few years makes it nowadays possible to study the evolution of genome-wide patterns of gene expression. Recent studies have used microarrays to compare patterns of expression between closely related species (Enard et al. 2002; Caceres et al. 2003;
Karaman et al. 2003; Meiklejohn et al. 2003; Ranz et al. 2003; Fortna et al. 2004; Khaitovich et al. 2004; Nuzhdin et al. 2004; Saetre et al. 2004). Those studies revealed a large diversity in the level, timing, and location of gene expression, interpreted partly as lineage-specific adaptations, although the precise nature of the evolutionary forces causing intra-specific and inter-specific transcriptome divergence are not yet fully understood. The current belief is that genome-wide expression studies will eventually help to understand the evolution of gene expression and to identify genes that are responsible for differential adaptation. The underlying opinion is that changes in time, level and location of gene expression are directly responsible for evolutionary changes and adaptational processes. This view has a long history and is based on the finding that rates of morphological evolution are poorly correlated with rates of protein evolution (Wilson et al. 1974). For this reason, it is assumed that most of the differences we see between taxa are of regulatory nature. All the more, it is remarkable how little we know concerning patterns, rates and mechanisms of change at the regulatory level, despite accumulating evidence that regulatory changes can have exceptional evolutionary consequences (Carroll 2001; Wilkins 2002). The perspective is that with the help of high- throughput technologies, such as microarrays, one can study the evolution of gene expression within and among species on a genome-wide scale. This should enable one to extend the view from a few genes and single pathways to a more generalized global understanding of the evolution and dynamics of gene expression.
Then again, a neutral model of transcriptome evolution is assumed (Khaitovich et al.
2004; Khaitovich et al. 2005) predicting that the majority of expression differences are neutral
and of no or little adaptive value. This model is based on the finding that expression differences between species accumulate approximately linearly with time. Lemos et al.
(Lemos et al. 2005) used the implications from a neutral model as a yardstick against which they measured patterns of gene expression polymorphism and divergence in several datasets.
Their results indicate that stabilizing selection is a major force regarding the evolution of gene expression and that stabilizing selection on transcription levels has prevented greater evolutionary changes in mRNA levels.
Overall, high levels of variation in gene expression patterns have been found on an intra- and inter-specific level and their interpretation is different depending on the specific model system used. Nevertheless, it seems clear that a substantial fraction of transcriptional variation is genetically hard-wired, either in cis or trans.
1.2 Intra-specific transcriptome variation
The study of gene expression variation in natural populations shows that there is significant intra-specific variation for a large number of genes assayed so far. In Drosophila, at least 10%
of the genes surveyed show significant variation among genotypes (Jin et al. 2001; Gibson et
al. 2004; Nuzhdin et al. 2004; Wayne et al. 2004). In the most extreme case in vertebrates as
much as 94% of the genes showed significant differences among individuals of the same
population of killifish Fundulus heterolitus when comparing gene expression in heart tissue
(Oleksiak et al. 2005). This lead to the conclusion that intra-specific variation in gene
expression is in general higher than the level of polymorphism observed for DNA or protein
sequences. This is mainly due to two reasons. First, while sequence data are direct, accurate
and complete, expression data are indirect and covers only a subset of all possible expression
states of a cell, making comparative analysis challenging. Secondly, due to the pleiotropic
nature of genes, change of expression of a gene involved in more than one pathway can affect
the expression of many different downstream genes that comprise altogether a large fraction
of the genome, as has been shown in artificial selection experiments in D. melanogaster
(Anholt et al. 2003; Mackay et al. 2005). Hence, there is no consensus or rule of how big the
expression ranging from 0.8% to 3.3% of the genes assayed, depending on the tissue tested.
All in all, regarding the amount of intra-specific transcriptome variation there is certainly a dependency on the taxa one looks at, environmental inputs, and the tissue under investigation.
1.3 Inter-specific transcriptome variation - tempo and mode of transcriptome evolution
Extending the comparison between individuals of one species to a comparison across species makes it possible to distinguish patterns of polymorphism from patterns of divergence and to assess the temporal dynamics of change of the transcriptome; and finally, allows conclusions about the interdependence between transcriptome evolution and the formation of new species.
The main limitation that comes with comparative studies between different taxa is that microarray platforms exist only for model organisms. Using microarrays that were designed for one species in a closely related (non-focal) species could bias the results of a study, i.e.
sequence divergence is the primary factor of hybridization differences and not differences in gene expression (Gilad et al. 2005). Different measures to account for this type of bias have been proposed as reviewed in Ranz et al. (Ranz and Machado 2006).
Of general interest is the question whether transcriptome divergence increases linearly with time, that is, if change of expression can be explained neutrally. Analyses of gene expression divergence among Drosophila species and between strains of Drosophila melanogaster during early metamorphosis showed that the magnitude of change was in accordance with what was expected from the phylogenetic relationships (Rifkin et al. 2003).
Further studies were conducted in which the this trend was also found. A comparison of the expression profile of the prefrontal cortex of human, Pan troglodytes, Pongo pygmaeus and Macaca mulatta (Khaitovich et al. 2004) showed an increase in the amount of change of gene expression with time.
If the majority of changes is selectively neutral, one might ask what is the amount of transcriptome divergence that is caused by natural selection. This question has been adressed using different approaches leading to inconsistent results across different taxa. The basic idea behind all these approaches is similar to the McDonald-Kreitman-test for coding sequences.
The amount of polymorphism (expression variation) within a species is compared to the
amount of divergence (expression divergence) between species. According to the model,
genes whose expression is under directional selection should show little intra-specific
variation but large inter-specific divergence, whereas genes under purifying selection are expected to show low levels of polymorphism and divergence. Genes under balancing selection show large intra-specific variation but low inter-specific divergence. One metric that was introduced is the scaled divergence metric (Lemos et al. 2005) that compares measures of within-species to between-species variances. Datasets that were analyzed with this model among studies of genes that changed during development in the D. melanogaster subgroup (Rifkin et al. 2003), on expression profiles in the brain among primates (Hsieh et al. 2003) and in C. elegans (Denver et al. 2005) all point to an omnipresent role of stabilizing selection on gene expression levels, and that only a minor fraction is positively selected, respectively changed adaptively. Other studies indicate that the transcriptome is evolving approximately neutral, i.e. differences accumulate linearly with time (Khaitovich et al. 2004). There is no common consensus yet. The percentages of genes evolving under selective forces strongly depend on the method used and the system analyzed.
Nevertheless, there is an emerging signal that shows up in studies using Drosophila.
Most transcriptome changes (83%) detected between D. melanogaster and D. simulans are found in genes with sex-biased expression (Ranz et al. 2003). Moreover, Meiklejohn et al.
(Meiklejohn et al. 2003) showed that male-biased genes are also over-represented among those genes that exhibit intra-specific changes in the level of expression by comparing eight strains of D. melanogaster. Together with the notion that coding sequences and morphological characters related to sex and reproduction evolve faster in comparison to other genetic characters, these findings support sexual selection theories as well as models of sexual conflict, driving traits in arbitrary directions (Arnqvist and Rowe 2005). Such signals of rapid evolution of the male reproductive system are also found among abalone (Swanson and Vacquier 1995), Drosophila (Civetta and Singh 1998), rodents (Good and Nachman 2005) and primates (Wyckoff et al. 2000). This would indicate, at least for genes with sex-biased expression, that positive selection drives divergence.
1.4 Transcriptome divergence and speciation
frequency changes are not shared. Differences that limit gene flow between the diverging populations therefore play an important role in speciation (Wu 2001).
Up to now only very few genes contributing to reproductive isolation have been isolated (so-called „speciation genes“) (Orr et al. 2004; Wu and Ting 2004). Microarrays offer an alternative to genetic screens in their potential to isolate genes that contribute to species differences. They assay a large amount of genes in the genome for differences in expression levels, and these differences can then be related to reproductive isolation. Three of the five known speciation genes are associated with transcriptional regulation, supporting the hypothesis that gene regulatory incompatibilities might be the cause of lower fitness in species hybrids, respectively that species differences are of regulatory nature (Barbash et al.
2003), as shown by two recent microarray studies in Drosophila (Michalak and Noor 2003;
Ranz et al. 2004). The first study, a study of expression dysfunction in sterile hybrid males of D. simulans/D. mauritiana identified loci related to spermatogenesis (Michalak and Noor 2003). The results provide support to the faster-male theory that is regarded as a cause of Haldane‘s rule (Coyne and Orr 2004). The rapid evolution of hybrid male sterility is caused by the faster divergence of male-specific fertility genes, either driven by sexual selection or by the inherent sensitivity of spermatogenesis to the genetic perturbations experienced by hybrids (Wu and Davis 1993). They then fail to correctly interact in a hybrid genome. Those loci are prime candidates for causing post-zygotic reproductive isolation. Concerning hybrid females, the second study in a more distant comparison between D. melanogaster and D.
simulans showed that 69% of the assayed genes were either under- or over-expressed in the hybrid females (Ranz et al. 2004).
Taken together, although distorted patterns of gene expression in hybrids do not necessarily have to be associated with fitness reduction, respectively reproductive isolation, microarrays have shown to be instrumental in identifying acquired regulatory, respectively expression differences between species that are of biological significance.
1.5 The genetic basis of gene expression differences
Although one can use microarrays to find genes that are differentially expressed within or between populations/species, information about the actual genetic background is missing.
Studies on the relative contributions of cis versus trans regulatory variation are contradictory.
Studies in yeast (Yvert et al. 2003), humans (Morley et al. 2004), flies (Wayne et al. 2004)
and worms (Denver et al. 2005) found an excess of trans-acting effects in gene expression across the genome. In other studies the opposite was found, i.e. a pre-dominant role of cis- acting factors, even when the same model organism was under study (Cowles et al. 2002; Yan et al. 2002; Schadt et al. 2003; Wittkopp et al. 2004). At least partly this was attributed to the different statistical methods and cutoffs that were used. This shows that one has to take care when drawing conclusions from such data, and that studies as these are particularly susceptible to biased results. Nevertheless, the studies agree that differences in expression are heritable, have a genetic background and can therefore be selected.
1.6 Model/study system – the Mus species complex
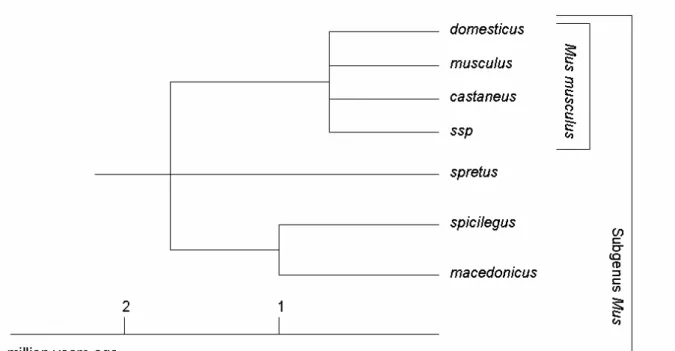
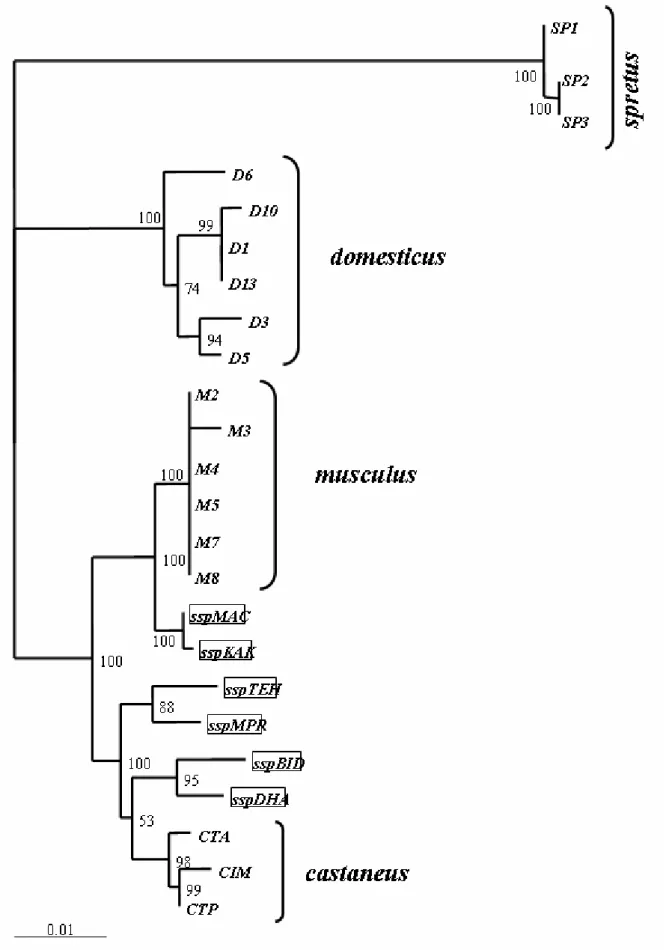
When looking at evolutionary patterns of gene expression, the house mouse provides an ideal study system for a number of reasons. The complete genome sequence of a laboratory strain of the house mouse is available (Waterston et al. 2002). Divergence can be compared across recently separated species as well as across subspecies, so that a fine-scale resolution is on hand when looking at evolutionary dynamics of expression divergence. The emergence of the genus Mus started about 5 million years ago (Guenet and Bonhomme 2003). The house mouse Mus musculus is separated from its closest relative Mus spretus by 1.1 to 1.5 million years (Boursot et al. 1993), whereas the different Mus musculus subspecies diverged from each other 0.5 to 0.8 million years ago (Guenet and Bonhomme 2003) (Figure 1).
Mus spretus, known as the Algerian mouse, is found in regions spanning the western
Mediterranean Sea. Although sympatric with some Mus musculus subspecies, hybrids have
been rarely observed. Mus musculus has its evolutionary origin in Asia and has now spread
across the world. At least 3 different house mouse subspecies exist that occupy different
geographical areas, with a western (Mus musculus domesticus), a central (Mus musculus
musculus) and an eastern house mouse (Mus musculus castaneus). The western house mouse
M. m. domesticus is common in Western Europe and was brought by humans to Africa,
America and Australia. The habitat of the central house mouse M. m. musculus spans from
Eastern Europe to Japan, across Russia and northern China. The eastern house mouse M. m.
(Forejt 1996; Storchova et al. 2004). The fourth, less well-characterized subspecies (Mus musculus ssp.) occurs in the centre of the assumed origin of the house mouse (throughout North-West India, Iran and Pakistan).
The close relationship among house mice is beneficial because the identified genetic changes are less likely a consequence rather than a cause of divergence, i.e. the various Mus musculus taxa are actively adapting to different environments. M. m. musculus and M. m.
domesticus are the best-studied subspecies and can be distinguished morphologically. They differ in relative tail length (longer in M. m. domesticus) as well as craniofacial shape (longer and narrower in M. m. domesticus (Macholan 1996)).
Figure 1: Section of the evolutionary tree of the genus Mus. The last node represents the Mus musculus
subspecies complex (adapted from (Guenet and Bonhomme 2003)).
1.7 Project description
To investigate divergence among recently separated species I studied the evolution of gene expression in a comparison of Mus musculus with its closest relative Mus spretus, and among the subspecies of Mus musculus (Mus musculus domesticus, Mus musculus musculus, Mus musculus castaneus, Mus musculus ssp.). RNA from individuals from different wild populations and wild-derived populations at and below the species level were screened for expression differences in different tissues (brain, pooled liver/kidney, testis) with a microarray approach. Six male individuals from M. m. domesticus, M. m. musculus and M. m.
ssp. and three individuals from M. m. castaneus and M. spretus were used. A common reference design was employed, and all samples were hybridized against labeled cDNA from laboratory mice (C57BL/6).
Gene expression measures served as a common currency to compare evolutionary divergence across different tissues. Differences in reproductive organs such as testis are thought to reflect processes relating to sexual selection, whereas differences in liver/kidney may reflect ecological and physiological adaptations. Expression differences in the brain may imply information regarding evolution of behavirol traits, respectively cognitive perception. A study of gene expression should be particularly germane because it is thought that changes in gene expression play a critical role in divergence. Using multiple animals from each population allows to differentiate between the fraction of variation stemming from within- and that stemming from between-terms of population differences.
The main interest was to find out how many genes contribute to species, respectively
subspecies differences in expression profiles, if there is a difference in the number of genes
differentially expressed when analyzing different tissues/phylogenetic distances, and the
identity of the differentially expressed genes and which biological processes are affected,
respectively targeted. The other point of interest was in finding genome-wide patterns of
evolution of gene expression. For this purpose, overall rates of divergence of gene expression
across subspecies and across species for the tissues under study were compared. Furthermore,
2 Material & Methods
2.1 Animals
Unrelated male mice were collected from the wild in the Czech Republic (M. m. musculus) and Germany (M. m. domesticus). Mice are known to live in small family groups with home ranges rarely exceeding a radius of 2 km. For strictly indoor living mice, home ranges can even be restricted to a few square meters (Berry and Bronson 1992; Pocock et al. 2005). In order to have a representative sample of mouse populations within a given area and to avoid the influence of specific family effects, individuals unrelated to each other from different demes were sampled. Mouse populations were sampled according to the following scheme:
trapped mice were assigned to different locations only if the trapping sites were at least 0.5 km apart from each other. Mouse traps were set up in private houses, barns or stables, or in fields in the case of Mus spretus. Animals were captured in live traps and transferred to the lab, where they were kept individually under common laboratory conditions for 3 to 5 days.
Six males of similar age (judged based on their body weight and size) of both subspecies were selected for further experiments. Six male individuals of the central subspecies M. m. ssp. and three male individuals of the subspecies M. m. castaneus, with similar age and body weight as individuals collected in the wild, were selected. M. m. ssp. and M. m. castaneus had been kept between 2 and 10 generations in the Laboratoire Génome Populations Interactions Adaptation in Montpellier under standard conditions.
Three male mice of the species Mus spretus were also included in the analysis. These were F1 offspring derived from three pairs of wild-caught, unrelated mice collected in Spain near Madrid in August 2004.
The reference strain C57BL/6 was obtained from the Charles River Laboratories, Germany. All animals were sacrificed using CO 2. Tissues were excised and immediately snap frozen in liquid nitrogen. Frozen tissues were stored at –80°C for not longer than one week.
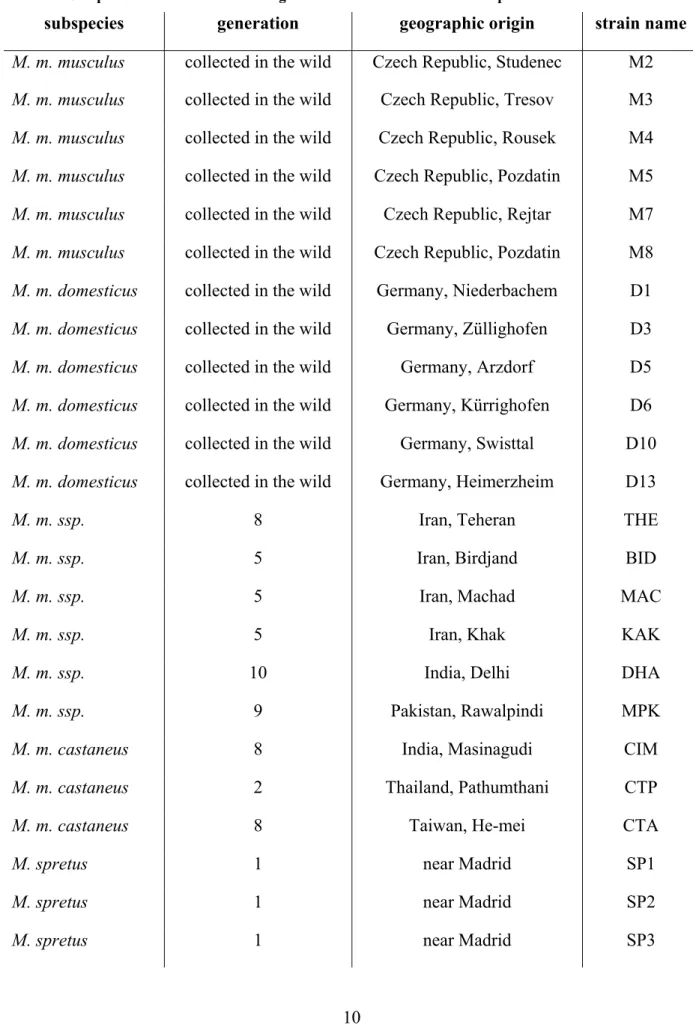
Exact geographic origins of the animals used are given in Table 1.
Table 1: Sample locations and number of generations mouse strains were kept in the lab.
subspecies generation geographic origin strain name M. m. musculus collected in the wild Czech Republic, Studenec M2
M. m. musculus collected in the wild Czech Republic, Tresov M3 M. m. musculus collected in the wild Czech Republic, Rousek M4 M. m. musculus collected in the wild Czech Republic, Pozdatin M5 M. m. musculus collected in the wild Czech Republic, Rejtar M7 M. m. musculus collected in the wild Czech Republic, Pozdatin M8 M. m. domesticus collected in the wild Germany, Niederbachem D1 M. m. domesticus collected in the wild Germany, Züllighofen D3 M. m. domesticus collected in the wild Germany, Arzdorf D5 M. m. domesticus collected in the wild Germany, Kürrighofen D6
M. m. domesticus collected in the wild Germany, Swisttal D10 M. m. domesticus collected in the wild Germany, Heimerzheim D13
M. m. ssp. 8 Iran, Teheran THE
M. m. ssp. 5 Iran, Birdjand BID
M. m. ssp. 5 Iran, Machad MAC
M. m. ssp. 5 Iran, Khak KAK
M. m. ssp. 10 India, Delhi DHA
M. m. ssp. 9 Pakistan, Rawalpindi MPK
M. m. castaneus 8 India, Masinagudi CIM
M. m. castaneus 2 Thailand, Pathumthani CTP
M. m. castaneus 8 Taiwan, He-mei CTA
M. spretus 1 near Madrid SP1
2.2 Microarrays
The mouse oligolibrary by Sigma-Genosys/Compugen (Haverhill, UK) was duplicate-spotted on Schott/Nexterion Slides H using a Biorobotics MicroGrid II Spotter (Genomic Solutions, Cambridgeshire, UK). The library consists of 21,997 5´-C6 amino modified 65mers with 21,766 unique transcripts and 231 controls. The oligos represent all of the mouse genes associated with public mRNA sequences found in GenBank release 126 (October 2001). Each array consists of 46,128 spots, representing the oligolibrary in duplicate, plus external controls and reference spots.
2.3 Sample preparation
Tissue samples were homogenized in TRIzol (Invitrogen, Carlsbad, CA) using an electric homogenizer. RNA was extracted following the manufacturer’s protocol. After resuspension of the RNA in DEPC-H 2 O, the RNA was precipitated in 4 M LiCl for storage at -80°C.
20 µg of each total RNA was reverse transcribed using the FairPlay Microarray Labeling Kit (Stratagene, La Jolla CA) and labeled by incorporation of Alexa Fluor 555 and Alexa Fluor 647 (Molecular Probes, Eugene, OR), respectively, according to the manufacturer’s protocols. Half of the labeled cDNA was used for hybridization.
2.4 Hybridization
The two labeled cDNA samples to be compared were combined in 65 µl of 5x SSC and
competitively hybridized on a microarray under a coverslip (Implen LifterSlip 24x60l) for 16
hours at 42°C in an Advalytix SlideBooster. Slides were washed in graded SSC/SDS and spun
dry.
2.5 Data Acquistion
Arrays were scanned with a GeneTAC LS IV (Genomic Solutions, Cambridgeshire, UK) confocal laser scanner. Scanner settings were adjusted individually for every channel and microarray. Images were analyzed using the software Spotfinder from the TIGR institute (Saeed et al. 2003), and the extracted intensities were stored as tab-delimited .mev files. The arrays were normalized using block-wise LOWESS and SD regularization (Yang et al. 2002) as described in (Saeed et al. 2003).
2.6 Experimental design
Microarray analysis was performed on three different tissue samples. For each individual, labeled cDNA from total RNA of the whole brain and testis tissues was individually hybridized to the chip, whereas RNA from liver and kidney was pooled in equivalent amounts and hybridized jointly. A common reference design was employed with experimental samples labeled with Alexa Fluor 647 and the reference sample labeled with Alexa Fluor 555. To obtain enough reference RNA for each of the tissues, RNA was extracted from nine animals of the reference inbreed strain C57BL/6 and pooled tissuewise. Thus, for each tissue the exact same reference RNA was used for all hybridizations. The experimental samples were hybridized together with the reference sample. Since I used a common reference design and all experimental samples are labeled with the same dye, differences in the amount of label per amount of cDNA (i.e. “dye bias”) do not affect the results.
Altogether 72 hybridizations were performed, i.e. six individuals times three tissue samples (brain, liver/kidney, testis) for each of the subspecies M. m. musculus, M. m.
domesticus and M. m. ssp. and three tissue samples for each of the M. m. castaneus
individuals CTP and CIM and CTA. For M. spretus, nine hybridizations were performed: three
tissue samples (brain, testis and liver/kidney) for each of the three individuals.
2.7 Genomic DNA hybridizations
To correct for possible differences in hybridization efficiencies of individual oligos because of sequence divergence between Mus musculus and Mus spretus I performed Comparative Genomic Hybridizations (CGHs) for all 3 Mus spretus samples using DNA from C57BL/6 as the reference. For each Mus spretus animal, 1.5 µg of genomic DNA was labeled using the BioPrime Plus Array CGH Indirect Genomic Labeling Systems (Invitrogen) according to the manufacturer’s instructions. The C57BL/6 reference was labeled three times independently each time using 1.5 µg of genomic DNA. Labeled genomic DNA of both species were combined in equal amounts and hybridized competitively to a microarray under a coverslip (Implen LifterSlip 24x60l) for 16 hours at 52°C in an Advalytix SlideBooster. As before, slides were washed in graded SSC/SDS and spun dry. The arrays were normalized using block-wise LOWESS and SD regularization (Yang et al. 2002) as described in (Saeed et al.
2003). All oligos are located within the 3’UTR of the respective genes so that they are expected to bind equally well to genomic DNA and cDNA.
2.8 Data processing and statistical analyses
For the cDNA hybridizations I calculated the log2-transformed ratio of the normalized signal intensity of the “sample” channel relative to the “reference” channel for each gene. Log2- ratios for the duplicate spots were averaged. These values were submitted to the Gene Expression Omnibus (GSE2597) and were used for all subsequent analyses.
2.9 Identification of differentially expressed genes with SAM (Significance Analysis of Microarrays)
I used the SAM (Significance Analysis of Microarrays) software (Tusher et al. 2001) in a 2-
class unpaired comparison to identify genes differentially expressed between Mus spretus and
all Mus musculus subspecies. This analysis was performed for each tissue independently. In
SAM, the relative difference (d(i)) in gene expression is compared to the distribution of d(i) following random permutation of the sample categories (here: 200 permutations). For each d(i), a certain proportion of all genes in the permutation set (control set) will be found to be
“significant” by chance and this parameter is then used to calculate a False Discovery Rate (FDR). Only genes with a False Discovery Rate < 5% were selected as differentially expressed in this “between species” comparison. The FDR emphasizes the proportion of errors among the identified differentially expressed genes, i.e. the percentage of genes falsely assigned significant.
To identify the genes that are differentially expressed among subspecies I used the multiclass analysis in SAM with 200 permutations and a False Discovery Rate < 5%. Genes identified by the multiclass analysis are those where all house mouse subspecies differ significantly from each other as well as genes where combinations of two subspecies differ from each other as well as genes that are differentially expressed only in one subspecies lineage relative to all other lineages (so called “lineage-specific” genes).
2.10 Identification of lineage-specific genes of subspecies of Mus musculus
To isolate genes that are subspecies-specifically expressed, i.e. genes that are different in one subspecies in comparison to all other subspecies, a series of 2-class unpaired comparisons in SAM (200 permutations, FDR < 5%) was performed using all possible pairwise comparisons of the four subspecies (M. m. domesticus vs. M. m. musculus, M. m. domesticus vs. M. m.
castaneus, M. m. domesticus vs. M. m. ssp., M. m. musculus vs. M. m. castaneus, M. m.
musculus vs. M. m. ssp. and M. m. castaneus vs. M. m. ssp. for all three tissues). Among the genes that were identified in the 2-class comparisons, only those genes were selected, where one subspecies differed significantly from all others but these did not differ significantly from each other. This procedure was done for all subspecies.
2.11 Mitochondrial D-loop sequencing
96 well plates (Millipore, Hertfordshire, UK) according to the supplier’s protocol. All PCR products were sequenced in both directions using the BigDye sequencing chemistry on an ABI3700 automated sequencer. Sequencing reactions were purified using Sephadex columns (Millipore, Hertfordshire, UK). Sequences have been submitted to GenBank with the accession numbers DQ266049-DQ266072.
2.12 Confirmation of differentially expressed genes from the SAM analyses with quantitative real-time PCR (qRT-PCR)
The qRT-PCRs were performed with RNA from the same individuals that were used in the microarray study. Genes that were identified as signficantly differentially expressed in the SAM analyses were chosen for confirmation (see 6.1, 6.2). Prior to qRT-PCR, RNA was reverse transcribed using random hexamers (Fermentas) and the ThermoScript Reverse Transcriptase Kit (Invitrogen, Carlsbad, CA) according to the manufacturer’s protocol. All genes were verified using the TaqMan Gene Expression Assays from Applied Biosystems (Foster City, CA) and reactions were performed using 2 ul of a 1:10 diluted cDNA in a reaction volume of 8 ul. Briefly, 4 ul of TaqMan Universal PCR Master Mix, 0.4 ul of TaqMan Gene Expression Assay, 1.6 ul H 2 O and 2 ul diluted cDNA were used per reaction.
For each individual, a single cDNA synthesis per tissue was performed which was used in all qRT-PCR reactions. The reactions were done in triplicate per gene and individual. Averaged C T values of each qRT-PCR reaction from the target gene were standardized in relation to the averaged C T of a house-keeping gene that ran in the same reaction plate. Two different house- keeping genes were used. Tbp, TATA box binding protein, Assay ID Mm00446973_m1 was used to normalize expression levels in the brain and liver/kidney. Gapdh, glyceraldehyd-3- phosphate dehydrogenase, Assay ID Mm99999915_g1 was used to normalize expression levels for the genes that were found to be differentially expressed in the testis. These house- keeping genes showed a similar expression height in all species/subspecies and had the lowest standard deviation across individuals for the corresponding tissues (data not shown).
Genes that were picked for confirmation had the following GenBank accession
numbers and assay IDs: AK003742: Mm01217369_m1, AK015921: Mm01282622_m1,
AK014677: Mm01217598_g1, Z48496: Mm02017439_g1, BC007147: Mm00453021_m1,
NM_008917: Mm01192227_m1, NM_009529: Mm00784689_s1, NM_011560:
Mm00843984_s1, AK004920: Mm01168596_m1, NM_009638: Mm00731639_m1, AF351196: Mm01174266_m1, U94828: Mm00450997_m1, NM_009138: Mm00436443_m1 and NM_008701: Mm00435145_m1.
For each qRT-PCR reaction the (averaged) C T value of the house-keeping gene was subtracted from the (averaged) C T value of the target gene, yielding the ΔC T value. In the case of confirmation of differentially expressed genes between Mus spretus and Mus musculus, these ΔC T values were then used in a Mann-Whitney-U test analogous to the 2-class unpaired test in the SAM analysis to confirm results from the microarray study, thereby contrasting all Mus musculus subspecies to Mus spretus. The following formula was used to calculate the fold-change between Mus spretus in relation to Mus musculus from the ΔCT values:
fold-change = 2
−(ΔCT_Mus_spretus−ΔCT_Mus_musculus),
where
ΔCT_Mus_spretusis the average ΔC T value across the Mus spretus individuals and
musculus Mus CT_ _
Δ
is the average ΔC T value across all Mus musculus subspecies (averaged first across individuals within subspecies and then across subspecies).
In the case of confirmation for differentially expressed genes across subspecies, ΔC T
values were used in a Kruskal-Wallis-test that differentiated between all four subspecies analogous to the multiclass analysis in SAM. Since no lineage-specific genes were tested, I abstained from calculating all possible combinations of fold-changes and concentrated on the confirmation of differential expression between subspecies.
2.13 Identification of functional categories within lists of differentially expressed genes with DAVID (Database for Annotation, Visualization and Integrated Discovery)
The DAVID Functional Classification tool (Dennis et al. 2003), available at
http://david.abcc.ncifcrf.gov/, was used to annotate the genes that were called signficantly
differentially expressed from the SAM analyses. The functional classification tool helps to
functional annotation sources. It is a program to identify co-occurrences of functional annotations. In that aspect it is different from tools that use a single classification system, such as GO ontologies. A clustering algorithm classifies highly related genes into functionally related groups. During the course of the analysis, I concentrated on the listing of the
“consensus terms” shared by the genes in the corresponding cluster. This tool was used to get an overview over putatively underlying biological processes that are contained in the candidate gene lists from the SAM analyses. All settings were used as the default given, except for the liver/kidney analyses. Here, the classification stringency “highest” was chosen.
2.14 Identification of biological processes within lists of differentially expressed genes with PANTHER (Protein ANalysis THrough Evolutionary Relationships)
The gene lists for the between species and the between subspecies analysis obtained from SAM were submitted to PANTHER (http://www.pantherdb.org). PANTHER identifies over- represented functional categories among the significant genes (Mi et al. 2005). Significance is based upon comparing the gene list with a reference list (here: the full gene content that was represented on the microarray) by means of a binomial test (Cho and Campbell 2000). For the analysis, the “Biological Process PANTHER ontology” was chosen and only those genes with a p-value of less than 0.05 in the category of significantly over-represented genes were analyzed.
2.15 Scaled divergence analysis
The scaled divergence metric is basically a measure of the rate of gene expression divergence in that it compares the between species to the within species components of the variance, as determined from the meansquares (MS) from an ANOVA (Lemos et al. 2005). The scaled divergence is defined as
w b
v t = v
Δ ,
where t is the total number of generations separating the 2 lineages, v b is the between-species component of variance and v w is the within-species component of variance. Note that:
n
0MS v
b= MS
b−
w,
where MS b and MS w are the between-population and within-population meansquares from an ANOVA, and n 0 is the average sample size. Therefore, the between-population component of variance is already corrected for the within-population component, since MS w is subtracted from MS b .
Two different group assignments were used that reflect the two different levels of divergence. The first grouping assorted all individuals from all musculus subspecies into one group and all spretus individuals into a second group, yielding an ANOVA model with only two levels. The second grouping comprised only the subspecies of house mouse in a 4 level One-Way ANOVA. Statistical analyses were performed using the statistical language R and scripts written in Perl.
2.16 dN/dS analysis
To obtain dN/dS ratios from mouse-rat alignments for all the genes on the array, the BioMart
data mining tool was used at http://www.ensembl.org/ (Hubbard et al. 2005). The BioMart
tool was used to query assembly NCBI m34 of May 2005, Ensembl Genebuild of March
2005, database version 36.34d. For this reason, the GenBank accession numbers were
converted to UniGene identifiers. For the analysis, 7724 genes could be mapped to a UniGene
identifier with a corresponding dN/dS ratio from the mouse-rat alignment (see 6.4). Variation
in gene expression was calculated as standard deviations from log2-ratios. Standard
deviations for the across subspecies divergence were first calculated subspecies-wise and after
that averaged over subspecies.
3 Results
3.1 Differentially expressed genes between species and subspecies of Mus
High-density two-color oligonucleotide (65mers) microarrays designed from Mus musculus were used to study gene expression differences in animals caught from wild populations and from wild-derived animals that were kept under outbreeding conditions for several generations. Using multiple animals from each population allowed to differentiate between within-population and between-population variation. The whole genome expression profile between different subspecies of Mus musculus as well as between all Mus musculus subspecies and Mus spretus was compared. Hence, two levels of analysis were chosen, i.e. the differentiation across subspecies, and the differentiation across species.
3.1.1 Genomic DNA hybridizations (CGHs)
A potential problem with using microarrays that were designed for one species in another closely related (non-focal) species is that divergence in the sequences, that are represented as oligos on the array, could confound the measurements of gene expression in the non-focal species (Gilad et al. 2005). This phenomenon is likely to be more severe, the more distantly related the non-focal species is, relative to the species for which the microarray has been designed. Moreover, genes expressed in the testis may evolve more rapidly than genes expressed in other tissues (Swanson and Vacquier 2002; Good and Nachman 2005). This means that a higher than average rate of divergence at identified genes could result in lower hybridization efficiencies for Mus spretus. However, Mus musculus and Mus spretus are very closely related and show only 1-2% sequence divergence (She et al. 1990; Galtier et al. 2004).
Since the microarrays consist of relatively long oligos (65mers), one would expect only marginal effects of sequence divergence on hybridization efficiency in Mus spretus.
Nevertheless, to rule out any difference in hybridization intensity I performed hybridizations of genomic DNA from Mus spretus against the genomic DNA of a Mus musculus reference.
Different hybridization characteristics at some oligos between both species would be
manifested as being outliers in an RI plot (Ratio-to-Intensity), respectively in a low
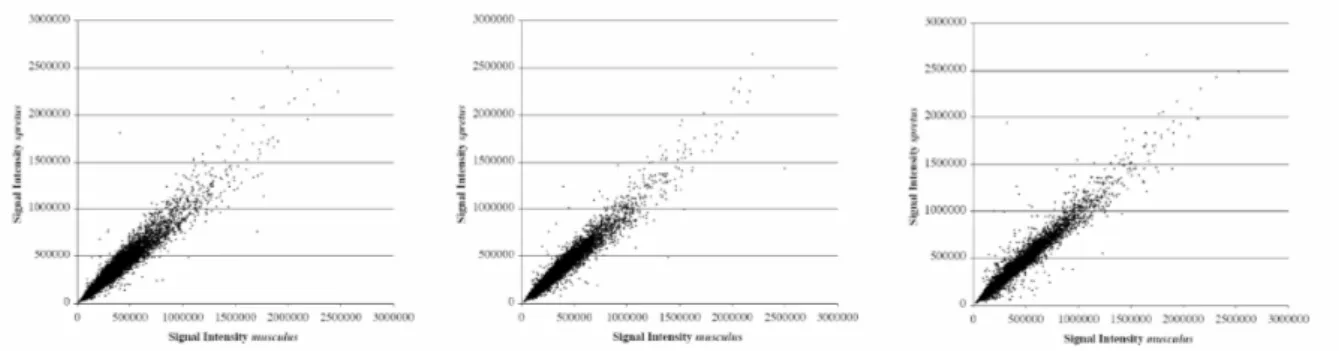
correlation of signal intensities from Mus musculus and Mus spretus. As shown in Figure 2, for the three individuals of Mus spretus, hybridized against a common Mus musculus reference, there is no systematic pattern of higher intensities in one of the species. A few outliers are present in both species but these are unlikely to affect the genome-wide trend. For all three Mus spretus individuals used in the study, correlation coefficients with Mus musculus range from 0.97 – 0.98 (Figure 3).
log
10(I(A) x I(B)) log
10(I(A) x I(B)) log
10(I(A) x I(B))
log
2I(B)/I(A)
Figure 2: RI (Ratio-to-Intensity) plot from hybridizations of genomic DNA from Mus musculus and Mus spretus on the same slide. Each panel shows one of the three Mus spretus individuals used in the study (SP1, SP2, SP3 from left to right).
Figure 3: Scatter plot of signal intensities obtained from genomic DNA hybridizations in the Mus
musculus sample (x-axis) and the Mus spretus sample (y-axis) on the same slide. Each panel shows one of
the three Mus spretus individuals used in the study (SP1, SP2, SP3 from left to right).
3.1.2 SAM (Significance Analysis of Microarrays) analysis – number of differentially expressed genes between species/subspecies for the different tissues
Having ruled out major biases stemming from differences in hybridization efficiencies between taxa of Mus, the program “Significance Analysis of Microarrays” (SAM, (Tusher et al. 2001)) was used to identify and count the number of differentially expressed genes in each tissue for both levels of divergence, between subspecies of Mus musculus and between all subspecies and Mus spretus. The SAM algorithm is a non-parametric t-test variant that does not have strong parametric assumptions, and does not involve any complex estimation procedures. For all analyses, 200 permutations and a False Discovery Rate (FDR) of < 5%
were chosen. The FDR controls the expected proportion of false positives among a set of predictions. A FDR threshold is determined from the observed p-value distribution, and hence is adaptive to the amount of signal in the data. Between 3 to 6 unrelated individuals from each of the species/subspecies represented the individual replicates in the SAM analyses (see 2.1).
3.1.2.1 Gene expression differences between Mus musculus and Mus spretus
To estimate the number of differentially expressed genes between all Mus musculus
subspecies and Mus spretus, a 2-class unpaired comparison was performed. All individuals
from all Mus musculus subspecies were compared to all Mus spretus individuals for all three
tissues (brain, pooled liver/kidney, testis). SAM identified 222 genes differentially expressed
in the brain, 1373 that are differentially expressed in the liver/kidney comparison, and 1688
genes were identified that show significant differences in expression in the testis. Thus, the
highest number of differentially expressed genes between species is found in the testis,
followed by liver/kidney and the least number of genes significantly differentially expressed
is found in the brain (Table 2). Overall, 3283 genes were found to be differentially expressed
between Mus musculus and Mus spretus. A list of all differentially expressed genes is given in
Appendix 6.1.
Table 2: Differentiation across species/subspecies. Given are the number of genes differentially expressed as determined from the SAM analyses (200 permutations, FDR < 5%).
brain liver/kidney testis
across species 222 1373 1688
across subspecies 281 1244 23
3.1.2.2 Gene expression differences between subspecies of Mus musculus
To test for differentially expressed genes within subspecies of Mus musculus, all subspecies were compared in a SAM multiclass analysis. Genes identified in a multiclass analysis are those where all subspecies differ significantly from each other as well as combinations of two subspecies or a single subspecies against all remaining subspecies (“lineage-specific” genes).
When comparing across Mus musculus subspecies, 281 genes are identified as being differentially expressed across subspecies in the brain, 1244 genes are found for the liver/kidney comparison and the least number of genes is found in the testis. Only 23 genes are captured for a given FDR < 5% in the SAM analysis (Table 2). In total, the SAM multiclass analysis identified 1548 genes that are differentially expressed across subspecies. A list of all genes identified as differentially expressed is given in Appendix 6.2.
3.1.2.3 Comparison of gene expression differences between species and subspecies of Mus
Looking at the number of differentially expressed genes in the brain and liver/kidney analyses, the amount of genes across species and subspecies is quite similar. In contrary, the difference in the number of genes for the testis is striking (Table 2).
The low number of genes identified in the brain in both analyses, in comparison to
differ more from other human brain samples than from chimpanzee samples. Based on the same dataset, Hsieh et al. (Hsieh et al. 2003) showed that more differences at high significance levels were observed for liver than for brain between species. Furthermore, it has been shown that expression of genes in the brain is associated with life history (Aubin-Horth et al. 2005) and that expression of certain genes is associated with learning and memory (Atkins et al. 1998; de Ortiz et al. 2003; Mons et al. 2003). All these results point to a high level of intra-specific variation in gene expression in the brain. A more detailed analysis regarding expression variance is given in the scaled divergence analysis (3.5.1), when genome-wide patterns of divergence are examined.
The comparatively high number of genes found to be significantly differentially expressed in liver/kidney in both analyses could be explained by the function these tissues have. They are the interface between ecology and physiology. The function of these organs (among others) is food utilization, metabolism and detoxification. Since all species are exposed to different environments we may expect gene expression levels that are adjusted towards the different conditions these taxa are exposed to.
Regarding the genes found to be differentially expressed in the testis, it is a general finding that genes related to the male reproductive system evolve fast when comparing species (Swanson and Vacquier 1995; Civetta and Singh 1998; Wyckoff et al. 2000; Good and Nachman 2005). This is true regarding the evolution of coding sequence as well as the evolution of gene expression. Hence, one would expect to identify a high number of genes to be differentially expressed in testis tissues between species. In contrary, the same is not true when comparing subspecies, i.e. taxa at lower stages of divergence.
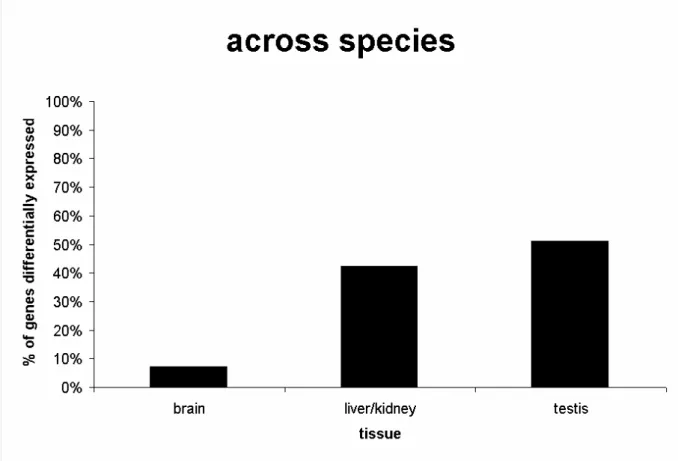
Apart from the fact that the numbers of genes found to be differentially expressed in brain and liver/kidney are quite similar in both analyses, comparing the portion of these genes to all genes that are differentially expressed gives a different picture. About 15% of all genes represented on the microarray were differentially expressed between Mus spretus and Mus musculus (a total of 3283 genes). Among these 3283 genes approximately half were identified in the testis (~51%, 1688 genes), 42% (1373 genes) in the liver/kidney and 7% (222 genes) in the brain (Figure 4). In contrast, for the subspecies comparison about 7% of all genes (1548 genes) were identified as differentially expressed, which is about half of the genes identified in the across species comparison. Of these genes, 1.5% (23 genes) are found in the testis, 80%
(1244 genes) are from genes found to be differentially expressed in the liver/kidney and
18.5% (281 genes) differ in expression in the brain (Figure 5). Hence, in the comparison of all
tissues in the across species analysis the testis is dominating, whereas in the across subspecies analysis genes differentially expressed in liver/kidney are preponderant.
Taken together, a highly significant difference in the distribution of the number of genes across tissues is found when comparing the species and subspecies level ( χ
22