The role of FoxO1 in neurodegenerative diseases
I n a u g u r a l - D i s s e r t a t i o n zur
Erlangung des Doktorgrades
der Mathematisch-Naturwissenschaftlichen Fakultät der Universität zu Köln
vorgelegt von Lorna Moll
aus Frechen Köln 2012
Berichterstatter:
Prof. Dr. Jens C. Brüning Prof. Dr. Wilhelm Krone
Tag der letzten mündlichen Prüfung: 31.01.2012
1.1.1. Insulin- and Insulin-like growth factor-1 receptors 2
1.1.2. Insulin receptor substrates 4
1.1.3. Phosphatidylinositide(PI)3 kinase signaling 6
1.1.4. Forkhead box O transcription factors 8
1.1.4.1. Regulation of FoxO mediated transcription 10
1.1.5. Function of FoxOs 11
1.1.5. MAPK signaling 12
1.2. Alzheimer’s disease 12
1.2.1. Pathology of Alzheimer´s disease 13
1.2.2. Hyperphosphorylation of tau 13
1.2.3. Generation of amyloid-β 14
1.2.4. Degradation and clearance of amyloid-β 16
1.2.5. Genetic risk factors of Alzheimer´s disease 16 1.2.6. IR/IGF-1R signaling in Alzheimer’s disease 17
1.2.7. FoxO action in Alzheimer’s disease 18
1.3. Mouse models 19
1.3.1. Constitutive active and dominant negative forms of FoxO1 20 1.3.2. Synapsin 1 promoter driven expression of the Cre recombinase 21
1.3.3. Tg2576, a model for Alzheimer´s disease 22
1.4. Aims of the present thesis 22
2. Material and Methodes 23
2.1. Chemicals 24
2.2. Enzymes 25
2.3. Vectors, Primer and supplies 26
2.4. Buffer and solution 26
2.5. Cells and bacteria 28
2.6. Kits 28
2.7. Primary Antibodies 28
2.8. Secondary Antibodies 31
2.9. Material 31
2.10. Methods 33
2.10.1. Mice breeding 33
2.10.2. Isolation of genomic DNA 33
2.10.3. Polymerase chain reaction (PCR) for genotyping 33
2.10.6. Brain lysates 36
2.10.7. SDS-PAGE 36
2.10.8. Western Blot 37
2.10.9. Urea Tricine gel 38
2.10.10. Dot Blot 39
2.10.11. ELISA β-Amyloid40/42 39
2.10.12. Statistical analysis 39
2.10.13. Histology 40
2.10.14. RNA Isolation 40
2.10.15. cDNA synthesis 41
2.10.16. realTime PCR 41
2.10.17. Behavioral studies and caloriemetry 42
2.10.18 False-coloure imaging 43
2.10.19. Cloning strategy 43
2.10.20. Generation of stably expressing cells 45
2.10.21. Cell lysates 46
2.10.22. Stimulation of cells with Insulin or IGF-1 46
2.10.23. Proliferation assay 47
2.10.24. Apoptosis in cells 47
3. Results 48
3.1. Verification of FoxO1DN expression in mice 51
3.2. Characterisation of FoxO1DN mice 52
3.2.1. Glucose homeostasis of FoxO1DN mice 52
3.2.2. Analysis of IR/IGF-1R signaling in 28 weeks old FoxO1DN mice 54
3.2.3. Growth of FoxO1DN mice 55
3.2.4. Indirect calorimetric analysis of FoxO1DN mice 59
3.2.5. Behaviour of FoxO1DN mice 62
3.3. Role of FoxO1 in Alzheimer´s disease 63
3.3.1. Glucose homeostasis of Tg2576/FoxO1DN mice 63
3.3.2. Body weight of Tg2576/FoxO1DN mice 66
3.3.3. Kaplan-Meier analysis of FoxO1DN mice in Tg2576 background 67
3.3.4. IR/IGF-1R signaling in Tg2576/FoxO1DN mice 68
3.3.5. APP Processing in Tg2576/FoxO1DN mice 70
3.4. Verification of FoxO1ADA expressing mice 72
3.5.2. Analysis of IR/IGF-1R signaling in 28 weeks old FoxO1ADA mice 75
3.5.3. Growth of FoxO1ADA mice 76
3.5.4. Indirect calorimetric analysis of FoxO1ADA mice 81
3.5. Behaviour of FoxO1ADA mice 84
3.6. Role of FoxO1 in Alzheimer´s disease 86
3.6.1. Glucose homestasis of Tg2576/FoxO1ADA mice 86
3.7. Growth of Tg2576/FoxO1ADA mice 88
3.8. Survival of FoxO1ADA mice 90
3.9. IR/IGF-1R signaling pathway in Tg2576/FoxO1ADA 90
3.10. APP Processing in Tg2576/FoxO1ADA mice 92
3.11. In vitro analysis of stably expressing FoxO1DN, FoxO1ADA and
FoxO1 neuroblastoma cells 93
3.11.1. Characterisation of stably expressing FoxO1DN, FoxO1ADA and
FoxO1 neuroblastoma cells 94
3.11.2. Proliferation of FoxO1DN, FoxO1ADA and FoxO1 expressing
neuroblastoma cells 96
3.11.3. FoxO1 and oxidative stress 98
4. Discussion 101
4.1. Neuron-specific expression of FoxO1DN and FoxO1ADA 102
4.1.2. Metablic characterization 103
4.1.3. Insulin/IGF-1R signaling in 28 weeks old animals 104
4.1.4. Growth of FoxO1DN and FoxO1ADA mice 104
4.1.5. Indirect caloricimetric and locomotion analysis 105
4.1.6. Behaviour of FoxO1DN and FoxO1ADA mice 106
4.2. Alzheimer´s disease 107
4.2.1. Metabolic characterization of Tg2576/FoxO1DN and
Tg2576/FoxO1ADA mice 107
4.2.2. Body weight of Tg2576/FoxO1DN and Tg2576/FoxO1ADA mice 107 4.2.3. Kaplan-Meier analysis of Tg2576/FoxO1DN and Tg2576/FoxO1ADA
Mice 108
4.2.4. IR/IGF-1R signaling in 60 weeks old Tg2576/FoxO1DN and
Tg2576/FoxO1ADA mice 110
4.2.5. APP processing in Tg2576/FoxODN and Tg2576/FoxO1ADA 111 4.3. In vitro studies of FoxO1 in human neuroblastoma cells 112
4.3.2. FoxO1 and proliferation 113
4.3.3. FoxO1 and oxidative stress 114
5. Summary 116
6. Zusammenfassung 118
7. References 119
8. Supplementary 134
8.1. Acknowledgement 135
8.2. Erklärung 136
8.3. Curriculum vitae 137
Figure 2: Insulin and insulin-like growth factor-1 signaling pathway. 6 Figure 3: Structure of forkhead box O transcription factor DNA binding domain. 9 Figure 4: Phosphorylation sites of the FoxO transcription factors. 11 Figure 5: Processing of the amyloid precursor protein (APP). 15 Figure 6: Aβ detoxification mechanism via HSF-1 and DAF-16. 19 Figure 7: Cre/loxP strategy for the FoxO1ADA and FoxO1DN expression in
neurons. 21
Figure 8: Structure of FoxO1, FoxO1ADA and FoxO1DN. 50
Figure 9: Breeding strategy of neuon-specific expressing FoxO1ADA and
FoxO1DN mice in Tg2576 background. 50
Figure 10: Detection of FoxO1DN. 51
Figure 11: Immunohistological staining of eGFP. 51
Figure 12: Blood glucose of FoxO1DN female and male mice untill 60 weeks
of age. 52
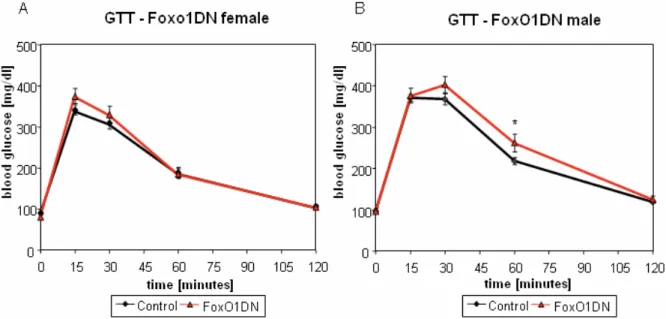
Figure 13: Glucose tolerance tests of FoxO1DN and wild-type mice. 53
Figure 14: Insulin tolerance test of FoxO1DN mice. 54
Figure 15: IR/IGF1R protein expression of 28 weeks old FoxO1DN mice. 54 Figure 16: IR/IGF1R signaling pathway of 28 weeks old FoxO1DN mice. 55 Figure 17: Body weight of FoxO1DN mice over 60 weeks. 56
Figure 18: Body composition of FoxO1DN male mice. 57
Figure 19: Analysis of bone density. 58
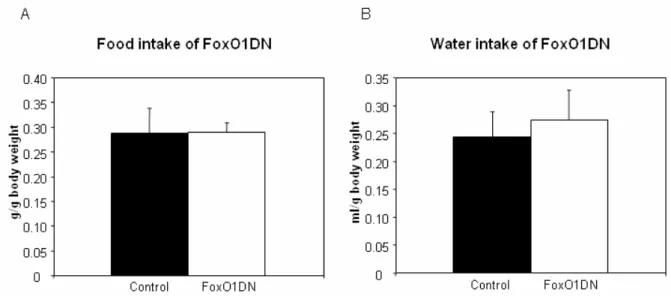
Figure 20: Body length of 60 weeks FoxO1DN male mice. 58 Figure 21: Food and water intake of 60 weeks old FoxO1DN male mice. 59
Figure 22: RotaRod for FoxO1DN male mice. 59
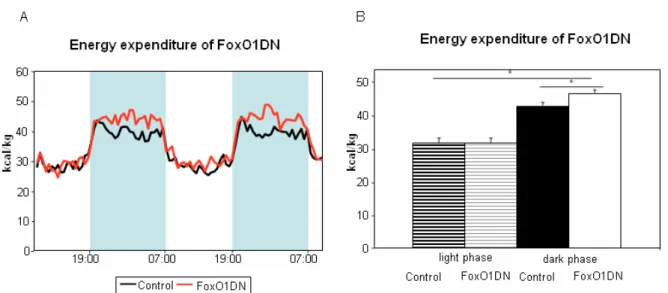
Figure 23: Locomotion activity of 60 weeks old FoxO1DN male mice. 60 Figure 24: Energy expenditure normalized to lean body mass of 60 weeks old
FoxO1DN mice. 61
Figure 25: Respiratory quotient of 60 weeks old FoxO1DN mice. 61 Figure 26: Nissl staining of the hippocampus of 28 weeks old FoxO1DN mice. 62
Figure 27: Open field and O-Maze test of FoxO1DN. 62
Figure 28: Water Maze test of FoxO1DN mice. 63
Figure 29: Blood glucose of FoxO1DN mice in Tg2576 background. 64 Figure 30: Glucose tolerance tests of Tg2576/FoxO1DNmice. 65 Figure 31: Insulin tolerance test of Tg2576/FoxO1DN mice. 65 Figure 32: Body weight of Tg2576/FoxO1DN mice until 60 weeks of age. 66
60 weeks of age. 68 Figure 35: IR and IGF-1R protein expression of 60 weeks old Tg2576/FoxO1DN
mice. 68
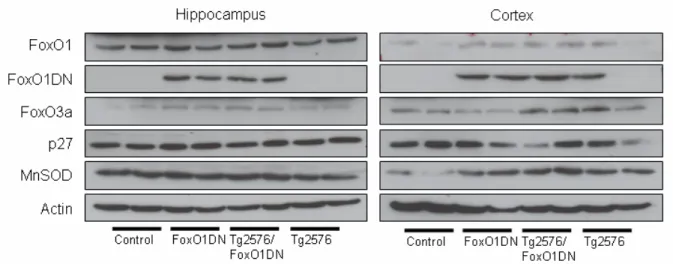
Figure 36: IR/IGF1R signaling pathway of 60 weeks old Tg2576/FoxO1DN mice. 69 Figure 37: Expression of FoxO1 and FoxO3a in Tg2576/FoxO1DN mice. 70 Figure 38: APP Processing of FoxO1DN mice in Tg2576 background. 70 Figure 39: Quantification of Aβ40 and Aβ42 in hippocampi of Tg2576
and Tg2576/FoxO1DN female mice. 71
Figure 40: Dot Blot for analysis of Aβ oligomers of Tg2576/FoxO1DN
hippocampus. 71
Figure 41: Expression of α-, β- and γ-secretases 60 weeks old
Tg2576/FoxO1DN mice. 72
Figure 42: Proteins involved in Aβ clearance in 60 weeks old Tg2576/FoxO1DN
mice. 72
Figure 43: Detection of FoxO1ADA. 73
Figure 44: Blood glucose of FoxO1ADA female and male untill 60 weeks of age. 74 Figure 45: Glucose tolerance tests of FoxO1ADA and wild-type mice. 74 Figure 46: Insulin tolerance tests of FoxO1ADA and wild-type mice. 75 Figure 47: Expression level of IR and IGF-1R from 28 weeks old FoxO1ADA mice. 75 Figure 48: IR/IGF1R signaling pathway of 28 weeks old FoxO1ADA mice. 76 Figure 49: Body weight of FoxO1ADA mice over 60 weeks. 77
Figure 50: Body composition of FoxO1ADA male mice. 78
Figure 51: Analysis of bone density. 79
Figure 52: Body length of 60 weeks old FoxO1ADA male mice. 79 Figure 53: Food and water intake of 60 weeks old FoxO1ADA male mice. 80 Figure 54: realTime PCR analysis of growth axis in 4 weeks old FoxO1ADA
male mice. 81
Figure 55: RotaRod test of FoxO1ADA male mice. 82
Figure 56: Locomotion activity of 60 weeks old FoxO1ADA male mice. 82 Figure 57: Energy expenditure of 60 weeks old FoxO1ADA mice. 83 Figure 58: Respiratory quotient of 60 weeks old FoxO1DN mice. 83 Figure 59: Nissl staining of the hippocampus of 28 weeks old FoxO1ADA mice. 84
Figure 60: Open field and O-Maze test of FoxO1ADA. 85
Figure 61: Water Maze test of FoxO1ADA mice. 86
Figure 62: Blood glucose levels of FoxO1ADA mice in Tg2576 background. 87
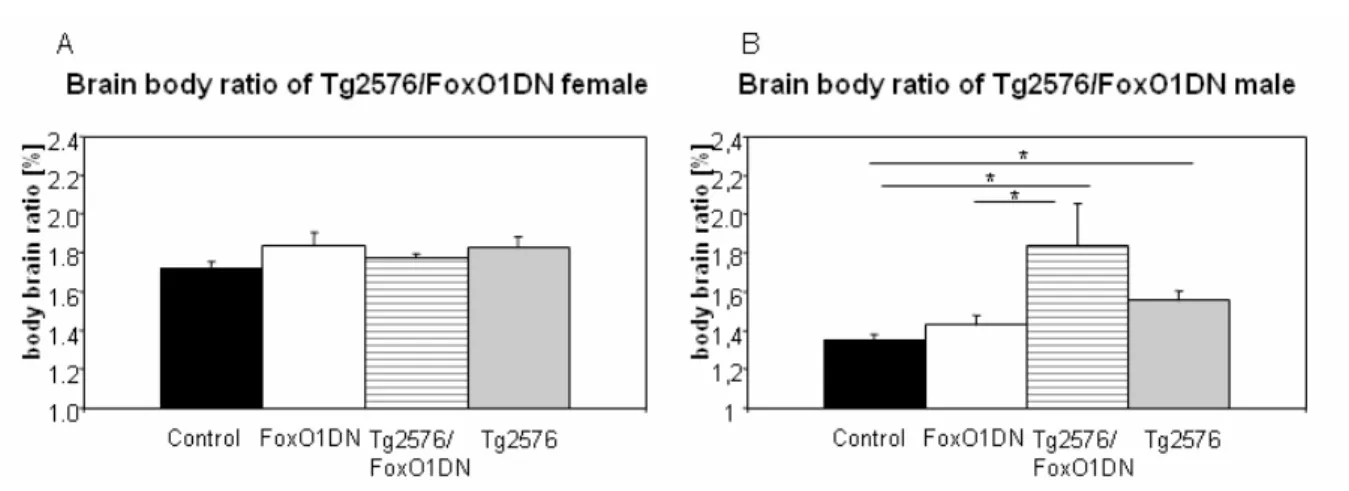
Figure 65: Body weight of Tg2576/FoxO1ADA until 60 weeks of age. 89 Figure 66: Body brain ratio of Tg2576/FoxO1ADA mica at 60 weeks of age. 89 Figure 67: Survival of FoxO1ADA mice in Tg2576 background until 60 weeks
of age. 90
Figure 68: IR and IGF-1R protein expression of 60 weeks old
Tg2576/FoxO1ADA mice. 91
Figure 69: IR/IGF1R signaling pathway of 60 weeks old Tg2576/FoxO1ADA
mice. 91
Figure 70: Expression of FoxO1 and p27 in 60 weeks old animals. 92 Figure 71: APP Processing of FoxO1ADA mice in Tg2576 background. 92 Figure 72: Level of Aβ40 and Aβ42 in hippocampi of Tg2576 and
FoxO1ADA/Tg2576 female mice. 93
Figure 73: Dot Blot for analysis of Aβ oligomers of FoxO1ADA/Tg2576
hippocampus. 93
Figure 74: Verification of stably overexpressing FoxO1DN, FoxO1ADA and
wild-type FoxO1 (FoxO1↑). 94
Figure 75: IR/IGF1R signaling pathway in stably expressing FoxO1DN,
FoxO1ADA and FoxO1 SHSY5Y cells. 95
Figure 76: Nuclear and cytosolic localisation of FoxO1 in overexpressing
neuroblastoma cells. 95
Figure 77: Analysis of IR/IGF1R signaling pathway in stably expressing
FoxO1DN, FoxO1ADA and FoxO1 neuroblastoma cells. 96 Figure 78: Proliferation of stably expressing FoxO1DN and FoxO1ADA. 97 Figure 79: Proliferation of stably expressing and FoxO1 neuroblastoma cells. 97 Figure 80: Expression level of MnSOD in stably expressing FoxO1DN and
FoxO1ADA neuroblastoma cells. 98
Figure 81: Oxidative stress in stably expressing FoxO1DN and
FoxO1ADA neuroblastoma cells. 98
Figure 82: TUNEL assay of stably expressing FoxO1DN and FoxO1ADA
neuroblastoma cells. 99
Figure 83: Analysis of TUNEL assay with stably expressing FoxO1DN and
FoxO1ADA neuroblastoma cells. 100
Table 2: PCR Programms for SynCre, Tg2576 (APP) and FoxO1 in the
ROSA26 locus. 34
Table 3: Primer used for the PCR to distinguish FoxO1ADA and –DN. 35 Table 4: PCR Program to distinguish FoxO1ADA and –DN. 35
Table 5: SDS-PAGE Gels (2 mini gels). 37
Tabel 6: Tricine Gel (2 mini gels). Addition of 7.2 g Urea to resolving gel was
used for protein expression analysis with small molecular size of 4kDa. 39 Table 7: Primer for cloning of FoxO1WT, FoxO1ADA and FoxO1DN. 43 Table 8: PCR program to amplify FoxO1ADA, -DN and FoxO1 wild type
(FoxO1WT). 44
AD Alzheimer's disease
ADAM A Disintegrin and Metalloprotease domain
AFX acute leukaemia fusion gene located in chromosome X AKT PKB synonym
α2M alpha 2 macroglobulin apoE Apolipoprotein E
APP Amyloid Precursor Protein APPsw Swedish mutation of APP APS Ammonium‐persulfate ATP Adenosintriphosphate
BACE‐1 Beta‐site APP Cleaving Enzyme‐1 BAD Bcl-2/Bcl-X-associated death promoter BBB Blood brain barrier
BME Basal medium eagle BSA Bovine serum albumin
C83 83‐amino‐acid C‐terminal APP fragment C99 99‐amino‐acid C‐terminal APP fragment CDK Cyclin-depentent kinase
CNS Central Nervous System CRAK c-raf leukemia viral oncogene CSF Cerebrospinal fluid
DAF-2 abnormal dauer formation protein 2 DAF-16 abnormal dauer formation protein 16 DAF-18 abnormal dauer formation protein 18 ddH2O Double‐disalled water
DMSO Dimethyl sulfoxide
DYRK Dual-specificity tyrosine-phosphorylated and regulated kinase 4E-BP 4E binding protein
eEF2 eukaryotic elongation factor 2 eIF4E eukaryotic initiation factor 4E
ELISA Enzyme Linked Immunosorbent Assays ER Endoplasmic reaculum
ERK Extracellular signal‐regulated kinase FAD familial Alzheimer's disease
FasL Fas ligand
FKHR Forkhead in rhabdomyosarcomas
FKHRL1 Forkhead in rhabdomyosarcomas-like protein 1 FoxO Forkhead box-O transcription factor
FoxO1ADA constitutive active FoxO1 FoxO1DN dominant negative FoxO1 FRE FoxO-recognized element GDP Guanosine‐diphosphate
GH Growth hormone
GHR Growth hormone receptor
GHRH Growth hormone releasing hormone
GHRHR Growth hormone releasing hormone receptor GRB2 Growth factor receptor binding protein 2 GSK‐3α/β Glycogen synthase kinase 3α/β
GTP Guanosine‐triphosphate IDE Insulin degrading enzyme IGF Insulin‐like growth factor
IGFBP1 Insulin-like growth factor binding protein 1 IGF‐1R Insulin‐like growth factor receptor type I IIS IR/IGF-1R signaling
IKKβ κB kinase β IR Insulin Receptor
IRa Insulin receptor isoform a IRb Insulin receptor isoform b IRS‐1 Insulin receptor substrate 1 IRS‐2 Insulin receptor substrate 2 IRSs Insulin receptor substrates JNK C-June-N-terminal kinase kDA kilo Dalton
LOAD Late onset of Alzheimer's disease mA milli Ampere
MAP‐kinase Mitogen‐acavated protein kinase MAPKAP-K1 MAPK-activated protein 1
MDM2 Murine double minute
MEK Mitogen‐acavated protein kinase kinase MnSOD Manganese dependent superoxide dismutase
nIGF-1R-/- neuronal specific IGF-1R knockout nIR-/- neuronal specific IR knockout NIRKO brain-specific knockout of IR P/S Penicillin‐Streptomycin; Pen Strep
p3 Short peptide containing the C‐terminal region of Aβ p90RSK RSK ribosomal protein S6 kinase
PAGE Polyacrylamide gel electrophoresis PBS Phosphate buffered saline
PCAF p300-associated factor
PDK1 Phosphoinosiade‐dependent protein kinase 1 PDVF Polyvinylidene difluoride
PEPCK Phosphoenolpyruvate carboxykinase PH Pleckstrin homology
PI3K Phosphaadylinositol‐tri‐phosphat kinase PI3,4P Phosphaadylinositol‐di‐phosphat
PI3,4,5P Phosphaadylinositol‐tri‐phosphat PKB Protein kinase B
PP2A Protein phosphatase 2A
PRMT1 Protein arginine N-terminal methyltransferase PTB Phosphotyrosin-binding
PTEN Phosphatase and tensin homolog RHEB Ras homolog enriched in the brain ROS Reactive oxygen species
rpm Rotations per minute sAPPα soluble APPα
sAPPβ soluble APPβ
SCFSkp2 substrate-binding component of the Skp1/culin 1/F-box protein SCPx sterol carrier protein x
SCP2 sterol carrier protein 2 SDS Sodium dodecyl sulfate
SDS‐PAGE Sodium dodecyl sulfate‐polyacrylamide gel electrophoresis SGK Glucocorticoid-inducible kinases
SH2 Src‐homology 2 SHP2 SH2‐Phosphatase 2
SIRT1 Silent information regulator-1
TACE Tumor necrosis factor-alpha converting enzyme TBS Tris buffered saline
TBS‐T Tris buffered saline 2% TWEEN 20®
TEMED N,N,N',N'‐tetramethylethylenediamine
Tg2576 Transgenig mouse model for Alzheimer’s disease TSC-2 Tuberine 2
TWEEN 20® Polyoxyethylene (20) sorbitan monolaurate (Polysorbate 20)
1. Introduction
The mammalian forkhead box O transcription factor (FoxO) family contains 4 members, FoxO1, FoxO3a, FoxO4 and FoxO6. (Clark et al., 1993). FoxOs present a conserved DNA binding domain, the forkhead domain (FKHR) (Clark et al., 1993; Furayama et al., 2000) FoxOs play a role in metabolism, cell cycle control and stress resistance. FoxO mediated transcription is amongst others regulated via phosphorylation. Phosphorylation which negatively regulates FoxO action, leads to association of FoxO with 14-3-3 and transport out of the nucleus.
Phosphorylation of FoxOs is induced by the C-June-N-terminal kinase (JNK) pathway upon oxidative stress to regulate transcription of target genes (Esser et al., 2004). This pathway antagonizes the Insulin and Insulin-like growth factor 1 (IGF-1) signaling pathways which negatively regulates FoxOs. In vitro activation of JNK leads to phosphorylation of 14-3-3ξ.
This mediates dissociation of FoxO3a from 14-3-3 and in turn results in nuclear retention of FoxO3a and therefore it is active and promotes transcription of its target genes (Sunayama et al., 2005).
Furthermore phosphorylation of FoxOs occurs via the glucocorticoid-inducible kinases (SGKs) and AKT which are serine threonine kinase (Lin et al., 1997; Ogg et al., 1997; Brunet et al., 2001). Both kinases are regulated via the Phosphatidylinositide(PI)3 kinase (PI3K) pathway. These kinases are activated, translocate into the nucleus and phosphorylate FoxO which leads to inactivation of FoxO mediated transcription (Brunet et al., 2001).
Thus, FoxO are regulated via different pathways and FoxO mediated transcription is involved in several cellular functions. One of the main pathways involved in the pathogenesis if neurodegenerative diseases, is the insulin/insulin-like growth factor-1 (IGF-1) signal transduction. The present thesis focuses on the role of FoxO1, a downstream target of the insulin/IGF-1 signaling cascade in neurodegeneration.
1. 1. The Insulin and Insulin-like growth factor-1 signaling pathway
The Insulin and Insulin-like growth factor 1 (IGF-1) signaling pathways has several functions lincluding growth, metabolic homeostasis, development and stress resistance. In addition, the Insulin and IGF-1 signaling pathway is involved in determination of lifespan (review in Broughton and Patridge, 2009).
1.1.1. Insulin- and Insulin-like growth factor-1 receptors
The Insulin- and Insulin-like growth factor-1 receptors (IR and IGF-1R) belong to the family of receptor tyrosine kinases. These receptors consist of a domain with tyrosine kinase activity bound to the membrane which phosphorylates tyrosine-residues of downstream signaling
proteins of the IR and IGF-1R signaling pathway. The IR was discovered in 1974 and its tyrosine kinase activity was found in 1982 (Megyesi et al., 1974; Kasuga et al., 1982; Kasuga et al., 1982). Later the IGF-1 receptor was discovered and classified as a receptor tyrosine kinase receptor as well (Megyesi et al., 1974; Jacobs et al., 1983; Rubinet al., 1983). Both IR and IGF-1R show a heterotetrameric structure. The α-subunits with a size of 135kDa are localized extracellular (Van Obberghen et al., 1981; Ullrich et al., 1986). The β-subunits which are about 95kDa are composed of a short extracellular, a transmembrane and an intracellular domain. The intracellular part contains ATP-binding motifs, autophosphorylation sites and tyrosine-specific protein kinase activity. Autophosphorylation sites of the IR are tyrosine 1146, 1150 and 1151 as well as 1131, 1135 and 1136 of the IGF-1R. The subunits of the receptor are linked via disulfide bonds. (Kahn et al., 1978; Kasuga et al., 1982; Chou et al., 1987; White, 1998).
The gene which encodes the insulin receptor contains 22 exons and 21 introns (Seino et al., 1989). Two different isoforms of the insulin receptor occur due to alternative splicing of exon 11 that codes for 12 amino acids. Isoform A of the IR lacks these 12 while isoform B contains these amino acids. The IGF-1R gene posesses no equivalent to exon 11, hence no isoforms exists. Both isoforms A and B of the IR bind to insulin with similar affinity (McClain, 1991).
Isoform A shows an increased affinity to IGF-2 compared to isoform B (Yamaguchi et al., 1991; Frasca et al., 1999). The expression of the A-isoform of the IR mainly occurs in fetal tissue, hematopoietic cells and adult nervous system. Isoform B is predominantly expressed in adipose tissue, muscle and liver (Seino and Bell, 1989; Moller et al., 1989; Goldstein and Kahn, 1989; Mosthaf et al., 1990). In addition, different binding affinities to insulin or IGF-1 is dependent on the assembly of IR or IGF-1R (Pandini et al. 2002). IGF-1, IGF-2 and insulin are bound to the hybrid of IGF-1R and isoform A of the IR with similar affinity. However, IGF- 1 is bound to the hybrid of IGF-1R and isoform B of the IR (Louvi et al., 1997) (Fig. 1).
Figure 1: Receptor isoforms and hybrids.
Isoforms A and B of the IR bind to insulin with similar affinity. Isoform A shows an increased affinity to IGF-2 compared to isoform B. The IGF-1R and the receptor hybrid of IGF-1R and isoform A of the IR bind to insulin and both IGFs. The IGF-1R and isoform B of the IR receptor hybrid predominantly binds to IGF-1(modified, Freude and Schubert, 2010).
1.1.2. Insulin receptor substrates
Binding of insulin or IGF-1 to the IR or IGF-1R induces a conformational change of the receptor. This causes autophosphorylation of the β-subunits. The autophosphorylated receptors tyrosine kinase then recruit insulin receptor substrates (IRS) which become tyrosine phosphorylated (Fig. 2). The family of IRS proteins includes IRS-1 to IRS-4 (Sun et al. 1991; Lavan et al. 1997; Lavan, Lane, and Lienhard 1997). IRS was first described in 1985 and called pp185 because of its size of 185kDa and it was phosphorylated after exposure to insulin. Inactivated insulin was not able to induce phosphorylation of pp185.
pp185 was first cloned in 1991 and the protein was named IRS-1 (White, Maron, and Kahn 1985; Sun et al. 1991). IRS-2 (160kDa) was discovered in 1995 and IRS-3 (60kDa) as well as IRS-4 (160kDa) were found in 1997 (Sun et. al 1995; Lavan et al. 1997; Lavan, Lane, and Lienhard, 1997).
IRS proteins show distinct expression patterns. IRS-1 and -2 are ubiquitously expressed while IRS-3 mainly occurs in murine adipose tissue and IRS-4 is epressed in kidney, heart, thymus as well as hypothalamus. All these IRS proteins present similar functions and structure (Giovannone et al., 2000; Schubert et al., 2003). Their structure is subdivided into an N-terminal pleckstrin homology (PH) domain, a phosphotyrosine-binding (PTB) domain and a C-terminal tail with multiple tyrosine phosphorylation sites. Lipids and especially phosphoinositides bind the the PH domain of IRS proteins (Fruman, Rameh, and Cantley 1999) facilitating binding of IRS proteins to the membrane. The PTB domain of the IRS
proteins associate with the tyrosine phosphorylated juxtamembrane domain of the IR or IGF- 1R after binding of the receptor to insulin or IGF-1. Upon recruitment of IRS to this motif of the receptor, the IRS proteins get phosphorylated at the tyrosine residues (Cheatham and Kahn, 1995; White, 2002). Then Src homology(SH)2 domain containing proteins bind to the phosphotyrosine motifes of the IRS (Yenush and White, 1997).
Unique for IRS-2 is the KLRB domain which attaches to the phosphorylated kinase regulatory loop of the β-subunit of the IR (Sawka-Verhelle et al., 1997; Sawka-Verhelle et al., 1996).
Binding of insulin to the IR causes tyrosine and serine phosphorylation of IRS-1 (Gual, Le Marchand-Brustel, and Tanti 2005). The phosphorylation pattern of IRS-1 induces differential regulation of the downstream signaling proteins because the phosphorylation of the serine residues leads to activation or inactivation of IRS-1 (Weigert et al. 2005; Weigert et al. 2008).
The regulation of IRS-1 action is dependent on phosphorylated serine sites (Herschkovitz et al. 2007) and specific timing of phosphorylation (Weigert et al. 2005; Weigert et al. 2008).
The most favoured model of the role of phosphorylation timing is that serine residues positively regulating IRS-1 function are phosphorylated first. This supports IRS-1 action and protect it from negative regulation via phosphorylation of inhibitory serine residues (Weigert et al. 2005; Weigert et al. 2008; Gual, Le Marchand-Brustel, and Tanti 2005; Luo et al. 2007).
Additionally, serine phosphorylation of IRS-1 might probably entrance or hamper the association with tyrosine phosphatases. Phosphorylation of Ser1223 might alter the recruitment of IRS-1 to the protein tyrosine phosphatase Src homology domain 2 (SH2)- containing phosphatase-2 (SHP-2). The mutation of Ser1223 to alanine caused prevention of phosphorylation and increased association with SHP-2. Furthermore tyrosine phosphorylation of IRS-1 upon stimulation with insulin was decreased as well as the association of IRS-1 with the p85 regulatory subunit of the phosphatidylinositol-3-kinase (Luo et al. 2005).
This model of IRS-1 phosphorylation is also supported by the localization of serine residues with positive and negative effect. Serine sites with inhibitory effect are located near to the PTB domain, therefore these sites are phosphorylated later than the residues with positive effect after induction of the insulin signaling pathway. In detail, the phosphorylation of the serine residues near the PTB domain causes disruption of the association of IRS-1 to IR leading to degradation of IRS-1. Phosphorylated inhibitory serine residues at the C-terminus of IRS-1 induces its disassociation and inactivation of the phoshatidylinositide (PI)3-kinase (Gual, Le Marchand-Brustel, and Tanti 2005; Boura-Halfon and Zick 2009). These serine sites are phosphorylated by different serine kinases such as p70S6 (S6K) kinase, target of rapamycin (mTor) and PKCzeta (Boura-Halfon and Zick 2009; Herschkovitz et al. 2007; Gual et al. 2003).
Inhibitory serine sites of IRS proteins are phosphorylated by c-Jun N-terminal kinase (JNK), SIK-2, mTor/S6K, extracellular signal regulated kinase (ERK) and κB kinase β (IKKβ) which might result in insulin and IGF-1 resistance (Boura-Halfon and Zick 2009; Herschkovitz et al.
2007). The serine phosphorylation residues of IRS-2 are not fully understood. JNK phosphorylates Thr348 located near the PTB domain of IRS-2 which might cause disassociation of IRS-2 from the IR or IGF-1R (Solinas et al. 2006). Additionally JNK phosphorylates Ser488 which supports the phosphorylation of Ser484 via glycogen synthase kinase (GSK)-3β. This disturbs the insulin or IGF-1 signaling pathway (Sharfi and Eldar- Finkelmann, 2008).
Figure 2: Insulin and insulin-like growth factor-1 signaling pathway.
Binding of insulin or insulin-like growth factor-1 (IGF-1) to the insulin-or IGF-1 receptor (IR or IGF-1R) induces a conformational change of the receptor leading to autophosphorylation. This is followed by recruitment and activation of insulin receptor substrates 1 to 4 (IRS-1 to -4). Then the MAP kinase (MAPK) and the Phosphatidylinositide(PI)3 kinase (PI3K) signaling are activated leading to inhibition of FoxO1 mediated transcription (modified, Moll et al., 2011).
1.1.3. Phosphatidylinositide(PI)3 kinase signaling
The mammalian PI3 kinase family is subclassified into classes I to III. Class I is additionally subdivided into Ia and Ib (Vanhaesbroeck et al., 2005). These kinases phosphorylate the 3´hydroxyl position of phosphatidyl-myo-inositol lipids. The PI3K activated after insulin or IGF-1 stimulus belongs to the class Ia kinases (Fruman et al., 1998). This kinase shows a
heterodimer structure with acatalytic subunit of 110 kDa which is noncovalently associated with a 50-, 55- or 85 kDa regulatory subunit. After binding of insulin or IGF-1 to the IR or IGF- 1R and association of IRS to the receptor, the PI3K is recruited to the membrane by the p85 regulatory subunit. In addition, growth factor binding protein (GRB)-2 and the SH2- Phosphatase(SHP)2 are recruited. After activation of PI3 kinase phosphatidylinositide- diphosphate (PI4,5P) is phosphorylated to generate phosphatidylinositide-triphosphate
(PI3,4,5P). This phosphorylation is reversible via phosphatase and tensin homolog deleted on
chromosome ten (PTEN) (Fig. 1). The production of PI3,4,5P induces activation of the downstream signaling targets phosphoinositide-dependent protein kinase (PDK) and protein kinase B (PKB, AKT). PDK has two isoforms called PDK-1 and PDK-2. PDK-1 phosphorylates AKT at the residue Thr308 leading to a partial activation of AKT. To entirely activate AKT it has to be phosphorylated at Ser473 (Stokoe et al., 1997; Alessi et al., 1996;
Lawlor and Alessi, 2001).
AKT is a serine/threonine kinase which is about 57 kDa. Three isoforms of AKT, AKT1 to AKT3 exist which show a conserved structure, a PH domain at the N-terminus, a kinase domain and a regulatory subunit at the C-terminus (Hreasko et al., 2003). After AKT is activated, it phosphorylates tuberin 2 (TSC-2) which can form a heterodimer with TSC-2 and contains GTPase activity that inhibits the GTPase RAS homolog enriched in the brain (RHEB). The consequence of phosphorylation by AKT is the accumulation of the RHEB-GTP complex which activates mTOR (Astrinidis and Henske, 2005; Hay et al., 2004). mTor and PDK-1 phosphorylate and activate S6K.
IGF-1 controls protein synthesis via regulation of intrinsic activity and binding properties of the translation initiation and elogantion factors eIFs and eEFs. Phosphorylation of 4E binding protein (4E-BP) via mTor results in the release of eukaryotic initiation factor 4E (eIF4E).
These factors form a complex which activates S6K and facilitates translation initiation. S6K phosphorylates and activates the eukaryotic elongation factor 2 (eEF2) leading to release of eEF2 and initiation of elongation (Nojima et al., 2003; Oshiro et al., 2004).
The glycogen synthase kinase(GSK)-3β and Bcl-2/Bcl-X-associated death promoter (BAD) are also regulated by the IR and IGF-1R signaling pathway. GSK-3β is a major tau kinase and BAD, a proapoptotic factor, which both become inactivated upon insulin or IGF-1 stimulus (Song et al., 2005).
BAD mainly interacts with the apoptose suppressor Bcl-XL via its BH3 homology domain but also with Bcl-2 (Yang et al., 1995; Zha et al., 1997). The phosphorylation of BAD regulates this interaction. After phosphorylation BAD associates with 14-3-3 and releases its binding partner Bcl-XL or Bcl2 to prevent apoptosis. The main phosphorylation sites of BAD to regulate apoptosis are Ser112 (Zha et al., 1996), Ser136 (Zha et al., 1996), Ser155 (Licano et al., 2000; Tan et al., 2000) and Ser170 (Dramsi et al., 2002). Several kinases are able to
phosphorylate BAD such as AKT (Datta et al., 1997), PI3K (Pastorino et al., 1999), PKA (Harada et al., 1999), PKC (Bertolotto et al., 2000) and Rsk also known as MAPK-activated protein 1 (MAPKAP-K1) (Bertolotto et al., 2000). The phosphorylation sites Ser112 and Ser136 of BAD regulate the binding to 14-3-3 (Zha et al., 1996) and phosphorylation of Ser155 leads to dissociation of BAD from Bcl-XL (Licano et al., 2000). Thus IR/IGF-1R signaling pathway inhibits apoptosis via BAD phosphorylation and the release of antiapoptotic factors (Schubert et al., 2003).
1.1.4. Forkhead box O transcription factors
After insulin or IGF-1 stimulus AKT becomes activated and phosphorylates the forkhead box O transcription factor (FoxO). This event causes the binding of FoxO to 14-3-3 followed by export out of the nucleus and FoxO mediated transcription is inhibited. So far known FoxOs regulate transcription of genes involved in metabolism, growth, development, ageing and apoptosis (Patridge and Bruning, 2008). In Caenorhabditis elegans and Drosophila melanogaster a single FoxO transcription factor was identified, abnormal dauer formation protein 16 (DAF-16), and dFOXO in D. melanogaster. The mammalian FoxO protein family contains 4 members, FoxO1, FoxO3a, FoxO4 and FoxO6. (Clark et al., 1993).
The FoxO1 gene was discovered during studies of the t(2,13)(q35;q14) and t(1.13)(p36;q14) chromosomal translocations which occur in alveolar rhabdomyosarcoma. Meanwhile FoxO1 was called forkhead in rhabdomyosarcomas (FKHR) (Galili et al., 1993). FoxO3a, originally termed as forkhead in rhabdomyosarcomas-like protein 1 (FKHRL1) was found during the analysis of the chromosomal translocation t(6;11)(q21;q23) in leukaemia (Hillion et al., 1997) and cDNA library screening (Anderson et al., 1998). FoxO4 which was first called acute leukemia fusion gene located in chromosome X (AFX) was identified during the analysis of the chromosomal translocation t(X;11)(q12;q23) was analyzed (Borkhardt et al., 1997; Corral et al., 1993; Parry et al., 1994). FoxO6 was characterized by Jacobs and coworkers in 2003 (Jacobs et al., 2003).
Figure 3: Structure of forkhead box O transcription factor DNA binding domain.
Amino acids of the conserved DNA binding domain of the FoxO family are showen. Displayed are FoxO1, FoxO3a, FoxO4, FoxO6, DAF-16, the orthologue of FoxO in C.elegans, and FoxA1 also known as hepatocyte nuclear factor 3-alpha which is liver-specific and a member of the forkhead family (Van der Vos and Coffer; 2011).
FoxOs contain a nuclear localization signal, a nuclear export signal and a transactivation domain. Additionally, FoxOs share the same conserved DNA binding domain, the forkhead domain (FKHR) and recognize the core binding motif sequence: TTGTTTAC (Clark et al., 1993; Furayama et al., 2000). The DNA binding domain is composed of three α-helices H1 to H3, three β-strands S1 to S3 as well as two wing-like loops W1 and W2 (Fig. 3) (Boura et al., 2007). The consensus FoxO-recognized element (FRE) was identified during high-affinity DNA-binding studies and contains the sequence (G/C)(T/A)AA(C/T)AA (Biggs et al., 1999;
Furayama et al., 2000; Gilley et al., 2003). This FRE sequence exists in the promoter region of e.g. Fas ligand (FasL) (Brunet et al., 1999), insulin-like growth factor binding protein 1 (IGFBP1) (Barthel et al., 2005; Cichy eta l., 1998), Bim (Dijikers, Medema, Lammers et al., 2000), p27KIP1 (Dijikers, Medema, Pals et al., 2000; Medema et al., 2000) and manganese dependent superoxide dismutase (MnSOD) (Kops et al., 2002).
FoxO1, FoxO3a and FoxO4 are ubiquitously expressed but FoxO6 is only present in the brain (Furayama et al., 2000; Jacob et al., 2003). The FoxO transcription factors show distinct expression patterns in the murine brain. FoxO1 is mainly expressed in the striatum, dentate gyrus and ventral hippocampus. FoxO3a compared to FoxO1 is more diffusely expressed e.g. in cortex, cerebellum and hippocampus. FoxO6 is highly expressed in nucleus accumbens, claustrum, amygdale-hippocampal area and hippocampus. (Hoekman et al., 2006).
1.1.4.1. Regulation of FoxO mediated transcription
Post-translational modifications of FoxO transcription factors regulate their activity.
Phosphorylation of FoxOs mainly controls FoxO mediated transcription. AKT phosphorylates FoxO1 at Thr24, Ser256 and Ser319 (Biggs et al., 1999; Brunet et al., 1999; Kops et al., 1999; Rena et al., 1999; Tang et al., 1999) and FoxO3a becomes phosphorylated at Thr32, Ser253 and Ser315 (Brunet et al., 1997). After insulin or IGF-1 stimulation these sites get phosphorylated via AKT and FoxO interacts with 14-3-3 and translocates out of the nucleus which inactivates FoxO mediated transcription (Brunet et al., 1999). FoxOs are also phosphorylated by other kinases which are dependent on certain stimuli (review in Huang and Tindall, 2007). E.g. FoxO1 can additionally be phosphorylated by dual-specificity tyrosine-phosphorylated and regulated kinase (DYRK). DYRK phosphorylates FoxO1 at Ser329 (Woods et al., 2001). This phosphorylation inhibits FoxO1 activity (Rena et al., 2002).
Furthermore FoxOs are phosphorylated via glucocorticoid-inducible kinases (SGKs) (Brunet et al., 2001). Similar to AKT these kinases are serine/threonine kinases which are regulated by the PI3K pathway the same way AKT is regulated. Upon activation SGKs translocate into the nucleus and phosphoylates FoxO3a which in turn inactivates FoxO3a. SGK1 predominantly phosphorylates Ser319 while AKT prefers Ser256 of FoxO3a (Brunet et al., 2001).
In addition activation of the C-Jun-N-Terminal kinase (JNK) upon oxidative stress leads to nuclear localization of FoxO3a (Lehtinen et al., 2006) (Fig. 4).
Another post-translational modification of FoxOs is ubiquitylation after phosphorylation by AKT, ERK-1/2 and IκB kinase (IKK). FoxO1 is polyubiquitylated by Skp2, the substrate- binding component of the Skp1/culin 1/F-box protein (SCFSkp2) E3 ligase complex upon phosphorylation of Ser256 via AKT or it is ubiquitylated by murine double minute (MDM2) after phosphorylation by ERK-1/2 (Huang et al., 2005, Yang, Zong et al., 2008; Yang, Dolloff et al., 2008; Fu et al., 2009).
FoxO1 and FoxO3a have to be polyubiquitylated for degradation in contrast to FoxO4 which gets monoubiquitylated for degradation (van der Horst et al., 2006).
Furthermore FoxO transcription factors are methylated. FoxO1 is methylated at Arg248 and Arg250 located in the AKT phosphorylation motif. This methylation is mediated by the protein arginine N-terminal methyltransferase 1 (PRMT1) and protects FoxO1 from being phosphorylated by AKT and nuclear exclusion (Yamaga et al., 2008).
Finally FoxO transcription factors are acetylated. CBP and p300 with their interacting proteins like CBP- and p300-associated factor (PCAF) have intrinsic histone acetyl- transferase activity. Hence CBP and p300 can promote transcription through histone acetylation or immediately regulate transcription by acetylation of the transcription factor itself (Li et al., 2002). Acetylation of FoxO decreases DNA binding and promotes phosphorylation
of FoxO at Ser256 via AKT which inactivates FoxO. However the recruitment of CBP and p300 to the promoter by FoxO in addition mediates the acetylation of histones and might facilitate initiation of transcription (Daitoku et al., 2004; Matsuzaki et al., 2005). Deacetylation of FoxO is performed by silent information regulator 1 (SIRT1) which is a nicotinamide adenine dinucleotide(NAD)-dependent histone deacetylase. It has been shown that FoxOs are deacetylated by SIRT2 and -3. These deacetylases bind to acetylated FoxOs upon stress stimuli and induce deacetylation to control FoxO mediated transcription (Brunet et al., 2004;
Kitamura et al., 2005).
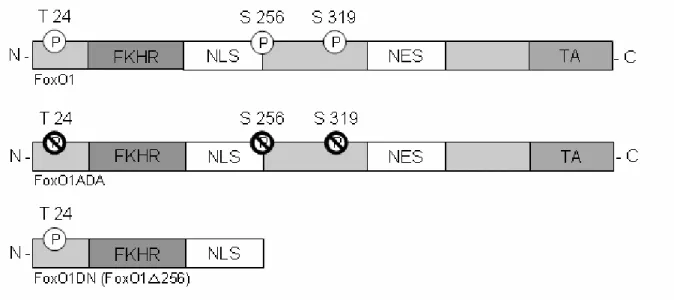
Figure 4: Phosphorylation sites of the FoxO transcription factors.
The structure of FoxOs consists of a forkhead domain (FKH), a nuclear localization signal (NLS), a nuclear export signal (NES) and a transactivation domain (TA). Kinases which phosphorylate FoxOs are shown above. The exact phosphorylation sites are presented beneath the FoxO structure (modified, van der Horst and Burgering, 2007)
1.1.5. Function of FoxOs
FoxOs are involved in metabolism, cell cycle control and stress resistance. Besides triggering glucose uptake insulin controls FoxO mediated transcription of phosphoenolypyruvate carboxykinase (PEPCK) and glucose-6-phosphatase which are part of the gluconeogenesis machinery. In general FoxO1 suppresses transcription of the genes which are involved in glycolysis and gluconeogenesis (Barthel at al., 2001; Nakae et al., 2001; Zhang et al., 2006).
FoxOs additionally induce cell cycle arrest. These transcription factors regulate the G1-S and G2-M phase of the cell cycle. Cell cycle is adjusted by several cyclins and cyclin-dependent kinases (CDKs). CDKs phosphorylate and thereby regulate different targets which play a role in cell cycle progression. An important inhibitor of CDKs is p27, a member of the Cip/Kip protein family. p27, p21 and p57 bind to cyclins and CDKs complexes and inhibit their action.
Targets of p27 are cyclin A-, cyclin D- and cyclin E-CDK complexes (review in Besson et al., 2008). The expression of p27 is regulated by FoxOs. Other cell cycle inhibitors regulated by FoxOs are p130Rb2, cyclin D1 and cyclin G2 (Medema et al., 2000; Kops et al., 2002;
Martinez-Gac et al., 2004; Schmidt et al., 2002) as well as p15 and p19 which are also CDK inhibitors (Besson et al., 2008). Under fasting conditions the insulin signaling cascade is inactive but FoxOs are still active and can promote cell cycle arrest and quiescence (Kops et al., 2002). Therefore FoxOs promote survival under fasting conditions. This is comparable to
C.elegans dauer formation which is induced by DAF-16. Furthermore FoxOs regulate transcription of the insulin receptor and IRS2 to guarantee a fast adaptation to higher glucose levels (Puig and Tjian, 2005; review in van der Horst and Burgering, 2007).
Another function of FoxOs is the regulation of oxidative stress response. In response to oxidative stress which occurs under fasting conditions when ATP production has to be promoted via fatty-acid oxidation. FoxOs counteract the oxidative stress induced reactive oxygen species (ROS) via increasing expression of antioxidant enzymes. Such enzymes are catalases (Nemoto and Finkel, 2002) and manganese superoxide dismutase (MnSOD) (Kops et al., 2002). In addition FoxOs promote the upregulate the fatty acyl-CoA carriers, sterol carrier protein-x (SCPx) and sterol carrier protein-2 (SCP2) (Dansen et al., 2004).
1.1.5. MAPK signaling
In addition to the PI3 kinase signaling pathway insulin or IGF-1 can induce the activation of the mitogen activated protein kinase (MAPK) cascade. Insulin or IGF-1 bind to the IR or IGF- 1R leading to authophosphorylation of the receptor, recruitment and phosphorylation of IRS followed by the binding of IRS to the SH2 domain of downstream signaling proteins like GRB-2 (White, 2000). Next GRB-2 binds to son of sevenless (SOS) which is a GDP/GTP exchange factor. Then the small G-protein rat sarcoma (RAS) is activated and recruits c-raf leukemia viral oncogene (CRAF) to the membrane which activates MAP-ERK kinases (MEK) and finally the extracellular signal-regulated kinase (ERK)-1/-2 (Kolch, 2000). Furthermore ERK-1/-2 controls phosphorylation of FBJ osteosarcoma oncogene (FOS) by p90RSK (RSK:
ribosomal protein S6 kinase) as well as phosphorylation of ETS oncogene family (ELK-1).
The activity of ERK-1/-2 is involved in long-term potentiation and memory consolidation within the CNS (review in Sweatt, 2001).
1.2. Alzheimer’s disease
Alzheimer’s disease (AD) is a chronic and progressive neurodegenerative disorder and the most common form of dementia and to loss of cognitive abilities and finally to death (Citron, 2002; Cole et al., 2007). AD was first discovered by Alois Alzheimer in 1906 (Alzheimer, 1907).
Characteristic for AD is the accumulation of intracellular neurofibrillar tangles (NFT) and extracellular amyloid plaques. The NFTs are composed of hyperphosphorylated tau proteins (Ross et al., 2005). Amyloid plaques mainly consist of aggregated amyloid-β (Aβ) peptides (Masters et al., 1985). The aggregation of Aβ might be the most important cause for neurodegeneration in the pathology of AD (Masters et al., 1985).
1.2.1. Pathology of Alzheimer´s disease
Patients with AD show cognitive dysfunctions which are categorized into three subgroups:
The first group of cognitive dysfunctions includes language disabilities, loss of memory and loss of executive functions like the ability to plan or to coordinate. The second group, the non-cognitive symptoms, include psychiatric symptoms and disturbances of behavior such as hallucinations and depression. The last group of cognitive dysfunctions are disturbed performing activities which are subdivided into instrumental and basic performing activities.
Alzheimer’s disease progresses from mild cognitive impairment to severe dementia (Burns et al., 1990).
AD is subdivided by the age of onset and the form of inheritance. Up to 6% of all AD patients develop the disease before the age of 65, so called early onset. Nearly 60% of these patients display the familial form of AD and from these cases about 13% inherited an autosomal dominant form of AD (Rocca et al., 1991; Campion et al., 1999). This form of AD is called familial Alzheimer´s disease (FAD) and starting at the age of 30 to 40 years. The late onset AD is developed by patients of 65 years or older.
1.2.2. Hyperphosphorylation of tau
In the human brain six isoforms of tau have been investigated. These isoforms result from alternative splicing of exons 2, 3 and 10. Both exons 2 and 3 partially encode the N-terminus of tau. In contrast exon 10 encodes the additional MTB (microtubule binding) domain.
Consequently tau can consist of three or four MTB repeats (reviewed in Ballatore et al., 2007; Goeders et al., 2006). The exact funtion of tau is not clearly understood yet. A possible function is the stabilization of microtubules and the regulation of transports along the axons (Götz et al., 2006). Tau is mainly found in axons of neurons (Hirokawa et al., 1996) but it might also be located in dendites of neuron (Ittner et al., 2010).
Tau is phosphorylated at several sites by different kinases including cyclin-dependent kinase 5 (Cdk5), c-Jun N-terminal kinase (JNK), protein kinase A (PKA), ERK1/2 and glycogen synthase kinase 3 (GSK3β). Abnormal high phosphorylation by these kinases is called
“hyperphosphorylation” (Robertson et al., 1993; Hanger et al., 1992; Flaherty et al., 2000;
Cho et al., 2004; Stoothoff et al., 2005). A major tau kinase is GSK3β. GSK3β is inactivated after phosphorylation of Akt at Ser9 and is dephosphorylated by PP2A the predominant tau phosphatase in the human brain. Tau is dephosphorylated by PP2A at Thr205, Thr212, Ser214, and Ser262 in vitro (Qian et al., 2010). This complex regulation might indicate the importance of the equilibrium of phosphorylation and dephosphorylation (Sontag et al., 1996;
Liu et al., 2008; review in Milliward et al., 1999). The phosphorylation of tau particularly at Ser422 rescues tau from degradation (Guillozet-Bongaarts et al., 2006).
1.2.3. Generation of amyloid-β
Amyloid-β is produced by endoproteolytic cleavage of the amyloid precursor protein (APP).
APP is a type-1 integral membrane protein and was discovered in 1987 (Kang et al., 1987;
Tanzi et al., 1987; Goldgaber et al., 1987, Robakis et al., 1987). APP consists of an N- terminal extracellular domain and a smaller C-terminal domain located in the cytoplasma.
Different APP splicing variants are distinguishable by length of the resulting protein, APP with a size of 751 or 770 amino acids (APP751 and APP770) are basically expressed in non- neuronal tissue. APP with a size of 695 amino acids (APP695) mainly occurs in neurons (Kang and Muller-Hill, 1990). The function of APP and APP-like protein (APLP) are not well understood. These proteins might be involved in apoptosis, axonal transport and cell adhesion. APP and APLP are expressed in nearly all vertebrates and invertebrates (Zheng and Koo, 2006; Anliker and Muller, 2006; Cao and Sudhof, 2001).
Maturation of APP includes N-glycosylation in the endoplasmatic reticulum and early Golgi network. N-glycosylated APP cannot be cleaved via secretases (Tomita et al., 1998).
Trafficking within the Golgi network causes a change from N-glycosylation to O-glycosylation.
Thereafter APP enters the sectretory pathway (Small and Gandy, 2006).
APP is cleaved via the α-secretase ADAM9, ADAM10 (a disintegrin and metalloproteinase- like 9 or 10) or TACE (tumour necrosis factor-alpha convertase) (also known as ADAM17) represents the “non-amyloidogenic pathway”. Additionally APP is processed by the β- secretase BACE1 (β-site APP-cleaving enzyme) resulting in the “amyloidogenic pathway”.
α-secretase cleaveage of APP leads to a C-terminal fragment C83 and soluble sAPPα. The γ-secretase, a complex formed by presenilin, nicastrin, Aph-1 and Pen-2 cleaves C83 and thereby generates p3 (~3 kDa) and APP-intracellular domain (AICD, ∼6kDa).
Cleavage of APP by the β-secretase BACE1, a type 1 membrane protease, is the rate limiting step in the production of Aβ. This secretase cleaves APP at Asp+1 at the N-terminus which results in generation of soluble sAPPβ and the C-terminal fragment C99. Following this event C99 is cleaved via the γ-secretase releasing Aβ (4 kDa) and AICD. Aβ occurs mainly in two variants; Aβ40 ending at residue 40 and Aβ42 which ends at residue 42. The decision whether the α- or β-secretase cleaves APP is dependent on the competition between these enzymes. It has been shown that an increase of β-secretase cleavage of APP leads to a decreased α-secretase cleavage and vice versa (Vassar et al., 1999; Skovronsky et al., 2007) (Fig. 5).
In a healthy brain Aβ40 represents about ~90% of all Aβ peptides. The production of Aβ42 is less with ~5-10% (Walsh et al., 2007). The accumulation and aggregation of these Aβ42 peptides is a major step in the formation of amyloid plaques (Iwatsubo et al., 1994). The ratio of Aβ42 to Aβ40 is used for diagnosis of AD (Haass et al., 2007).
The aggregation of Aβ leads to the generation of several intermediates like Aβ monomers.
These monomers are soluble and amphipathic with α-helical conformation mixture (Coles et al., 1998; Crescenzi et al., 2002). Aβ dimers have an hydrophobic core and are located intracellular in vivo (Roher et al., 1996). The small Aβ oligomers are thought to be cytotoxic compared to inert Aβ fibrils (Dahlgren et al., 2002; McLean et al., 1999; Cleary et al., 2005;
Lesne et al., 2006). Furthermore Aβ-peptides form Aβ-derived diffusible ligands (ADDLs) without fibrillar structure. These ADDLs are neurotoxic at a size of about 17 to 42 kDa (Chromy et al., 2003; Klein, Stine, and Teplow, 2004; Lambert et al., 1998). Especially the levels of ADDLs are linked to cognitive impairments of patients suffering from AD (Georganopoulou et al., 2005). Aβ protofibrils which have a rod-like and flexible structure display the precursors of Aβ fibrils (Harper et al., 1999; Arimon et al., 2005; Harper et al., 1997; Kheterpal et al., 2003; Walsh et al., 1997; Williams et al., 2005). These Aβ fibrils are insoluble and thermodynamically stable aggregates with a high content of β-sheets sheets (Ross and Poirier, 2005). The characteristic amyloid plaques are formed by extracellular aggregated Aβ fibrils (Muller-Hill and Beyreuther, 1989). As a defence mechanism plaques are beset with astrocytes, microglia and dystrophic dendrites (Selkoe, 2004).
Figure 5: Processing of the amyloid precursor protein (APP).
APP is a type 1 membrane protein and is cleaved by α- or β-secretase. In case of cleavage by the α-secretase sAPPα and C-terminal fragment C83 are generated. The γ-secretase cleaves C83 and P3 is produced. β- secretase cleaves APP releasing the sAPPβ and C99 is produced. γ-secretase degrades C99 leading to generation of Aβ40 and Aβ42 (modified Moll et al., 2011).
1.2.4. Degradation and clearance of amyloid-β
Aβ is transported and degraded out of the brain via a receptor-mediated process or by phagocytosis via macroglia. Insulin degrading enzyme (IDE), Neprilysin (NEP), endothelin converting enzyme (ECE) and angiotensin converting enzyme (ACE) are involved in degradation of Aβ. IDE is a mainly cytosolic, a 110kDa zinc metallo-endopeptidase which
C83 sAPPα
α-secretase
γ-secretase P3
β-secretase sAPPβ
γ-secretase
C99 Aβ40
Aβ42
APP
Extracellular
Intracellular
plays a role in degradation of different peptides like insulin, transforming growth factor α (TGFα), glucagon, Aβ and AICD (Duckworth et al., 1998).
It has been shown that IDE knockout mice display increased levels of endogenous Aβ and AICD in the brain which suggests a role of IDE in Aβ clearance (Selkoe, 2001; Farris et al., 2003). Consistently the overexpression of IDE in APPsw expressing mice showed a up to 50% reduction of Aβ plaques as well as reduction of Aβ40 and Aβ42 monomer levels.
Furthermore it has been shown that a polymorphism of IDE might be involved in late onset AD (Leissring et al., 2003; Bertram and Tanzi, 2004). The second enzyme facilitating Aβ degradation is NEP, a type 2 membrane protein with extracellular catalytic domain. The function of NEP is similar to the function of IDE. It degrades peptides like neuropeptide Y and ekephalin (Turner et al., 2001). Further studies showed that the intracerebral injection of a lentiviral vector transducing the human NEP gene in a transgenic mouse model of cerebral amyloidosis leads to an up to 50% reduction of cortical amyloid deposits (Marr et al., 2003).
The other pathway of Aβ clearance is the receptor-mediated transport across the blood brain barrier (BBB). This transport is promoted by low-density lipoprotein receptor-related protein (LRP) (Zlokovic, 2004). This transport requires the association of LRP to the LRP ligands apoE and α2Macroglobulin (α2M). After crossing the BBB Aβ is transported to peripheral tissue e.g. liver for degradation (Tanzi, Moir and Wagner, 2004).
The exact toxic effect of Aβ is still under investigation but might be promoted by the generation of membrane disruption, ion channel, induction of apoptosis, inflammation and oxidative stress (Hardy and Selkoe, 2002; Nakagawa et al., 2000; Soto, 2003; Roberson and Mucke, 2006).
1.2.5. Genetic risk factors of Alzheimer´s disease
The APP gene is located on chromosome 21 and patients suffering from trisomy 21 carrying an additional APP allel have an increased risk to develop Alzheimer´s disease. The duplication of the APP gene can cause Alzheimer-like pathologies, cerebral amyloid and angiopathy (Rovelet-Lecrux et al., 2006; Sleegers et al., 2006). Furthermore certain mutations (e.g. APPsw) in the APP gene are risk factors for developing Alzheimer´s disease.
Patients with these mutations suffer from so called early onset familial Alzheimer´s disease (Vassar, 2004; Bertram and Tanzi, 2005). In addition to alterations in the APP gene, mutations in presenilin 1 and presenilin 2 may result in familial early-onset AD as well (Tabaton et al., 2007; Sherrington et al., 1996; Tanzi et al., 1992; Schnellenberg et al., 1992;
Van Broeckhoven et al., 1992, St George-Hyslop et al., 1992; Rogaev et al., 1995). Early- onset AD usually starts to be symptomatic at the age of 43 to 62 years (Tanzi et al., 1987;
Campion et al., 1996; Goate, 1997). Mutations in the APP gene can cause changes in
processing of APP leading to higher Aβ generation. The presenilin 1 gene is located on chromosome 14 and it is part of the γ-secretase complex (1.2.3.). The detailed funtion of the transmembrane protein presenilin 1 is not completely understood. The homologue of presenilin 1 in C. elegans is SEL-12 (Van Broekhoven, 1995; Levitanand Greenwald, 1995).
SEL-12 plays a role during the development of C.elegans. The knockout of presenilin 1 gene in mice leads to impaired neurogenesis, neuronal cell death and developmental defects in skeletal formation. These mice die soon after birth (Wong et al., 1997; Shen et al., 1997).
Mutation of the presenilin 1 gene, a gain of function mutation causes up to 80% of familial AD. The presenilin 2 gene is located on chromosome 1 (Levy-Lahad et al., 1995). Mutations in this gene result in AD at the age of 40 to 88 years of age (Goate, 1997). Presenilin 1 and 2 present 67% homologeous sequence and might have similar functions but they are not able to compensate for each other. The mutations of these three genes cause an increased generation of the toxic Aβ42 (Jarrett et al., 1993; Duff et al., 1996; Scheuner et al., 1996;
Citron et al., 1997).
Furthermore certain variants of Apolipoprotein E (ApoE) increase the risk for AD. ApoE consists of three allelic forms ε2, ε3 and ε4. Allelic form ε2 is associated with the lowest risk for late onset Alzheimer´s disease (LOAD). In contrast ε4 increases the risk to develop LOAD up to 15-fold (Farrer et al., 1997). ApoE is involved in regulation of Aβ peptide levels in the brain and the allelic form ε4 might promote aggregation of Aβ by increasing the amount of Aβ40 and reducing Aβ clearance (Holtzman, 2001; Cedazo-Minguez, 2007).
1.2.6. IR/IGF-1R signaling in Alzheimer’s disease
Several clinical studies showed a link between AD and type 2 diabetes (Janson et al. 2004;
Ott et al. 1999; Stewart and Liolitsa 1999; Lovestone 1999). The association of impaired insulin secretion, glucose intolerance and the risk to develop AD was analysed in several studies (Ott et al. 1996; Luchsinger et al. 2004; Ronnemaa et al. 2008). In addition patients with AD have a higher probability to develop impaired glucose tolerance and type 2 diabetes (Janson et al. 2004).
The IR/IGF-1R signaling pathway is disprupted in the central nervous system of patients suffering from AD (Frolich et al. 1998; Frolich et al. 1999; Moloney et al. 2010). The measurement of mRNA levels of insulin and IR in the CNS of AD patients shows a reduction of 80% compared to healthy patients (Moloney et al. 2010; Rivera et al. 2005). Furthermore the IGF-1R expression is reduced in brains of patients with AD compared to controls (Moloney et al. 2010; Rivera et al. 2005). In contrast levels of IGF-1 in the serum of AD patients are increased which might indicate IGF-1 resistance in AD (Rivera et al. 2005; Vardy et al. 2007). Additionally the expression of IRS-1 and IRS-2 is lower in brains of AD patients
compared to healthy brains. The phosphorylation level of IRS-1 at Ser312 and Ser616 is increased as well. This inhibits the action of IRS-1 leading to an inactive IR/IGF-1R signaling pathway (1.1.2.). Because of these observations AD is also called “brain type” diabetes (Pilcher 2006). Until now it is not known whether this brain specific insulin and IGF-1 resistance is a cause or consequence of AD.
The knockout of IGF-1 in mice shows an increase of tau phosphorylation at Ser202 and Ser396 in the presence of unaltered tau expression (Cheng et al. 2005). The brain-specific knockout of the IR, called NIRKO mice, presents hyperphosphorylation of tau at Thr231 (Schubert et al. 2004). In contrast knockout of IRS-2 displays hyperphosphorylation at Ser202 (Schubert et al. 2003). These differences in phosphorylation of tau might indicate the requirement of other factors than insulin actively influencing tau phosphorylation e.g.
hyperglycemia or hyperinsulinemia (Freude et al., 2009).
Tg2576 mice are well established mice models of AD. These mice express the Swedish mutation of APP (APPsw) (Vassaret et al. 1999; De Strooper 2003; Holsinger et al. 2002;
Sinha et al. 1999; Harada et al. 2006). The knockout of IRS-2 (IRS-2-/-) or the neuron specific IGF-1R knockout (nIGF-1R-/-) in Tg2576 mice reduces or dealys Aβ accumulation and rescues these animals from premature death (Freude et al. 2009).
The clearance of Aβ is affected by the IR/IGF-1R signaling pathway. It has been shown that the IR/IGF-1R signaling pathway induces the expression of IDE, one of the major enzymes involved in Aβ degradation (Zhao et al. 2004).
1.2.7. FoxO action in Alzheimer’s disease
AD is linked to oxidative stress inducing activation of different signaling pathways and oxidative damage (Markesbery and Carney 1999; Beal 2002). Studies in a D. melanogaster AD model indicate that oxidative stress might be the main cause for neurodegeneration (Dias-Santagata et al. 2007). Oxidative stress is associated with increased JNK signaling which leads to insulin resistance (Ozcan et al. 2004). Activated JNK induces activation of the γ-secretase which in turn increases Aβ-peptide generation (Shen et al. 2008) and Aβ accumulation is linked to the formation of hydrogen peroxide (Tabner et al. 2005). The brains of patients with AD show an increased expression of nitric oxide synthase 1-3 and NADPH oxidase 1 and 3. These play a role in generation of reactive nitrogen and oxygen species (de la Monte and Wands 2006). Consistingly, AD brains display and increased lipid peroxidation (Montine et al. 2002).
Oxidative stress induces FoxO-mediated transcription of target genes like manganese superoxide dismutase (MnSOD) and MnSOD is involved in protection of the brain against oxidative stress in several tissues and cell types.
In C. elegans it has been shown that the knockdown of DAF-2, the orthologue of the mammalian IR and IGF-1R, decreases toxicity of Aβ42 (Cohen et al. 2006). DAF-16 and heat shock transcription factor 1 (HSF-1) both act downstream of the signaling pathway and are involved in the reduction of Aβ42 induced damage (Hsu, Murphy, and Kenyon 2003;
Birkenkamp and Coffer 2003; Cohen et al. 2006). A model of detoxification of Aβ42 contains two mechanisms: The first mechanism describes the function HSF-1 in disaggregation of neurotoxic Aβ-oligomers and degradation. The second mechanism predicts DAF-16 to regulate Aβ hyperaggregation because aggregates with high molecular weight are less toxic compared to low molecular mass aggregates with high toxicity (Fig. 6) (Cohen et al. 2006).
Further studied have shown Aβ hyperaggregation as a mechanism of Aβ detoxification in an IGF-1 resistant mouse model of AD (Cohen et al. 2009).
Figure 6: Aβ detoxification mechanism via HSF-1 and DAF-16
Aβ peptides form toxic aggregates with low molecular mass (5-I). Then aggregates are identified and disaggregated (5-II). The products become rapidly degraded (5-V). This mechanism is preferred and promoted by HSF-1 (5-A) and inhibited by DAF-2 (5-C). Whether this mechanism is overloaded a second mechanism promotes hyperaggregation to form high molecular mass aggregates with low toxicity (5-III). This mechanism is advanced by DAF-16 (5-B) and inhibited by DAF-2 (5-D). These high molecular mass aggregates can be disaggregated and degraded via the HSF-1 controlled mechanism (5-IV and 5-V) or are secreted to the extracellular matrix (5-Vi) (Cohen et al., 2006).
1.3. Mouse models
The current study analyses the role of FoxO1 in the neurodegenerative Alzheimer´s disease, because FoxO1 is strongly expressed in the hippocampus which is mainly affected by AD.
Therefore, influence of a constitutively active and the dominant negative form of FoxO1 in a mouse model of AD, Tg2576, was investigated. In order to achieve nerve specifity the Cre/loxP system under the neuron specific synapsin 1 promoter was used in the present study.
1.3.1. Constitutive active and dominant negative forms of FoxO1
The constitutive active form of FoxO1 displays mutations within the three AKT phosphorylation sites Thr24, Ser256 and Ser319 (Biggs et al., 1999; Brunet et al., 1999;
Kops et al., 1999; Rena et al., 1999; Tang et al., 1999). Thr24 is substituted by Ala24, Ser256 is replaced by Asp256 and Ser319 by Ala319. This form of FoxO1 is called FoxO1ADA and cannot be phosphorylated by AKT resulting in constitutively nuclear expression. The other form is a dominant negative variant of FoxO1 harbouring a deletion of the nuclear export signal and the transactivation domain. This form still binds to the traget promoter region, but cannot mediate transcription of its target genes and is called FoxO1∆256 or FoxO1DN.
To induce site specific DNA recombination the Cre/loxP system was used. This system was first described in the bacteriophage P1. Necessary for this system is the 34 bp DNA sequence with two 13 bp inverted repeats and the asymmetric 8 bp space region called locus of X-over in P1 (loxP). This sequence targets the site of recombination. In addition the Cre recombinase, a 343 amino acid monomeric protein, is required for this system. For the in vivo study mouse lines carrying the loxP site flanked stop cassette followed by the FoxO1 gene (FoxO1ADA or FoxO1DN) in the Rosa26 locus were used (Fig. 7). The other mouse lines encode the tissue or celltype specific Cre recombinase. In this study the Synapsin 1 promoter driven Cre recombinase was used.
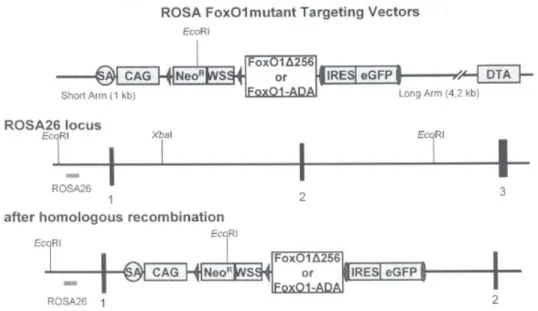
Figure 7: Cre/loxP targeting strategy for the FoxO1ADA and FoxO1DN expression in neurons.
The upper panel presents the ROSA FoxO1mutant targeting vector which contains the splice acceptor (SA), the pCMV promoter region (CAG), the loxP sites (tringles) flanked neomycin resistance gene (NeoR) and westphale stop cassette (WSS), the FoxO1 gene (FoxO1∆256 or FoxO1ADA) which are followed by the FRT site flanked internal ribosomal entry site (IRES) and enhanced green fluorescent protein (eGFP). After homologous recombination this region is inserted into the Rosa26 locus of the mouse model (lower panel).
1.3.2. Synapsin 1 promoter driven expression of the Cre recombinase
Synapsin is a neuronal phosphoprotein linked to the membrane of synaptic vesicles. It binds to the cytosceleton and is involved in the release of neurotransmitters. The protein family of synapsin is subdivided into four proteins. These result from alternative splicing of two genes (Sudhof et al., 1989). In contrast to other vesicle bound proteins synapsins are first peripheral proteins rather than integral membrane proteins and in non-neuronal tissue no homologoues proteins occur. This indicates that synapsin proteins are neuron specific. In a previous study it has been shown that the injection of synapsin 1 into Xenopus blastomeres promotes the development of neuromuscular synapses (Lu et al., 1992; Valtorta et al., 1995).
Another study concerning the function of synapsin 1 showed that embryonic hippocampal neurons of synapsin 1-deficient mice present an outgrowth of predendritic neurites and retarded axons. In addition the formation of synapses was delayed. These results show evidence for the role of synapsin I in axogenesis and synaptogenesis (Chin et al., 1995). The previous use of synapsin 1 promoter driven Cre recombinase (SynCre) in mouse models revealed an expression pattern of the Cre recombinase in cortical and spinal cord neurons as well as high expression in the hippocampus (Zhu et al., 2001). Because of this predominant expression in the hippocampus the synapsin 1 promoter driven Cre recombinase is a useful model to generate neuronal specific expression of the gene of interest.