F O R A D VA N C I N G S N O W A N D I C E C L O U D O B S E R VAT I O N S
i n a u g u r a l – d i s s e r t a t i o n z u r
e r l a n g u n g d e s d o k t o r g r a d e s
d e r m at h e m at i s c h - nat u r w i s s e n s c h a f t l i c h e n f a k u ltät d e r u n i v e r s i tät z u k ö l n
v o r g e l e g t v o n M A X I M I L I A N M A A H N
au s b e r g i s c h g l a d b a c h
k ö l n , 2 0 1 5
PD Dr. Ulrich Löhnert Prof. Dr. Roel Neggers
Prof. Dr. Herman Russchenberg
ta g d e r m ü n d l i c h e n p r ü f u n g :
14 . 01 . 2015
a b s t r a c t 5
z u s a m m e n f a s s u n g 6 A i n t r o d u c t i o n 9 1 m o t i vat i o n 11
2 ov e r v i e w o f t h e s t u d i e s 17
2 . 1 Publication I: Improved Doppler spectra processing 17 2 . 2 Publication II: Exploring radar-based snowfall statistics 18 2 . 3 Additional Study I: Spectral radar simulator 19
2 . 4 Publication III: Ice cloud parameterizations 20 2 . 5 Additional Study II: Retrieval potential 21 2 . 6 Outline 22
3 t h e o r y 23
3 . 1 Ice and snow particles in the atmosphere 23 3 . 2 Scattering properties of ice and snow particles 29 3 . 3 Observing ice and snow crystals with radars 32 B k e y i s s u e i : e n h a n c e d s n o w f a l l o b s e r vat i o n s 37
4 p u b l i c at i o n i : i m p r ov e d d o p p l e r s p e c t r a p r o c e s s i n g 39 5 p u b l i c at i o n i i : e x p l o r i n g r a d a r - b a s e d s n o w f a l l
s ta t i s t i c s 55
5 . 1 Supporting Information to Publication II 74 C k e y i s s u e i i : e x p l o i t i n g h i g h e r m o m e n t s 77 6 a d d i t i o na l s t u d y i : s p e c t r a l r a d a r s i m u l at o r 79
6 . 1 Introduction 79 6 . 2 Model structure 79 6 . 3 Conclusions 85
7 p u b l i c at i o n i i i : i c e c l o u d pa r a m e t e r i z at i o n s 87 8 a d d i t i o na l s t u d y i i : r e t r i e va l p o t e n t i a l 111
8 . 1 Introduction 111 8 . 2 Response functions 112
8 . 3 Degrees of freedom for signal 120 8 . 4 Summary and discussion 127 D d i s c u s s i o n a n d o u t l o o k 131 9 d i s c u s s i o n o f t h e s t u d i e s 133
9 . 1 Publication I: Improved Doppler spectra processing 133 9 . 2 Publication II: Exploring radar-based snowfall statistics 135 9 . 3 Additional Study I: Spectral radar simulator 138
9 . 4 Publication III: Ice cloud parameterizations 139
9 . 5 Additional Study II: Retrieval potential 143
10 o u t l o o k 147
10 . 1 Key Issue I: Enhanced snowfall observations 147 10 . 2 Key Issue II: Exploiting higher moments 147 a b b r e v i at i o n s 151
s y m b o l s 153
b i b l i o g r a p h y 157
Ice and snow particles play a key role in the atmosphere of the Earth and affect—among others—cloud physics and radiative properties, precipitation, and surface albedo. As a consequence, ice and snow have major impact on weather and climate. However, in situ observa- tions of ice clouds and snowfall are difficult and sparse. This leads to a great potential of remote sensing, which can provide observations at high temporal and spatial resolutions. Among the various types of re- mote sensing instruments, ground-based vertically pointing Doppler radars are one of the most promising concepts: Doppler radars are the only instruments which can penetrate also optically thick clouds and, at the same time, are capable of measuring the fall velocity of hydrometeors. However, the observables of Doppler radars are only indirectly linked to cloud and precipitation properties. The required transfer functions are not uniquely defined resulting in substantial uncertainties of radar-based ice cloud and snowfall retrievals.
In the context of studying ice and snow with radars, this study investigates two key issues: (I) the need for additional snowfall mea- surements with radar and (II) the potential of higher moments of the radar Doppler spectrum for observing ice cloud properties.
To address Key Issue I, an improved spectral processing scheme for the MRR, a compact precipitation Doppler radar, is introduced.
The scheme significantly enhances the radar sensitivity and allows observations of snowfall profiles (Publication I). One year of MRR ob- servations from three polar sites in East Antarctica and Svalbard are investigated with respect to changes of snowfall within the vertical column (Publication II). The transformation found is used for assess- ing the snowfall measurement uncertainties of the radar onboard the CloudSat satellite which is the only source of global snowfall estimates. However, the lowest 1200 m above the surface are contami- nated by ground clutter so that the measurements cannot be exploited (blind zone). The analysis shows that snowfall amount is underesti- mated when using CloudSat. Also, a blind zone reduced by 50 % does not improve the snowfall estimation in all aspects.
For Key Issue II, the potential of higher moments for observations
of ice cloud properties, an advanced radar simulator capable of sim-
ulating the full Doppler radar spectrum is developed (Additional
Study I). The radar simulator is used to forward model in situ aircraft
observations of stratocumulus ice clouds obtained during the ISDAC
campaign in Alaska (Publication III). The combination of in situ data
and ground-based radar observations with the 35 GHz MMCR radar
in Barrow, Alaska, is used to develop a novel method for deriving
temperature-dependent particle mass-size relations. Subsequently, the impact of replacing measurements by various parameterizations is in- vestigated for projected particle area and particle size distribution. For this, moments of the radar Doppler spectrum of the MMCR are sta- tistically compared to forward modeled ISDAC data. It is found that the use of higher moments of the Doppler spectrum such as skewness and kurtosis as well as the slopes of the Doppler peak gives addi- tional information when identifying the parameterization methods which lead to most consistent results. Radar-based ice cloud retrievals are often underdetermined and additional observables are desirable.
The potential of increasing the number of observables using higher
moments and slopes is evaluated based on the developed forward
model, parameterizations, and coefficients (Additional Study II). An
idealized retrieval based on simulated measurements is successfully
developed for moderate turbulence levels. Retrieved are parameters
describing particle mass, area, and size distribution. It is shown that a
retrieval including higher moments and the slopes provides a higher
number of degrees of freedom for signal than a dual-frequency re-
trieval based on the conventional moments such as radar reflectivity
factor and mean Doppler velocity. This highlights the great potential
for enhancing observations of ice clouds with higher radar moments.
Eis- und Schneepartikel spielen in der Erdatmosphäre eine Schlüs- selrolle. Sie beeinflussen Prozesse und Strahlungseigenschaften von Wolken, Niederschlag und die Oberflächenalbedo, wodurch sie we- sentlichen Einfluss auf Wetter und Klima haben. Allerdings sind in situ Messungen von Eiswolken und Schneefall schwierig und sel- ten. Hieraus ergibt sich ein großes Potential von Fernerkundungsver- fahren, die kontinuierliche Beobachtungen bei hohen zeitlichen und räumlichen Auflösungen liefern können. Unter den verschiedenen Fer- nerkundungsverfahren, sind vertikal ausgerichtete, bodengebundene Dopplerradare besonders hervorzuheben: Sie sind das einzige Instru- ment das sowohl durch optisch dicke Wolken hindurch schauen kann als auch die Fallgeschwindigkeit von Hydrometeoren messen kann.
Die Beobachtungsgrößen von Dopplerradaren sind jedoch nur indi- rekt mit Eigenschaften von Eiswolken und Niederschlag verbunden, was zu erheblichen Unsicherheiten bei der Anwendung von radarba- sierten Retrievals führt.
In diesem Zusammenhang werden in dieser Arbeit zwei Schwer- punkte untersucht: (I) die Notwendigkeit von zusätzlichen Beobach- tungen von Schneefall mittels Radars und (II) das Potential höherer Momente des Radardopplerspektrums für die Beobachtung mikro- physikalischer Eigenschaften von Eiswolken.
Zur Behandlung von Schwerpunkt I wird ein verbessertes, spek- trales Prozessierungsverfahren für MRR, ein kompaktes Dopplerra- dar, vorgestellt. Das neue Verfahren verbessert die Sensitivität des Radars deutlich und erlaubt die Aufzeichnung von vertikalen Schnee- fallprofilen (Publikation I). Es werden jeweils zwölfmonatige MRR Beobachtungen von drei polaren Stationen in der Ostantarktis und auf Spitzbergen auf vertikale Veränderungen des Schneefallprofils untersucht. Die Ergebnisse werden verwendet, um auf die Unsicher- heit von Schneefallmessungen mit dem Radar des CloudSat Satelliten zurückzuschließen (Publikation II). CloudSat kann zwar als einziges Instrument globale Beobachtungen von Schneefall aufzeichnen, je- doch sind die untersten 1200 m der Atmosphäre durch Festechos der Erdoberfläche kontaminiert und können nicht verwendet werden. Es wird gezeigt, dass dies die mittels CloudSat beobachtete Schneefall- menge verringert und dass selbst eine Reduzierung des von Festechos betroffenen Höhenbereichs um 50 % solche Fehler nicht vollständig beheben würde.
Für Schwerpunkt II, das Potential höherer Momente zur Beobach-
tung von Eiswolkeneigenschaften, wird ein fortschrittlicher Radar-
simulator entwickelt, der auch vollständige Dopplerspektren simu-
lieren kann (Weiterführende Studie I). Der Radarsimulator wird be- nutzt, um in situ Flugzeugbeobachtungen von Stratocumulus-Eiswol- ken zu simulieren, die während der ISDAC Kampagne in Alaska aufgezeichnet wurden (Publikation III). Die Kombination von Flug- zeugdaten und Beobachtungen des 35 GHz MMCR Radars in Barrow, Alaska, wird verwendet, um eine neuartige Methode zur Bestimmung temperaturabhängiger Massen-Größen Verhältnisse für Eispartikel zu entwickeln. Im nächsten Schritt werden Messungen von projizierter Partikelfläche und Partikelgrößenverteilung durch geeignete Parame- trisierungen ersetzt und die Veränderung untersucht. Dazu werden die vorwärts modellierten Flugzeugmessungen mit MMCR Beobach- tungen statistisch verglichen. Es wird gezeigt, dass höhere Momen- te der Dopplerspektren, wie Schiefe und Wölbung sowie die linke und rechte Steigung des Dopplerpeaks, zusätzliche Informationen für die Bestimmung der geeignetsten Parametrisierungen liefern kön- nen. Radarbasierende Retrievals sind häufig durch den Mangel an Messgrößen unterbestimmt. Um zu untersuchen ob höhere Momente und Steigungen als zusätzliche Messgrößen für Retrievals geeignet sind, werden die hier entwickelten Parametrisierungen, Koeffizienten und das Vorwärtsmodel verwendet (Weiterführende Studie II). Für moderate Turbulenzbedingungen kann ein idealisiertes Retrieval für Parameter zur Beschreibung von Partikelmasse, -fläche und -größen- verteilung erfolgreich entwickelt werden. Die Ergebnisse zeigen, dass Retrievals, welche höhere Momente und Steigungen verwenden, mehr Freiheitsgrade erfassen können als Retrievals, welche zwei verschie- dene Frequenzen, jedoch nur die herkömmlichen Momente, Radar- Reflektivitätsfaktor und mittlere Dopplergeschwindigkeit, verwenden.
Dies unterstreicht das große Potential von höheren Momenten für ver-
besserte Beobachtungen von Eiswolken.
I N T R O D U C T I O N
1
M O T I VAT I O N
Ice plays a key role in the Earth’s atmosphere. While ice crystals are, as the name implies, single crystals, aggregates of thousands of ice crystals are called snow crystals or snowflakes (AMS, 2014 ). In prac- tice, it is usually assumed that ice clouds consist mainly of suspended ice crystals while snowflakes precipitate out of clouds (Waliser et al.,
2009 ). However, this categorization of frozen hydrometeors into two
In this thesis, frozen water within ice or mixed phase clouds is termed ice and precipitating particles are termed snow. SeeSchmitt and Heymsfield (2014) for an alternative definition.species is to a certain extent artificial (Schmitt and Heymsfield, 2014 ), be- cause there is no clear separation between ice and snow with respect to fall velocity and even the smallest ice crystals sediment, albeit very slow. At the same time, it is also possible to find aggregated crystals within ice clouds (e. g., Brown and Francis, 1995 ; Korolev et al., 1999 ) and single, unaggregated ice crystals can be observed as precipitation falling to the surface in very cold conditions (e. g., Magono and Lee, 1966 ; Hogan, 1975 ).
Independent of the precise discrimination, both hydrometeor spe- cies play a key role in the climate system. With a global mean snow- fall rate of 0 . 28 mm h
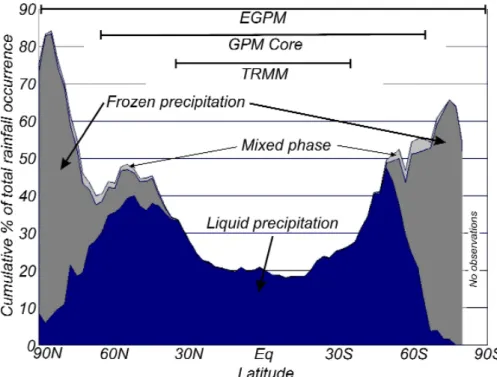
−1(Kulie and Bennartz, 2009 ), snowfall is a crucial component of the atmospheric water cycle contributing to the major- ity of precipitation in high latitudes (Figure 1 ) and acting as a source for glaciers and ice shields. Also rainfall is mostly initiated via the ice phase in mid- and high latitudes: Löhnert et al. ( 2014 ) found that the ice phase was involved for 97 % of the total precipitation amount for a mid-latitude site in Germany. In addition, snowfall and precipitation in general are an important freshwater input into the oceans influenc- ing ocean surface buoyancy and deep water formation (Liu and Curry, 1997 ). At the land surface, snow can have major impact on society by influencing e. g., traffic (Call, 2011 ) and winter recreation (Rutty and Andrey, 2014 ). From a meteorological perspective, snow has a major impact on the albedo of the Earth (Vavrus, 2007 ; Waliser et al., 2011 ) which is one of the most important feedback mechanism for global climate (Hall, 2004 ). Similarly, ice clouds influence the albedo by shortwave reflective cooling, but at the same time, they also emit longwave radiation back to the Earth’s surface and contribute to the greenhouse warming. Recent studies indicate that for high ice clouds, the latter effect outweighs the other (IPCC, 2014 , FAQ 7 . 1 ).
Despite their importance, many processes related to ice clouds and
snowfall are not yet fully researched. Apart from the exact determina-
tion of the influence of ice clouds on the radiation budget (Shupe and
Intrieri, 2004 ), the development of the various crystal shapes as a func-
tion of temperature and supersaturation is not yet fully understood
Figure 1 : Mean zonal occurrence of oceanic light precipitation (as a percent- age of total rainfall occurrence) derived from the Comprehensive Ocean-Atmosphere Data Set using ship-borne meteorological ob- servations ( 1958 - 1991 ). Source:
ESA(
2004) cited in
Levizzani et al.(
2011).
(Libbrecht, 2005 ). Furthermore, the processes relating snowfall to sur- face deposition are difficult to quantify, especially at high latitudes (Lenaerts et al., 2012 ).
Due to the complexity even at very small scales, the representa- tion of ice (Eliasson et al., 2011 ) and snowfall (Adams, 2004 ; Thompson et al., 2004 ) in Numerical Weather Prediction (NWP) models and Global Climate Models (GPM) leaves room for improvement (Li et al., 2005 , 2007 ) which causes large uncertainties also with respect to future cli- mate change (IPCC, 2014 , p. 743 ). One of the main reasons is that most cloud related processes require parameterizations, because they cannot be resolved by the model and are sub-scale (Arakawa, 2004 ).
In addition, the complex interactions between aerosols and hydrom- eteors are not yet fully understood and most NWP models contain no more than three idealized species of frozen hydrometeors (cloud ice, snow, and graupel). For these, bulk microphysical models are used with empirical parameterizations. These cannot resolve pro- cesses depending on particle habit or size because only one moment of the particle size distribution is taken into account. Two moment
The moment treated by one-moment schemes is usually hydrometeor content as mixing ratio.
schemes (e. g., Seifert and Beheng, 2006 ) or even full bin microphysics
(e. g., Lynn et al., 2005 ) have only recently been developed due to the
larger computational costs.
More and improved observations are essential for increasing the understanding of ice and snow, but their observation is particularly difficult. Traditionally, precipitation gauges are used for measuring snowfall, but they are especially affected by biases induced by wind undercatch and blowing snow (Yang et al., 2005 ; Knuth et al., 2010 ; Thériault et al., 2012 ). In addition, there are only few surface observa- tions of precipitation available at high latitudes and measurements are almost completely missing over sea or over the ice shields (Schnei- der et al., 2014 ). For ice clouds, in situ observations are even more sparse, because they are only possible on exposed locations such as high mountains (Matrosov et al., 2001 ; Krüger et al., 2014 ) and during aircraft campaigns (e. g., Verlinde et al., 2007 ; McFarquhar et al., 2011 ; Schmid et al., 2014 ). However, in situ aircraft measurements require a lot of resources and hence cannot provide long term observations.
At the same time, there are still major problems with the quality of ice clouds measurements (Baumgardner et al., 2012 ), e. g., due to shat- tering of the ice crystals at the inlets of the in situ probes (Field et al., 2006 ).
This gap in observations can be partly closed using remote sens- ing. Especially satellite-based observations can provide homogeneous, globally available products of precipitation and cloud properties over long time spans (Levizzani et al., 2007 , 2011 ), but also airborne and ground-based remote sensing instruments are frequently used. Re- mote sensing techniques can be classified either by active and passive measurement principles or by the used frequency range. Numerous techniques exist for observing snow and ice using passive sensors in the visible/infrared frequency range from space (e. g., Yang et al., 2007 ; Stengel et al., 2014 ) as well as from the ground (Knuteson et al., 2004 ). Also instruments operating in the microwave-range are used from space (e. g., Weng and Grody, 2000 ; Sun and Weng, 2012 ) and from from the ground (e. g., Kneifel et al., 2010 ; Kneifel, 2011 ; Xie et al., 2012 ).
Even though passive sensors cannot provide vertically resolved obser- vations, they are available on multiple spacecrafts for several decades.
This allows for investigation of long-term data sets (Knapp et al., 2011 ) and for operational assimilation into NWP models (Hou et al., 2001 ).
Profile information of ice clouds can only be obtained from active
sensors such as radar (radio detection and ranging) and lidar (light
detection and ranging) instruments. While the former is able to com-
pletely penetrate ice and mixed phase clouds as well as snowfall,
lidars are heavily attenuated by liquid layers and cannot penetrate op-
tically thick clouds. Such layers are frequently found in clouds even
below the melting points (Hu et al., 2010 ). Nevertheless, lidars are
successfully used for investigating pure ice clouds from space (Winker
et al., 2009 ) and from the ground (Sassen, 1991 ), partly also in com-
bination with radars (Delanoë and Hogan, 2008 ; Battaglia and Delanoë,
2013 ).
The ability to penetrate also optically thick ice and snow clouds makes radar observations unique. Quantitative and qualitative snow- fall measurements using operational, ground-based weather radar networks have recently been enhanced with the advent of polarized radars, which can estimate the particle shape by the difference be- tween horizontally and vertically polarized reflectivity (Kennedy and Rutledge, 2011 ). Unfortunately, weather radar observations are only available in the densely populated parts of the developed world, be- cause their operation is costly. In addition, the sensitivity of weather radars operating at centimeter wavelengths is not sufficient for study- ing ice clouds, hence millimeter wavelengths need to be used for studying clouds. As a drawback, attenuation is stronger at millimeter wavelengths which limits the range of cloud radars (Lhermitte, 1987 ).
CloudSat cannot observe precipitation at latitudes higher than82◦due to the inclination of its orbit.
The most important millimeter cloud radar is probably the one on- board the CloudSat satellite (Stephens et al., 2002 , 2008 ) which was launched in 2006 and allowed for the first time near-global estimates of snowfall (Liu, 2008 a) filling the gaps of traditional snowfall obser- vations. CloudSat, however, cannot measure lower than 1200 m above the surface due to contamination with ground clutter (blind zone).
Remote sensing observations are per se indirect, i. e., the obser- vation quantities (e. g., brightness temperature, reflectivity) are not directly connected to the desired meteorological quantities (e. g., ice water content, number of particles). Thus, retrieval techniques are required using forward operators and prior knowledge. These re- trievals are usually underdetermined, which means that not sufficient information is measured by the radar in order to determine the atmo- spheric state unambiguously. One reason is that radar observations depend heavily on particle type, projected area, effective density and size distribution. Especially the effective particle density (which de- pends on particle mass) has a great impact on radar observations and many retrieval products require either prior knowledge of par- ticle mass (Posselt and Mace, 2014 ) or use it as a tuning parameter (Matrosov, 1998 ).
To increase the number of observables, multiple frequencies can be combined (Sekelsky et al., 1999 ; Hogan et al., 2000 ; Kulie et al., 2014 ) exploiting the strong dependence of differential radar reflectivity on particle shape (Kneifel et al., 2011 a). Other studies propose to use combinations of several remote sensing instruments exploiting dif- ferent measurement principles, such as radar-microwave radiometer (Grecu and Olson, 2008 ; Löhnert et al., 2008 ; Posselt and Mace, 2014 ) or lidar-radar combinations (Intrieri et al., 1993 ; Delanoë and Hogan, 2008 ).
However, when combining different frequencies and/or measurement
principles, their different measurement volumes and temporal reso-
lutions have to be taken into account. Otherwise, the different in-
struments might observe different parts of the cloud with different
properties which can lead to large retrieval errors.
Another option to exploit additional information, but without us- ing additional instruments, is to use not only reflectivity, but also other moments of the Doppler spectrum of vertically pointing radars.
The mean Doppler velocity corresponds—in the absence of vertical
air motion—to the reflectivity weighted mean fall velocity. This can
be exploited for constraining ice cloud microphysical properties (Ma-
trosov et al., 2002 ; Szyrmer et al., 2012 ). Other studies propose to use
the second moment, i. e., Doppler spectrum width (Mace et al., 2002 ;
Deng and Mace, 2006 ), which describes the standard deviation of the
Doppler spectrum. While even higher radar moments such as skew-
ness and kurtosis have been used to separate cloud drops from drizzle
(Kollias et al., 2011 ) and for locating supercooled liquid water (Shupe
et al., 2004 ; Luke et al., 2010 ), no studies so far investigated the use of
higher moments for studying ice clouds. An alternative to the use
of radar moments is to exploit the full Doppler spectrum, but for
ice clouds this was so far only applied to case studies (Dufournet and
Russchenberg, 2011 ; Verlinde et al., 2013 ).
2
O V E R V I E W O F T H E S T U D I E S
In the context of studying ice and snow with cloud radars, this study investigates two key issues in greater detail (Figure 2 ): (I) the need for Enhanced snowfall observations with radar and (II) the development, assessment, and retrieval of ice cloud parameterizations Exploiting higher moments of the radar spectrum.
To address Key Issue I, an enhanced spectral processing routine for snow observations with a small precipitation radar is introduced in Publication I. This method is used to investigate the vertical variability of snowfall at polar sites in order to asses the impact of the blind zone of the Cloudsat satellite (Publication II).
For Key Issue II, an advanced radar simulator capable of simulating the full radar spectrum and higher moments is developed and pre- sented in Additional Study I. The radar simulator is used to forward model in situ aircraft observations in order to asses ice cloud param- eterizations in Publication III. For particle mass, a novel method is developed to derive the mass-size relation from the functional relation between reflectivity and mean Doppler velocity. To evaluate parame- terizations of projected area and particle size distribution, additional, higher moments of the radar Doppler spectrum are exploited which have not been used before for observations of ice clouds. Then, in Additional Study II, the potential of these higher radar moments for enhancing ice cloud retrievals is investigated based on the data set obtained in Publication III.
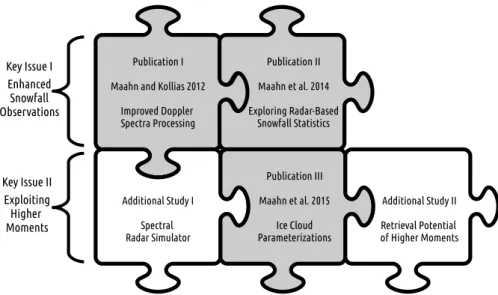
Figure 2 depicts how the five studies of this thesis are linked to- gether. In the following, they are briefly introduced.
2 . 1 p u b l i c at i o n i : i m p r ov e d d o p p l e r s p e c t r a p r o c e s s i n g
In Publication I (Maahn and Kollias, 2012 ), an enhanced Doppler spec-
tra processing scheme for Micro Rain radars (MRR) is developed in
order to allow observations of snowfall. The MRR is a light-weight,
low-cost, 24 GHz Frequency Modulated Continuous Wave (FCMW) radar
(Klugmann et al., 1996 ). Even though the hardware specifications and
the low power consumption make MRR well-suited for observations
in remote areas, its observations are restricted to rain due to software
limitations: designed as a zenith-pointing profiler, MRR estimates rain
rates by converting the radar Doppler spectrum into the drop size dis-
tribution N(D) (Atlas et al., 1973 ; Peters et al., 2005 ) using a raindrop
size-fall velocity (D − v) relation (Gunn and Kinzer, 1949 ). While this
works well in the absence of vertical air motions (Peters et al., 2002 ,
Publication I Maahn and Kollias 2012
Improved Doppler Spectra Processing
Publication II Maahn et al. 2014 Exploring Radar-Based
Snowfall Statistics
Additional Study I Spectral Radar Simulator
Publication III Maahn et al. 2015
Ice Cloud Parameterizations
Additional Study II Retrieval Potential of Higher Moments Key Issue I
Enhanced Snowfall Observations
Key Issue II Exploiting Higher Moments
Figure 2 : Structure of the thesis with publications (gray) and additional stud- ies (white).
2005 ), precipitation rates are biased for snow for two reasons which are not taken into account: (a) the D − v relation is different and (b) the dielectric constant is smaller for ice than for liquid water in the microwave region. Even though (b) is partly compensated by the larger size of snowflakes in comparison to equally heavy rain drops, (a) leads to a strong overestimation of precipitation rates in the case of snow. Unfortunately, the MRR standard software does not record the measured equivalent radar reflectivity factor Z
eso that Z
ecan- not be used as an alternative to study snowfall. Instead, the radar reflectivity factor Z is estimated from N(D) assuming rain and Mie scattering. Kneifel et al. ( 2011 b) presented an alternative method to estimate Z
edirectly from MRR’s processed Doppler spectrum, but also stated that an increase of the found MRR sensitivity of 3 dBz is required to capture a greater number of snow events. This requires
IMProToo is available under an open source license athttp://gop.meteo.
uni-koeln.de/
software.
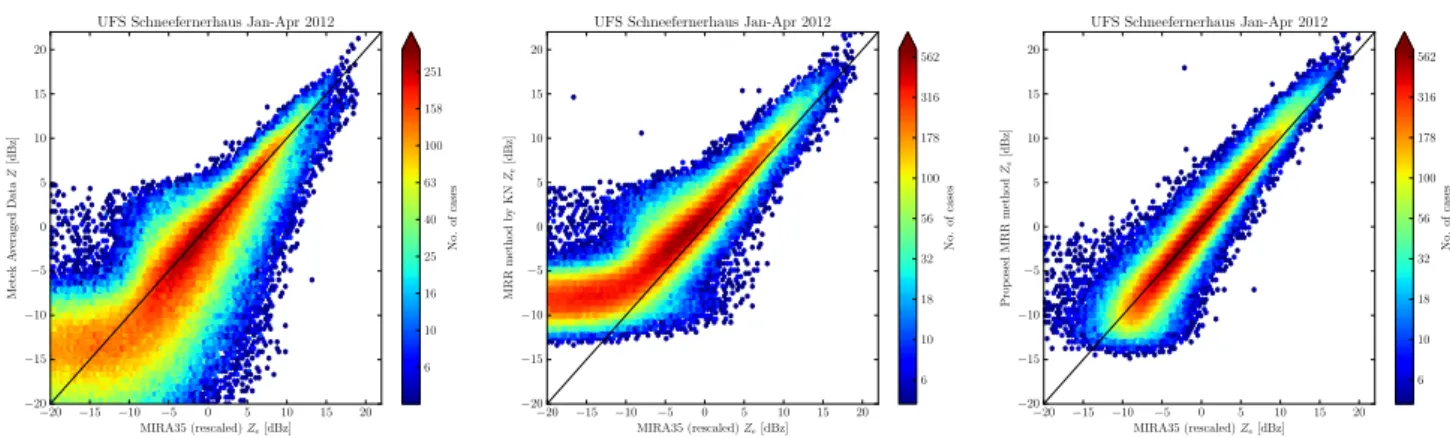
the development of a novel radar processing scheme (Improved Mrr PROcessing TOOl – IMProToo) based on MRR raw data which is pre- sented in Publication I and which enhances the MRR sensitivity. To validate the processing scheme and to show the potential of MRR for snow observations, four months of MRR observations obtained at the Umweltforschungsstation Schneefernerhaus (UFS) in the Bavarian Alps are compared to co-located observations of a pulsed 35 GHz cloud radar.
2 . 2 p u b l i c at i o n i i : e x p l o r i n g r a d a r - b a s e d s n o w f a l l s ta - t i s t i c s
An application of the scheme developed in Publication I is presented
in Publication II (Maahn et al., 2014 ): in this study, MRRs are used
to investigate vertical changes of snowfall in polar regions within
the so-called blind zone of the radar onboard the CloudSat satellite.
CloudSat is part of a constellation of six Earth observation satellites flying in matched orbits (A-train, L’Ecuyer and Jiang, 2010 ). It carries a cloud radar operating at 94 GHz (λ = 3 . 2 mm) which is designed for global cloud studies (Stephens et al., 2008 ; Tanelli et al., 2008 ). To gain a sufficiently high sensitivity for observation of clouds despite Cloud- Sat’s distance to the surface of 705 km to 730 km without exceeding available power or demanding a large antenna, CloudSat uses a long pulse length of 480 m. Oversampling is used to achieve the final ver- tical resolution of 240 m. The long pulse leads to a complete loss of information within the first 750 m of the atmosphere. The first range gate free of ground clutter is found to be at 1200 m above ground level (agl) (Marchand et al., 2008 ). In the case of complex orography, the blind zone might even be larger.
Even though designed to study clouds, CloudSat is increasingly used to study snowfall as well; it is the first and only instrument allowing to derive near-global snowfall climatologies (Liu, 2008 a; Kulie and Bennartz, 2009 ; Levizzani et al., 2011 ; Palerme et al., 2014 ). In contrast to rain, attenuation and multi-scattering do not severely affect the observations of snow and even partly cancel each other out (Matrosov and Battaglia, 2009 ). Recently, an official CloudSat snow product was released (2C-SNOW-PROFILE Wood, 2011 ; Wood et al., 2013 ). These climatologies and products are, however, based on observations above the blind zone assuming that statistics of snowfall do not change while falling toward the surface. The question whether this assumption generally holds true is still open. Some studies find a general increase of radar reflectivity due to aggregation and depositional growth (Fabry and Zawadzki, 1995 ; Liu, 2008 a; Matrosov and Battaglia, 2009 ; Wolfe and Snider, 2012 ) while other studies find radar reflectivity to be nearly constant in the lowest 2 km (Stewart et al., 2004 ; Henson et al., 2011 ).
In Publication II, one year of MRR observations from the Belgian Princess Elisabeth station in East-Antarctica (Gorodetskaya et al., 2015 ) and from two sites in Svalbard, Norway (Ny-Ålesund and Longyear- byen Maahn, 2010 ) are analyzed with respect to changes of the vertical profile of snowfall observations within the blind zone of CloudSat.
2 . 3 a d d i t i o na l s t u d y i : s p e c t r a l r a d a r s i m u l at o r
Instrument simulators for remote sensing are essential for sensitiv-
ity studies and retrieval developments. To be able to simulate active
sensors as well, the PAssive Microwave radiative TRAnsfer model (PAM-
TRA) developed at University of Cologne is extended by an advanced
active component (now called: Passive and Active Microwave radiative
TRAnsfer model) and presented in Additional Study I. The radar sim-
ulator extends PAMTRA by using the scattering properties of frozen
or liquid hydrometeors to simulate the full, polarized radar Doppler
spectrum. To estimate the moments of the radar Doppler spectrum, the methodology presented in Publication I is used. Due to the new ac- tive part, passive and active instruments can be simulated at the same time allowing the development of joint radar-microwave radiome- ter products. In contrast to other combined instrument simulators, PAMTRA is not tailored to a specific mission and can be adapted to diverse instrument specifications. Due to the flexible implementation of hydrometeors, PAMTRA can handle an arbitrary number of liquid and frozen hydrometeors described by discretized distributions of hydrometeor properties or moments of the distribution. This makes coupling with various NWP models, GCMs or in situ measurements simple.
2 . 4 p u b l i c at i o n i i i : i c e c l o u d pa r a m e t e r i z at i o n s
In Publication III (Maahn et al., 2015 ), the PAMTRA model introduced in Additional Study I is used to forward model in situ ice cloud ob- servations obtained from aircrafts during the Indirect and Semi-Direct Aerosol Campaign (ISDAC). ISDAC took place in the vicinity of the Mil- liMeter wavelength Cloud Radar (MMCR, Moran et al., 1998 ) at the At- mospheric Radiation Measurement (ARM) climate research facility North Slope of Alaska (NSA) in Barrow. The MMCR data is processed fol- lowing the methodology proposed in Publication I. Currently, ISDAC is the only available data set obtained in the vicinity of a vertically pointing Doppler cloud radar which contains ice cloud observations measured by in situ probes using the new, enhanced design of the probe tips (Korolev et al., 2013 ).
One of the main challenges of radar observations of ice clouds is that the observables are not directly confined to the cloud properties.
As a consequence, retrieval techniques are required which for their part require analytical descriptions of the cloud microphysics. Such parameterizations are also essential for NWP models and GCMs. Tak- ing up on on the importance of parameterizations, two main objectives are studied in Publication III.
( 1 ) a novel method to estimate the mass-size relation m(D) is devel- oped using a combination of radar and in situ aircraft observations.
Particle mass cannot be measured directly by aircraft in situ probes and measurements with ground-based instruments are challenging.
At the same time, the scattering properties of ice crystals depend heav- ily on particle mass, so that a wrong parameterization of particle mass can lead to large errors. Because both, particle habit and mass-size relation, depend on ambient temperature, the data set is divided into different temperature intervals and analyzed separately.
( 2 ) the effect of describing projected area A(D) and particle size
distribution N(D) by various analytical expressions on forward mod-
eling of radar observations is investigated. For this, also the higher
moments of the radar Doppler spectrum (skewness and kurtosis) as well as the slopes of the Doppler peak are used. The higher moments and the slopes have not been exploited before for ice cloud observa- tions. For projected area, power laws are mostly used, and a large variety of parameterizations has been proposed for the particle size distribution. These parameterizations are evaluated by replacing mea- sured projected area and particle size distribution with parameterized versions.
Both objectives together lead to a consistent, joint data set of ISDAC and MMCR observations containing coefficients to describe particle mass, projected area, and particle size distribution as functions of size as well as the corresponding analytical expressions. For liquid water clouds it was found that such prior information has great impact on retrieval accuracy (Ebell et al., 2010 ). Together with the PAMTRA forward operator, Publication III sets the stage for developing ice cloud retrievals based on the climatology obtained during ISDAC which exploit not only lower, but also higher radar moments.
2 . 5 a d d i t i o na l s t u d y i i : r e t r i e va l p o t e n t i a l
In Additional Study II, the forward model of Additional Study I, which includes the radar processing scheme of Publication I, and the data set developed in Publication III are combined to investigate the potential of higher radar moments for retrieval applications.
Until today, ice cloud retrievals have exploited only radar reflec- tivity Z
e, mean Doppler velocity W (Matrosov et al., 2002 ; Szyrmer et al., 2012 ) and—in some cases—spectrum width σ (Mace et al., 2002 ; Deng and Mace, 2006 ). The use of skewness Sk , kurtosis Ku and the left and right slopes S
land S
rhas not yet been evaluated and the full Doppler spectrum was only investigated for case studies (Verlinde et al., 2013 ). However, additional information is an urgent need for ice cloud retrievals, because retrievals are usually underdetermined resulting in large uncertainties or the requirement of additional con- strains. Even though additional information can also be obtained by multi-instrument combinations (e. g., Delanoë and Hogan, 2008 ; Grecu and Olson, 2008 ), using multiple instrument increases the complexity of measurements and retrievals. This can add new error sources, e. g., due to different spatio-temporal resolutions. Therefore, it would be a major improvement if more information could be exploited from a single instrument which in addition is already widely used.
In contrast to other studies which focused mainly on bulk parame-
ters such as ice water content, here, the parameters describing particle
mass, projected area, and particle size distribution are directly in-
cluded into the retrieval. A retrieval based only on higher moments
and the slopes has the advantage that it depends only weakly on
radar calibration and vertical air motion. These effects are restricting
other retrievals using radar reflectivity and mean Doppler velocity (e. g., Szyrmer and Zawadzki, 2014 b). Higher moments and the slopes are, however, strongly influenced by broadening effects of the radar Doppler spectrum due to turbulence and wind shear. To reduce the impact of turbulence on the Doppler spectrum, the radar integration time has recently been reduced to 1 s to 2 s or even less for the radars of the ARM program (Kollias et al., 2007 a). Nevertheless, a low tur- bulence environment is investigated in this study to minimize the influence of turbulence.
In Additional Study II, the retrieval potential of higher moments is first analyzed qualitatively by evaluating response functions and then quantitatively by developing an idealized retrieval based on higher moments. The retrieval is successfully used to estimate the number of independent information pieces which higher moments can con- tribute to an ice cloud retrieval.
2 . 6 o u t l i n e
This thesis is composed of four parts: Apart from the introduction,
Part A also contains a brief overview of the theory of ice clouds and
radar observations. Then, Key Issue I Enhanced snowfall observations is
addressed in Part B containing Publications I and II. Part C presents
Key Issue II Exploiting higher moments with Additional Study I, Pub-
lication III and Additional Study II. Finally, a summary of the key
findings of Parts B and C and concluding remarks are given in Part D.
3
T H E O R Y
In the following, a brief introduction into ice cloud microphysics is given moving from micro-scale processes to macro-scale features.
After discussing the single scattering properties of ice and snow, the theory of meteorological radar observations is briefly introduced.
3 . 1 i c e a n d s n o w pa r t i c l e s i n t h e at m o s p h e r e 3 . 1 . 1 Formation of ice crystals
Ice particles can form by both homogeneous and heterogeneous nucle- ation (Pruppacher and Klett, 1997 ; Reitter, 2013 ). Rogers and Yau ( 1989 ) classifies heterogeneous processes into four mechanisms: ( 1 ) depo- sition of water vapor onto an ice nucleus. ( 2 ) heterogeneous con- densation of a droplet on an ice nucleus followed by freezing. ( 3 ) freezing of a supercooled droplet after immersion of an ice nucleus and—similarly—( 4 ) freezing of a supercooled droplet after contact with an ice nucleation nucleus. Heterogeneous nucleation is, however, limited by the lack of ice nuclei, which are far rarer than cloud con- densation nuclei. In addition, homogeneous freezing of SCLW drops occurs only at temperatures colder than − 37 °C, and consequently Super Cooled Liquid Water (SCLW) drops are frequent. Homogeneous freezing is the only homogeneous nucleation process, because ho- mogeneous ice nucleation by deposition requires non-naturally high supersaturations rates.
3 . 1 . 2 Growth from water vapor
Ice crystals’ growth from water vapor produces a broad range of different ice particle habits—literally every one is unique (Figure 3 ).
Johannes Kepler was probably among the first who described ice and
snow particles from a scientific point of view in 1611 (Kepler and Hardie,
2014 ). With the advent of photography, large catalogs with photos of
snow and ice crystals were collected showing the large natural vari-
ability of particles habits (e. g., Bentley, 1901 , 1903 ). Building up on
these collections, categorization schemes were developed to classify
ice and snow particles with respect to habit (Magono and Lee, 1966 ;
Kikuchi et al., 2013 ). Nakaya ( 1954 ) (cited in Marshall, 1954 ) was the
first one who tried to answer the question what determines the shape
of ice particles by laboratory experiments and found a strong depen-
dency on temperature and water vapor supersaturation relative to ice.
Figure 3 : Different kinds of ice crystals, partly with riming, obtained during the Global Precipitation Mission (GPM) Cold-season Precipitation Experiment (GCPEx,
Hudak et al.,2012). Figure courtesy of Ronald Stewart.
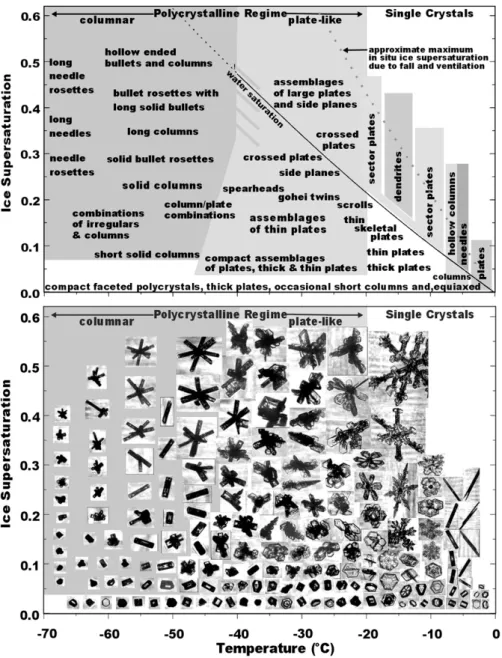
This concept was extended and refined multiple times (Magono and Lee, 1966 ; Pruppacher and Klett, 1997 ) and recently updated for temper- atures below − 20 °C (Figure 4 ) based on cirrus observations (Bailey and Hallett, 2009 , 2012 ). In general, ice particles can be mostly described as polycrystals below − 22 °C while single-crystal shapes dominate for warmer temperatures. For temperatures below − 40 °C, crystal shapes are mostly columnar and for temperatures between − 40 °C and − 22 °C plate-like shapes prevail. For warmer temperatures, the particle type changes frequently with increasing temperature: From sector plates and dendrites (− 22 °C to − 8 °C), to hollow columns and needles (− 8 °C to − 4 °C) and to plates again (− 4 °C to 0 °C). At all tem- peratures, the complexity increases strongly with increasing ice super- saturation and most complex dendrites can be found at temperatures between − 15 °C and − 10 °C. In this temperature range, the supersat- uration over ice with respect to liquid water reaches its maximum so that the Wegener–Bergeron–Findeisen process (i. e., the transport of water vapor from liquid drops to ice crystals, Korolev, 2007 ) works most efficiently. Even though the morphology diagram for ice crystals
SeeLibbrecht(2005) for an introduction into ice crystal growth from water vapor.
has been confirmed by several studies, the growth processes are qual- itatively and quantitatively not yet fully understood (Libbrecht, 2005 ).
For example, there is high variability among ice crystals created in
the laboratory under the same environmental conditions, highlighting
the sensitivity of growth towards small environmental perturbations
(Libbrecht, 2005 ).
Figure 4 : Habit diagram for ice crystals based on laboratory and in situ aircraft observations as a function of temperature and ice supersat- uration. Figure taken from
Bailey and Hallett(
2009). © American Meteorological Society. Used with permission.
3 . 1 . 3 Further development
Under real-world conditions, idealized single-crystal or polycrystal shapes occur only rarely, because a crystal is affected by different environmental conditions during its travel through the cloud. In addition, ice crystals do not only grow from deposition (diffusion), but also from riming and aggregation. The former describes coating
with small SCLW drops which freeze to the crystal on contact (see
Ice clouds containing SCLW are termed mixed phase clouds.Figure 3 for examples). SCLW occurs frequently (Boudala et al., 2004 )
at the top of ice clouds (Rauber and Tokay, 1991 ) even at temperatures
of − 30 °C and below (Wang et al., 2004 ; Verlinde et al., 2007 ). It has a strong impact on cloud microphysics (Tremblay et al., 1996 ; Jiang et al., 2000 ) and radiation (Shupe and Intrieri, 2004 ), but ground-based detection is challenging (Shupe et al., 2008 a). Finally, aggregation—
merging of several ice crystals—leads to the creation of snow flakes which are composed of up to several thousand ice crystals (AMS, 2014 ). It is distinguished between the “primary” and “secondary aggregation growth region” (Locatelli and Hobbs, 1974 ; Löhnert et al., 2011 ). The former occurs at temperatures of − 5 °C and larger and is related to the higher sticking efficiency caused by a thin quasi- liquid film on the ice surface (Rosenberg, 2005 ). The latter region is caused by the branched structure that is typical for ice crystals in the temperature range − 10 °C to − 15 °C and which increases the sticking efficiency of ice crystals (Hobbs et al., 1974 ). If particles fall into sub-saturated air, they may also diminish or even dissolve due to sublimation. Complete sublimation of precipitation below the cloud base is referred to as virga (see Publication II).
3 . 1 . 4 Size descriptor
In meteorology, bulk characteristics of ice crystals are typically of greater interest than properties of individual ice crystals, because a single crystal has negligible impact on the cloud processes. These bulk properties are often described as a function of size, but the definition of size is not straight forward for aspherical particles. Definition of size as a geometrical property of a particle such as the maximum dimension D might be obvious, but D is not directly related to a phys- ical quantity such as particle (projected) area A or particle mass m . In addition, most instruments can measure only the maximum dimen- sion in two dimensions ( 2 -D). That is, D is the maximum dimension of the projected particle area, but not of the three dimensional ( 3 -D) par- ticle. Assuming a worst case scenario of randomly oriented needles with length L , D has a broad probability distribution with expectation value D = 0 . 64 L (Petty and Huang, 2011 ). However, in situ (Zikmunda and Vali, 1972 ), active (Matrosov et al., 2005 ; Noel and Sassen, 2005 ), and passive remote sensing observations (Xie et al., 2012 ; Xie, 2012 ) found that the majority of ice particles falls with their major axis horizontally aligned. Even though the alignment is not perfect and particles flutter around the horizontal axis (Kajikawa, 1992 ; Noel and Sassen, 2005 ), this reduces the error of estimating the maximum dimension D from a 2 -D image significantly, if the mean particle orientation is considered by the design of the in situ probe.
There is a large variety of other size descriptors: e. g., Delanoë et al.
( 2005 , 2014 ) used mass m or the liquid equivalent diameter D
melted.
Even though this is the physically most consistent size descriptor, m
and D
meltare difficult to measure in-situ. Other studies (Mitchell and
Heymsfield, 2005 ; Baker and Lawson, 2006 ) propose to use the area A or an area equivalent diameter D
areaas size descriptor. Brown and Francis ( 1995 ), instead, used the mean diameter D
meandefined as (D
x+ D
y)/2 with D
x, D
ydefined as the extents in two arbitrary, perpendicular di- rections defined by the coordinate system of the probe. Because the maximum dimension D can be easily derived from optical measure- ments, it is widely used as size descriptor for in situ observations (Jackson et al., 2012 ; Heymsfield et al., 2013 ) and remote sensing (e. g.,
Delanoë and Hogan, 2008 ; Hogan et al., 2012 ; Szyrmer et al., 2012 ). Hence,
In the following, D is simply referred to as “particle size”.the maximum dimension D is used as size descriptor in this study as well.
3 . 1 . 5 Particle mass and area
Because size D defined as the maximum particle extent is not directly confined to particle mass m and projected area A , empirical relations
need to be used. Knowledge of m and A is important for—among
Similar to D, area A is defined as projected area as measured by an optical instrument here. This is not directly connected to the surface of the crystal. Sometimes, one can also find the use of area ratio Arinstead of A which is defined as the ratio between A and a sphere with same D.
others—remote sensing applications (Matrosov et al., 2002 ; Szyrmer and Zawadzki, 2014 a; Publication III), and for estimating the particle fall velocity (e. g., Locatelli and Hobbs, 1974 ; Khvorostyanov and Curry, 2002 ; Heymsfield and Westbrook, 2010 ; Publication III) which is required to estimate the mass flux to the surface.
For parameterization of m and A, power laws are commonly used
m(D) = a · D
b( 1 )
A(D) = c · D
d( 2 )
with empirically derived pre-factors a , c and exponents b , d . Most studies define these coefficients only for certain size ranges (Mitchell et al., 1990 ; Matrosov, 2007 ). While A(D) can be derived relatively easily from ground-based or aircraft in-situ observations using opti- cal instruments (e. g., Mitchell, 1996 ; Heymsfield and Miloshevich, 2003 ), m(D) is particularly difficult to measure in situ. It can be obtained by collecting and melting single particles at the ground, but sample sizes are often very small (Magono and Lee, 1966 ; Locatelli and Hobbs, 1974 ; Mitchell et al., 1990 ). From aircrafts, only ice water content IWC can be measured directly by evaporation of particles (Noone et al., 1988 ; Korolev et al., 1998 ) and m(D) has to be estimated from closure studies (Brown and Francis, 1995 ; Heymsfield et al., 2004 ). Another, yet rather in- direct, possibility is relating mass to area and/or particle shape (Baker and Lawson, 2006 ; Schmitt and Heymsfield, 2010 ; Jackson et al., 2012 ).
3 . 1 . 6 Particle size distribution
It is most common to describe the particle size distribution N(D) by the four-parameter modified gamma distribution
N(D) = N
0D
µexp(−ΛD
γ) ( 3 )
and its derivatives gamma, exponential and power-law distribution.
N
0is the intercept parameter, Λ is the slope parameter, and µ and γ are shape parameters. Snowfall is usually described using the two- parameter exponential distribution (Gunn and Marshall, 1958 ; Houze et al., 1979 ; Matrosov, 2007 ; Kneifel, 2011 ) which is obtained from Equa- tion 3 with µ = 0 and γ = 1 . Early studies described ice clouds using the power law distribution (Heymsfield and Platt, 1984 , obtained from Equation 3 with Λ = 0 ) or the three-parameter gamma distribution (Schneider and Stephens, 1995 , obtained from Equation 3 with γ = 1).
More recently, the use of the modified gamma distribution has been proposed (Delanoë et al., 2005 ; Petty and Huang, 2011 ), but other studies suggested log-normal distributions (Tian et al., 2010 )
N(D) = N
T√ 2π · s · D exp(− ln
2(D/D
T)
2s
2) ( 4 )
with N
Tintercept parameter, D
Tthe characteristic diameter and s the width of the distribution. Kosarev and Mazin ( 1991 ) propose to
InPublication IIIit is investigated in Sec.3how the choice of parameterization for N(D) affects forward modeling of radar observations.
describe N(D) as a multi modal function by adding several distribu- tions. The diversity of approaches highlights the complexity of the various growth mechanisms (see above), but also the challenges when measuring N(D) in situ with aircrafts (Baumgardner et al., 2012 ).
3 . 1 . 7 Quantities used in numerical weather prediction models
For the description of hydrometeors, numerical weather prediction (NWP) models with bulk microphysical schemes use typically parameters such as total number concentration n
tot, ice water content IWC or effective radius r
eff. While n
totand IWC are directly defined with
n
tot= Z
∞0
N(D) dD and ( 5 )
IWC = Z
∞0
N(D) m(D) dD , ( 6 )
the definition of r
effis unique only for liquid drops (Hansen and Travis, 1974 )
r
eff= Z
∞0
(D/2)
3N(D) dD Z
∞0
(D/2)
2N(D) dD
. ( 7 )
For ice clouds, D is not directly related to a physical quantity and the third (second) moment is not proportional to mass (area). To overcome this limitation, other definitions have been proposed, but there is no agreement on a convention yet (McFarquhar and Heymsfield, 1998 ).
All moments are defined assuming a size distribution from 0 to
∞, but instruments report only in a certain measurement range from
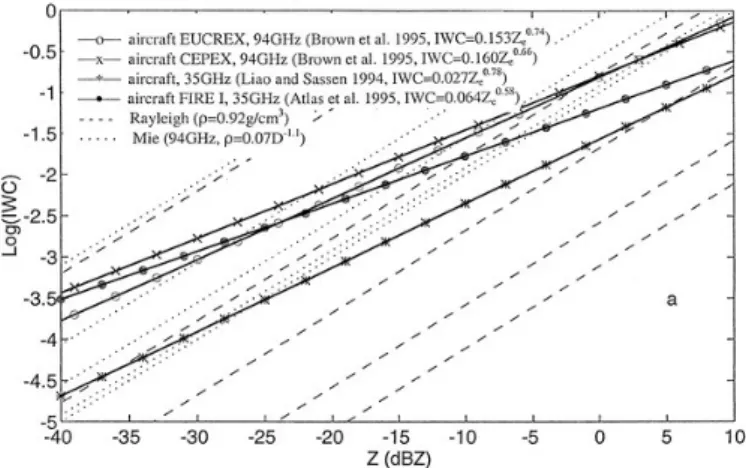
Figure 5 : Comparison of various empirical (solid) and theoretical (dashed)
Ze−IWCrelations. Figure taken from
Liu and Illingworth(
2000). © American Meteorological Society. Used with permission.
D
minto D
max. This can introduce biases when estimating moments from measured N(D) which has to be accounted for (see e. g., Tian et al. ( 2010 ) for mitigation strategies).
3 . 2 s c at t e r i n g p r o p e r t i e s o f i c e a n d s n o w pa r t i c l e s To relate radar (and microwave radiometer) observations to meteo- rological quantities (e. g., IWC), knowledge of the single scattering properties is required. This is also mandatory for developing instru- ment simulators (Additional Study I) that are needed by retrieval techniques (Additional Study II).
Estimation of scattering properties of ice and snow particles is chal- lenging and introduces a large uncertainty in radar observations. Fig- ure 5 shows various, empirical relations to relate IWC to the equiva-
lent radar reflectivity factor Z
edescribing the power scattered back
SeeSection3.3for definition of Ze.by the hydrometeors (e. g., Liu and Illingworth, 2000 ). For this purpose, power laws are used
Z
e= a ˆ · IWC
bˆ( 8 )
where ˆ a and ˆ b are the coefficients that are usually empirically de-
rived. Z
eis the sum of the backscattered power of every individual
hydrometeor within the radar volume. This power depends on the
backscattering properties of the particle which are described by the
backscattering cross section σ
B(D) , an hypothetical area describing
the likelihood that radiation is scattered back at the particle. The
backscattering cross section σ
B(D) is not only a function of D, but
also depends on particle projected area A , density, phase and shape
of the particle. All mentioned parameters are highly variable in ice
clouds. The easiest approach is to approximate the scattering proper-
ties of ice and snow particles by assuming particles with a spherical
shape. This allows the use of Mie theory (Mie, 1908 ; Bohren and Huff- man, 1983 ). For particles much smaller than radar wavelength λ , also
Compare with Equations12and13, the constants are only required to allow the simple definition of reflectivity factor Z (Equation11).
Rayleigh scattering (Lord Rayleigh, 1899 ; Young, 1981 ) can be assumed, which is a simplified special case of Mie scattering. For these small particles, reflectivity is proportional to the sixth power of particle diameter and defined as
σ
B(D) = π
5| K |
2D
6λ
4( 9 )
where | K |
2is the dielectric factor derived from the refractive index which describes how radiation propagates through the particle. The refractive index of solid ice for microwave wavelengths is known from empirical studies (e.g. Warren and Brandt, 2008 ), but assuming solid ice is only realistic for particles like hail (Herman and Battan, 1961 ).
Already Marshall and Gunn ( 1952 ) proposed to calculate the refractive index by approximating the particle as a homogeneous mixture of air and ice with effective density ρ. This approach was improved later by Bohren and Battan ( 1980 ) who proposed to use the approach of Garnett ( 1904 ) to estimate the mixed refractive index. Much later, this method was called the soft sphere approach (Liu, 2004 ), in contrast to the—less widely used—solid sphere approach where the scattering properties are estimated by a sphere of pure ice, but with a reduced, mass-equivalent radius (Liu and Curry, 2000 ; Evans et al., 2002 ). For ice approximated using the soft sphere approach, the backsacttering cross section σ
B(D) is proportional to D
4(Field et al., 2005 ), because the re- duction of density with size D compensates partly the D
6dependence of Rayleigh scattering.
Obviously, the approximation of ice crystal shape with a sphere is far from reality and more realistic results can be obtained by as- suming an ellipsoidal instead of a spherical shape. To describe an ellipsoid, the aspect ratio AR is required in addition to size D . Aspect
AR is sometimes denoted as axial
ratio as well.
ratio AR is defined as the ratio between maximum dimension D and
D
shortdescribing the extent of the particle perpendicular to maximum
dimension D (Hogan et al., 2012 ). Several studies found AR to vary
typically between 0 . 5 and 0 . 7 (Korolev and Isaac, 2003 ; Tyynelä et al.,
2011 ; Hogan et al., 2012 ). Because Mie theory can only be applied
to spheres, the—computationally much more expensive—T-Matrix
method (Waterman, 1965 ; Mishchenko, 2000 ) has been frequently used
to model the scattering properties of soft spheroids (e. g., Kummerow
and Weinman, 1988 ; Hogan et al., 2000 ). Even though the assumption
of an ellipsoidal soft sphere is a severe simplification of the particle
shape as well, several studies found that approximating ice and snow
crystals as horizontally aligned ellipsoids with an aspect ratio AR of
0 . 6 is a good compromise between computational effort and accuracy
for particles with size D smaller than wavelength λ (Liu, 2004 ; Kneifel
et al., 2011 a; Tyynelä et al., 2011 ; Hogan et al., 2012 ). For larger parti-
cles, intra-particle resonance effects occur and σ
B(D) oscillates with
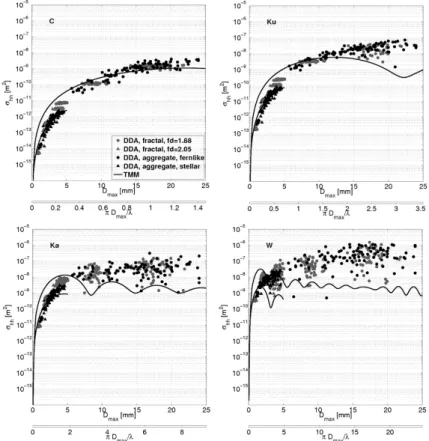
Figure 6 : Backscattering cross section
σBas a function of maximum dimen- sion
Dfor 5 . 6 GHz (C-band,
λ =54 mm, top left), 13 . 6 GHz (K
u- band,
λ=22 mm, top right), 35 . 6 GHz (K
a-band,
λ=8 . 4 mm, bot- tom left), and 94 . 0 GHz (W-band,
λ=3 . 2 mm, bottom right). Soft spheroids with an aspect ratio of 0 . 65 using two different mass- size relations (solid lines) are compared to DDA computations for fern-like aggregates (black circles), stellar aggregates (black trian- gles), and two kinds of aggregates of fractal crystals (gray circles and triangles). The maximum diameter sphere size parameter is also shown. Figure taken from
Tyynelä et al.(
2011). © American Meteorological Society. Used with permission.
increasing D (Figure 6 ). Because natural particles do not show these resonance effects due to their much more heterogeneous structure, this can lead to a systematic underestimation of σ
B(D) in the order of up to two magnitudes. Consequently, spheroidal particle models can only be used at C and K
u-band independent of snow particle size, and at higher frequencies, more complex models need to be used for particles which are larger than the wavelength λ.
The most common method to estimate scattering properties for
large, complex particles is the discrete dipole approximation method
(DDA, DeVoe, 1964 , 1965 ). The method splits up a single particle into
a finite array of polarizable points, for which the dipole moments are
estimated in response to the local electric field. This allows modeling
of arbitrary particle shapes. In Figure 6 , backscattering cross sections
σ
Bfor aggregates estimated with DDA computations are presented
which show—in contrast to soft-spheroids—no resonance effects, al- though the large scatter highlights the high variability of particle shape and mass. The computing time required for DDA calculations is very high and as a consequence, DDA cannot be included into an instrument simulator online, but the scattering properties of the particles need to be estimated beforehand (O’Brien and Goedecke, 1988 ; Evans and Stephens, 1995 a). Recently, several groups released data bases of DDA calculations containing not only idealized particles but also more complex particle shapes such as aggregates (Liu, 2008 b;
Petty and Huang, 2010 ; Tyynelä et al., 2011 , 2014 ). As a disadvantage, theses databases are less flexible because they contain only a certain selection of particles which can introduce constrains into the forward
It is disputed who should share honors with Rayleigh for the Rayleigh-Gans theory. Candidates besides Gans are Debye, Rocard, Kichhoff and Born so
thatBohren and Huffman(1983, pp.158) proposes playfully to call the approximation
“RGDRKBU—the U is reserved for as yet unknown claimants”.
model, e. g., with respect to the mass-size relation.
The Gans (Gans, 1912 ) extension of the Rayleigh theory is valid for particles with low density such as soft spheres. Recently it was found that it is not only a computationally efficient alternative to the T-Matrix method for particles smaller than the wavelength λ (Hogan et al., 2012 ), but gives also consistent results for larger particles (Hogan and Westbrook, 2014 ). As a drawback, the Rayleigh-Gans approxima- tion is not yet available for arbitrarily angles (as required for passive applications) and also polarization effects cannot be modeled (Hogan and Westbrook, 2014 ).
3 . 3 o b s e r v i n g i c e a n d s n o w c r y s ta l s w i t h r a d a r s 3 . 3 . 1 Weather radars
A radar (Radio Detection and Ranging) transmits radio pulses and re- ceives the backscattered signal of the target as a function of distance to the instrument. After rapid development in World War II for aerial
The history of radar meteorology can be found inAtlas (1990) in great detail.
surveillance, pioneers like Marshall et al. ( 1947 ) and Atlas ( 1948 ) were the first who tried to measure precipitation quantitatively with radars.
Traditionally, the backscattered signal is called radar reflectivity factor Z and is converted into rainfall rate ˙ R using a Z − R ˙ relation similar to Equation 8
Z = a ˙ · R ˙
b˙( 10 )
where the coefficients ˙ a and ˙ b are determined empirically (e.g. Mar- shall and Palmer, 1948 ). Depending on the phase of precipitation and on the type of event (e. g., convective vs. stratiform), ˙ a and ˙ b vary drastically introducing an uncertainty of up to 100 % for operational weather radars. In the simple case of Rayleigh scattering, radar re- flectivity is proportional to D
6for liquid particles, which leads to the definition of radar reflectivity factor Z as
Z = Z
∞0
N(D) D
6dD ( 11 )
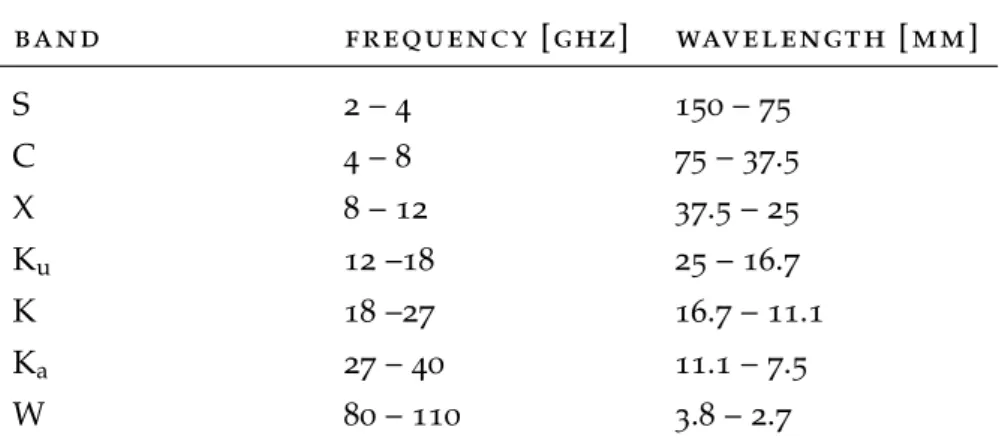
Table 1 : Overview over microwave bands used in radar meteorology with corresponding frequency and wavelength range (ITU,
2000).
b a n d f r e q u e n c y [ g h z ] wav e l e n g t h [ m m ]
S 2 – 4 150 – 75
C 4 – 8 75 – 37 . 5
X 8 – 12 37 . 5 – 25
K
u12 – 18 25 – 16 . 7
K 18 – 27 16 . 7 – 11 . 1
K
a27 – 40 11 . 1 – 7 . 5
W 80 – 110 3 . 8 – 2 . 7
where N(D) is the particle size distribution. The unit of Z is mm
6m
−3,
In this study, the notation dBz is preferred to dBZ following the convention proposed bySmith(2010).but it is usually expressed in “decibels with respect to a reference level of 1 mm
6m
−3” or simply “dBz” (Smith, 2010 ). Rayleigh scattering can only be assumed for the full size range of rain drops for C-band or S-band radars (see Table 1 for corresponding frequencies and wave- lengths λ ), for larger frequencies, the Rayleigh condition λ D does not hold true any more and the particle backscattering cross section σ
B(D) has to be estimated from e. g., Mie or T-Matrix theory. From σ
B(D) , radar reflectivity η is estimated with
η = Z
∞0
N(D) σ
B(D) dD ( 12 )
and converted into the equivalent radar reflectivity factor with
For brevity, the equivalent radar reflectivity factor Ze is often simply referred to as“reflectivity” in the following.
Z
e= λ
4| K
w|
2π
5η ( 13 )
where | K
w|
2is the dielectric factor for water. Z
eis defined such that Z
e= Z for rain and Rayleigh scattering. Because the phase of the observed hydrometeors is often unknown, for | K
w|
2the value of 0 . 93 is taken as a convention which is the dielectric factor for liquid water and cm wavelengths (Smith, 1984 ; Rinehart, 1991 , p. 65 ). For frozen hydrometeors such as ice particles or snow, | K |
2of Equation 9 has a different value than | K
w|
2and the exponent b of the mass-size relation (Equation 1 ) is not 3 . Consequently, Z
eis not equal to Z for observations of frozen particles, and in the following only Z
eis used . 3 . 3 . 2 Doppler radars
Doppler radars measure apart from range and reflectivity also the
shift of the phase of the electromagnetic wave caused by the Doppler
effect found by Doppler ( 1842 ). Weather radars use the measured
Doppler velocity e. g., for estimation of the wind field (Probert-Jones,
1960 ) or for early detection of tornadoes (Brown et al., 1978 ). If the radar is pointed vertically, the measured Doppler velocity is equal to the fall velocity of the hydrometeors assuming the absence of vertical air motion. For rain, the fall velocity can be translated into particle size (Gunn and Kinzer, 1949 ) so that the drop size distribution N(D) of rain can be gained assuming Rayleigh scattering (Probert-Jones, 1960 ; Atlas et al., 1973 ). Amongst others, this method is used by the standard processing scheme of the Micro Rain Radar (MRR, Klugmann et al., 1996 ; Peters et al., 2005 ), which is described in Publication I. However, this approach does not work for snowfall, because the change of particle fall velocity v with size D and mass m depends heavily on particle shape (Hobbs et al., 1974 ; Mitchell, 1996 ).
The Doppler velocity is measured by the phase shift between trans- mitted and received signal. As a consequence, the Doppler velocity measurement is unambiguous only for a phase shift of ± π. The corre- sponding maximal Doppler velocity is called Nyquist velocity and is estimated with
v
nyq= PRF λ/4 ( 14 )
where PRF is the radar pulse repetition frequency (Rinehart, 1991 , p 79 ). The spectrum is recorded from −v
nyqto v
nyqdiscretized into n
fftspectral bins corresponding to the number of Fast Fourier Trans- formation (FFT) points. If | v
nyq| is overspent, velocity aliasing effects occur, i. e., a wrong Doppler velocity shifted by an even multiple of
| v
nyq| is assigned to the measurement. See Publication I for a discus- sion of aliasing effects for vertically pointing radars and a proposed correction scheme.
3 . 3 . 3 Polarimetric radars
Polarimetric radars can receive and/or transmit electromagnetic waves in two orthogonal components, mostly horizontal and vertical polar- ization. Polarimetric observables such as differential reflectivity, linear
Bringi and Chandrasekar(2001) give an extensive introduction into polarimetric radar measurements.