Exploring the relationship between zooplankton diel vertical migration and a tertiary nitrite peak in the mesopelagic
oxygen minimum zone (OMZ)
M.Sc. Thesis in Biological Oceanography by
Dong-gyun Kim
Supervision by
Dr. Helena Hauss Dr. Rainer Kiko PD. Dr. Frank Melzner
November, 2019
Declaration of Authorship
I, Donggyun Kim, declare that this thesis and the work presented in it are my own and has been generated by me as the result of my own original research.
Exploring the relationship between zooplankton diel vertical migration and a tertiary nitrite peak in the mesopelagic oxygen minimum zone (OMZ)
I confirm that:
1. This work was done wholly or mainly while in candidature for a research degree at this University
2. Where any part of this thesis has previously been submitted for a degree or any other qualification at this University or any other institution, this has been clearly stated 3. Where I have consulted the published work of others, this is always clearly attributed 4. Where I have quoted from the work of others, the source is always given. With the exception of such quotations, this thesis is entirely my own work
5. I have acknowledged all main sources of help
6. Where the thesis is based on work done by myself jointly with others, I have made clear exactly what was done by others and what I have contributed myself
7. Either none of this work has been published before submission
Place: Kiel, Germany
Date: 28/11/2019 Signature:
ABSTRACT
Oxygen Minimum Zone (OMZ) is the intense oxygen depletion area located in three main regions, the Eastern South Pacific, Eastern Tropical North Pacific, and the Arabian Sea. The OMZ occurs due to the intense upwelling event supplying the nutrients from bottom to surface.
The oxygen concentration is one of the important factors that affect the Dial Vertical Migrating (DVM) zooplanktons behavior. During the day time, DVM zooplankton stays in the core of OMZ to escape their visual oriented predators, and move to the surface during the night time to do the feeding activity. Further, It is believed that this vertically migrating behavior affects the mid water depth nutrients content as DVM zooplankton actively transport the organic matter from surface to mid water depth. But, it is not clear how the DVM zooplankton affects the nu- trients content in mid water depth. This study aims to figure out whether the DVM zooplankton affects to the nitrite content in two intense OMZ regions, Eastern South Pacific (ETSP) and the Arabian Sea.
Through the ADCP backscatter signal, the abundance of DVM zooplankton and their mi- grating depth during the day time is calculated. The oxygen and nitrite concentration is col- lected from several CTD, Niskin bottle, and pump CTD data, and the particle data is collected from UVP5. By using these data, we estimated the relationship between them.
In addition to the secondary nitrite maximum, we found another nitrite maximum, which has can be distinguishable from secondary nitrite maximum. We named this nitrite maximum as ’tertiary nitrite maximum’. In both ETSP and the Arabian Sea, the tertiary nitrite maximum occurred in very intense oxygen regions. Especially, the tertiary nitrite maximum occurs if; 1) the oxygen concentration is less than 1µmol kg−1, 2) DVM zooplankton goes deeper than the depth at which secondary nitrite maximum occurred.
The regression analysis between the abundance of DVM zooplankton (calculated from ADCP backscatter signal) and tertiary nitrite concentration in midwater depth shows a sig- nificant positive relationship (Pearson r= 0.50, p<0.02). Further, the comparison between the secondary nitrite maximum and tertiary nitrite maximum shows a significant positive relation- ship (Pearson r=0.68, p<0.05), and the relative average ratio is 0.94. These result may imply DVM zooplankton actively export the organic nitrogen from surface to mid-water depth and
thereby fuel the denitrification process, which will eventually drive the N loss in the ocean.
Keywords: Zooplankton, Diurnal Vertical Migration, Nitrogen Cycle, , Tertiary nitrite maxi- mum Oxygen minimum Zone,ADCP.
ACKNOWLEDGEMENT
I would first like to thank my thesis supervisor Dr. Helena Hauss and Dr. Rainer Kiko, who guided me to lie on the right track. It was a really big fortune to meet Helena and Rainer as the supervisors. Their advice encouraged me to continue not even this research but the research that will be done in the future.
Special gratitude goes to PD Dr. Frank Melzner, who spends his time to read and evaluate my Masters thesis.
I am also grateful to every people met on GEOMAR. It was a great chance to learn from their priceless lectures and share knowledge with such brilliant scientists and students.
And finally, to my family and friends in S.Korea, there is no word to describe your sacrifice and support for me. Nevertheless, I would like to say thank you for everything.
Place: Kiel, Germany Dong-gyun Kim
Date: 28/11/2019
TABLE OF CONTENTS
ABSTRACT . . . i
ACKNOWLEDGEMENT . . . iii
LIST OF TERMS AND ABBREVIATIONS . . . vi
1 Introduction 1 1.1 Oxygen Minimum Zones (OMZ) in the Tropical Ocean . . . 1
1.2 The nitrogen cycle in OMZ regions . . . 2
1.3 General pattern of diel vertical migrating animals . . . 3
1.4 Objectives . . . 5
2 Material and Methods 6 2.1 Experimental site and data collection . . . 6
2.2 ADCP backscatter signal filtration . . . 10
2.3 Depth of DVM and nitrite peak detection . . . 12
3 Results 13 3.1 DVM distribution . . . 13
3.2 Vertical profiles of nitrogen compounds, oxygen and backscatter signal . . . 14
3.3 Regression . . . 20
4 Discussion 23 4.1 Zooplankton vertical distribution and DVM behavior off Peru and in the Arabian Sea . . . 23
4.2 Nitrite vertical distribution in OMZ regions . . . 24
4.3 Relationship between the nitrite and DVM . . . 26
5 Conclusion 30
REFERENCES . . . 30
Introduction
1.1 Oxygen Minimum Zones (OMZ) in the Tropical Ocean
In regions with high surface productivity (and, thus, export flux) and restricted ventilation, the oxygen concentration profile in the water column follows a distinct pattern with a minimum at mesopelagic depths (Paulmier and Ruiz-Pino, 2009; Mislan et al., 2013). These mesopelagic oxygen minimum zones (OMZs) are present in all oceans, but their vertical range, the depth and concentration of the minimum differs between oceans (Gilly et al., 2013; Chavez and Messi´e, 2009). The oxygen distribution is ultimately caused by upwelling of nutrients and trace metals from the deeper depths to the sunlit surface layer, leading to high primary productivity. The or- ganic material that sinks down into mesopelagic depths is respired by metazoans and microbes, primarily consuming dissolved oxygen as a terminal electron accepter (TEA) in the water col- umn. As the oxygen concentration decreases, the other TEAs are used for microbial respiration in order of preference for nitrate, manganese iv, iron iii, sulphate and carbon dioxide (Wright et al., 2012). This phenomenon happens in regions with high surface primary productivity such as the Eastern Tropical South Pacific (ETSP), the Eastern Tropical North Pacific (ETNP), the Arabian Sea, and the Bay of Bengal. Among these regions, the ETSP and the Arabian Sea are considered as extreme OMZ areas having less than 1µM/L oxygen concentration (Paulmier and Ruiz-Pino, 2009).
The ETSP is located off Chile and Peru, which is influenced by the Humboldt current system (HCS). The HCS is an eastern boundary current system that extends along the west coast of South America from southern Chile up to near the Equator (Thiel et al., 2007). Its main characteristic is the coastal upwelling of cold, nutrient-rich subantarctic water masses leading to high primary production in the surface. The localized upwelling events inject nutrient to the surface water and, as a result, fuel high primary productivity and the largest fishery in the world (Chavez and Messi´e, 2009).
The other extreme OMZ region is the Arabian Sea in the northern Indian Ocean. The Arabian Sea is typically characterized as a more complex system because of high seasonal variations. The main factor that causes high seasonal variations in the Arabian Sea is the mon-
soonal wind that blows in opposing directions depending on the season. The winter monsoon blowing from the northeast and the summer monsoon blowing from southwest alter the current system in the Arabian Sea, resulting in the formation of upwelling regions at different locations (Clemens et al., 1991; Naqvi, 1991). The formation of OMZ in the Arabian Sea is different compared to other OMZ regions having intense upwelling regions. According to Naqvi (1991), the Arabian Sea OMZ is centered in the eastern/central Arabian Sea where intense upwelling is not reported. Further, regardless of the effect of monsoonal wind, the suboxic conditions of the OMZ are constant with minor variation in all seasons (Sarma, 2002). The previous studies explained the constant OMZ formation regardless of the seasonality by compensation between the physical and biogeochemical processes. During the monsoon season, the high primary pro- ductivity compensates the high oxygen supply by vertical eddy mixing, which transport oxy- genated waters from western boundary to eastern/central Arabian Sea (McCreary et al., 2013).
However, during the nonmonsoon season, which has low primary productivity, the remaining organic matter from the monsoon season compensates the low oxygen supply (Sarma, 2002).
1.2 The nitrogen cycle in OMZ regions
Among the various nutrients required by planktonic algae, dissolved inorganic nitrogen (N) is the primary limiting macronutrient for surface oceanic primary productivity (Gruber, 2008;
Vrede et al., 1999). The major forms of dissolved inorganic N are nitrate (N O3), nitrite (N O2) and ammonium (N H4). Nitrogen compounds enter the ocean via biological nitrogen fixation, atmospheric dust input, river runoff or volcanic activity. The nitrogen cycle contains various nitrogen pathways (Gruber, 2008; Codispoti and Christensen, 1985).
Many nitrogen pathways highly depend on the environmental oxygen concentration. In the euphotic zone, where the oxygen is sufficiently available to be used as an electron acceptor, am- monification and nitrification (eq. (1.1)) remineralize the particulate organic nitrogen (PON) to dissolved inorganic nitrogen (DIN), such asN H4,N O2 andN O3 (N H4 >N O2 >N O3). The remineralized DIN will be taken up by bacteria and phytoplankton which will be re-entering the nitrogen cycle (Voss et al., 2013; Gruber, 2008).
2 NH4++ 3 O2 −−)−−*2 NO2−+ 4 H++ 2 H2O (1.1) 2 NO2−+ O2 −−)−−*2 NO3−
However, in low oxygen environments where the oxygen concentration is less than about 10µM/L, anammox (eq. (1.2)) and denitrification are dominant because oxygen is no longer available as electron receptor. The denitrification process (N O3 >N O2 >N O >N2O >N2) is
mainly performed by heterotrophic bacteria using nitrate as electron acceptor instead of oxygen (Brewer et al., 2014). Another nitrogen pathway that takes place in low oxygen environments is anammox in which ammonium and nitrite combine to produce dinitrogen gasN2, which is not readily available to non-diazotroph phytoplankton (Kuypers et al., 2003). The formation ofN2 via denitrification and anammox is considered as the major N loss process in the world ocean (Codispoti et al., 1986).
NH4++ NO2−−−)−−*N2+ 2 H2O (1.2) As an intermediate form in both the oxidation and reduction pathway of N, nitrite can show various depth distribution profiles. In most of the world ocean, the nitrite profile shows a pri- mary nitrite maximum (PNM) in the euphotic zone. Here, ammonium, which is a source of nitrite, is produced by degradation of organic matter by bacteria and direct release of phyto- plankton (Casciotti, 2016; Beman et al., 2013; Voss et al., 2013; Dore and Karl, 1996). Then, ammonium is oxidized byN H3 oxidizing bacteria and Archaea, which leads to the accumula- tion of nitrite (Beman et al., 2013). Due to this continuous reaction, a primary nitrite maximum occurs as a result of the dissimilarity between the ammonium oxidation rate and the nitrite oxidation rate (Gruber, 2008; Beckmann and Hense, 2017).
Unlike the open ocean, OMZ regions with very low oxygen concentrations (<1µM/LO2) feature a secondary nitrite maximum (SNM) which is observed in the upper boundary of the OMZ (Lam et al., 2011; Brandhorst, 1958; Morrison et al., 1999; Casciotti, 2016; Revsbech et al., 2009; Thamdrup et al., 2006). The SNM occurs due to nitrate reduction and ammo- nium oxidation (Casciotti, 2016). Between the two nitrite formation process, nitrate reduction is considered as the primary nitrite formation process. However, about 50% of reduced nitrite is reoxidized by nitrite oxidizing bacteria and anammox (Buchwald et al., 2015; Lam et al., 2011; Lipschultz et al., 1990; Strous et al., 2006), which breaks the denitrification process and eventually leads to N loss in the ocean. Previous experiments have shown (Ward et al., 2008;
Babbin et al., 2014) that labile organic matter is an important source for the denitrification pro- cess. Thus, continuous supply of labile organic matter from the surface to the upper boundary of the OMZ is a crucial step in the N loss process in OMZ regions.
1.3 General pattern of diel vertical migrating animals
The phenomenon that oceanic zooplankton and nekton changes its depth distribution be- tween day and night is known as Diel Vertical Migration (DVM) and occurs globally (Lampert, 1989; Hays, 2003). The main pattern of DVM is a migration from shallow depths at night to
greater depths at daytime. Also, depending on the physiological characteristic of DVM zoo- planktons, the DVM depth is species-specific and, in some species, life stage-specific (Trem- blay et al., 2011; Klevjer et al., 2012), resulting in discrete DVM depth layers. This specific pattern allows zooplankton to escape visually oriented predators, including fish, cephalopods, marine mammals, and seabirds, by remaining in deeper depths as a refuge during the daytime (Bianchi and Mislan, 2016; Loose and Dawidowicz, 1994). Even though the maximum densi- ties of phytoplankton and microzooplankton which are preyed upon by zooplankton occur in shallow water depths, this behavior gives a clear benefit to DVM zooplankton by decreasing their mortality rate. Thus, the pronounced OMZ in subsurface waters influences the predator- prey interaction and disturbs the behavior of some migrating species (Wishner et al., 2018).
Among the zooplankton and micronekton performing DVM, Euphausiids are known as a typical taxonomic group carrying out DVM and a key species of the marine pelagic ecosystem.
Euphausiids are found worldwide, but only 86 species are recorded (Tremblay et al., 2011;
Brinton, 1962). Due to their wide distribution range, their behavior and physiological response are variable. Although euphausiids have a relatively small size (1-2cm in average), they almost always descend and ascend every day between 100 and 600 m depth (Brinton, 1979).
The intense OMZ off Peru profoundly affects euphausiid behavior and metabolic strategies (Antezana, 2009). As they rely on DVM to escape visual predation during the day, they need to be able to cope with anoxia or near-anoxia for several hours every day. The strategy to cope with anoxic conditions is the suppression of metabolic activity which is achieved through a reduction in aerobic metabolic pathways and other cellular processes that require high oxygen demand (Seibel et al., 2016; Lampert, 1989; Kiko et al., 2016). Thus, the suppression of the metabolic rate of euphausiids during the daytime decreases the amount of oxygen and carbon respired as well as the excretion of dissolved nitrogen compounds (Kiko et al., 2016; Seibel et al., 2018). However, the DVM zooplankton still have important role in active transport of particulate and dissolved organic nitrogen by contributing around 80% and 30% of sinking fluxes in tropical ocean and in arctic ocean, respectively (Darnis et al., 2017;?; Takahashi et al., 2009).
Zooplankton plays an important role in oceanic elemental cycles. They mainly feed on their prey in surface waters and produce sinking fecal pellets which are passively sinking to deeper depths (Fowler and Small, 1972). However, DVM zooplankton actively exports the organic matter from surface to deeper depth (Hays et al., 1997). They not only transport the fecal pellets and dissolved organic matter to deeper depth but also mix the water column through their vertical movement (Houghton et al., 2018). Their active transport of dissolved organic and inorganic matter from surface water to deeper water depth supply nutrient to microorganisms inhabiting deeper layers. The organic matter originating from zooplankton is remineralized by the microbial community in deeper water depths providing available nutrients for primary
producers (Steinberg et al., 2002). As a consequence, DVM zooplankton contributes to the mesopelagic community by actively transporting inorganic and organic matter from surface water to deeper water depths.
1.4 Objectives
In this study, we evaluate the impact of zooplankton DVM (estimated by ADCP backscatter) on the vertical distribution ofN O2(measured in CTD niskin bottles) in OMZ areas in the ETSP and in the Arabian Sea. We hypothesize that 1) under near-anoxic conditions, accumulation of nitrite occurs in the OMZ in a similar depth range as the daytime depth of migratory organisms 2) higher migratory zooplankton biomass results in higher concentration of nitrite in the same depth layer 3) the depth of the nitrite peak and the daytime depth of migratory zooplankton are positively related
Material and Methods
2.1 Experimental site and data collection
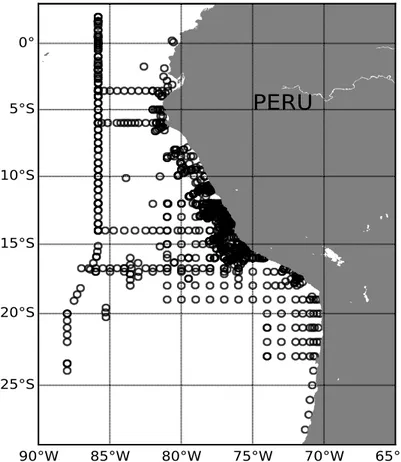
Between 2008 and 2019, twelve cruises to the ETSP were conducted with R.V. Meteor and R.V. Maria S. Merian in the context of the collaborative research center 754 ’Climate biogeochemistry interactions in the Tropical Ocean’. During each cruise, hydrographic and biological data sets were collected, particularly off Peru between 0 and 30S.
90°W 85°W 80°W 75°W 70°W 65°W
25°S 20°S 15°S 10°S 5°S 0°
PERU
Fig. 1Stations sampled from 2008 to 2019 cruises.
In total, 1,288 conductivity-temperature-depth (CTD) profiles are available to map the hy- drographic conditions in the research area. The CTD probe (Seabird SBE) is routinely equipped
with twin sensors for temperature, conductivity (salinity) and oxygen. In addition, it carries varying additional sensors such as chlorophyll-a fluorescence, photosynthetically active radia- tion (PAR) and turbidity. On all cruises, the probe was mounted on a 24-niskin water sampler rosette that allows for discrete sampling profiles for e.g. nutrients. Analyses of inorganic nutri- ents were conducted immediately on board after Grasshoff 1999 using a Quaatro autoanalyzer.
The acoustic doppler current profiler (ADCP) is routinely used as an underway measure- ment on oceanographic vessels. It contains four transducers and receivers and measures current velocity by emitting sound waves and measuring their echoes. The Doppler effect makes it pos- sible to detect the speed and direction of moving particles through the frequency shift of the echoes. Somewhat as a side product, also raw backscatter intensity is yielded and can be used as a proxy for the depth distribution and biovolume of zooplankton in the water column. The analysis of the day-night backscatter difference can yield the bulk volume of migrating pelagic organisms.
The Underwater Vision Profiler 5 (UVP5) is a camera system made to quantify aggregates and zooplankton larger than 100µm. The UVP5 is composed of a camera, lens, pressure and angle sensors, acquisition and piloting board, internet switch, a hard drive and dedicated elec- tronic power boards. It can be mounted on a standard rosette frame and interfaced with the CTD. The camera captures images of aggregates and zooplankton at a rate of 6 Hz (6 images per 1 second) and the maximum deployment depth is 6000m. The recorded images are saved on its memory with the size and mean gray value of each object (Picheral et al., 2010). The par- ticles can be categorized as micrometrical particles (MiPs) and macroscopic particles (MaPs) which are defined by size range of 0.14mm to 0.53mm and 0.53mm to 16.88mm respectively (Kiko et al., 2017)
A PumpCTD system was developed in cooperation of the Leibniz Institute for Baltic Re- search (IOW) and the Max Planck Institute for Marine Microbiology (MPI) Bremen in 2001.
This system was developed to overcome the limitation of conventional methods, e.g. CTD Rosette. The PumpCTD system makes it possible to get higher resolution of vertical data points with a maximum 1m interval (Strady et al., 2008; Loginova et al., 2019). The PumpCTD sys- tem is equipped with a high pressure pump, nylon hose and analytic system. A continuous water stream is pumped up on board at approximately 2L/min via the nylon hose from the wa- ter column and the pumped water samples are analyzed in analytic system. However, as the length of the nylon hose is about 400m, the maximum sampling depth is 400m depth.
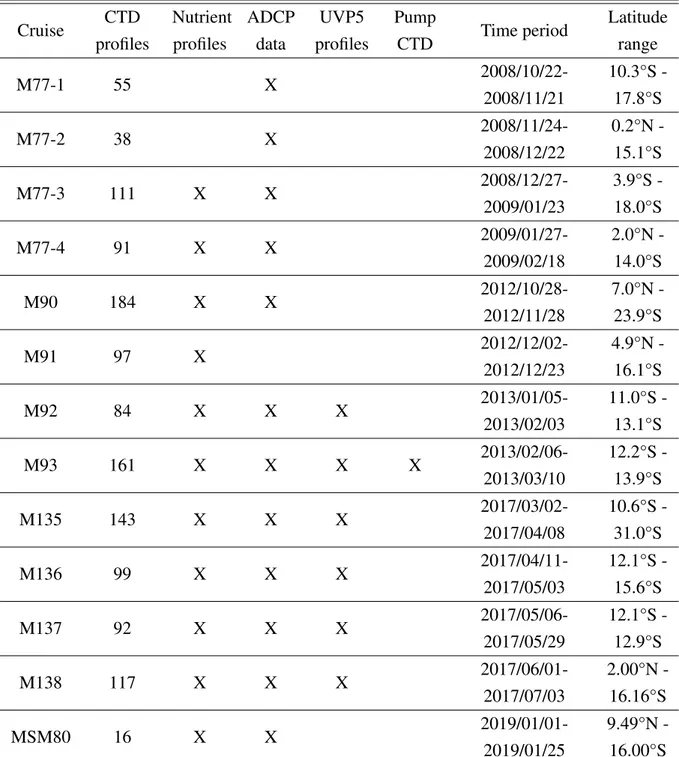
Table 2.1Expeditions to the ETSP off Peru with datasets available
Cruise CTD
profiles
Nutrient profiles
ADCP data
UVP5 profiles
Pump
CTD Time period Latitude range
M77-1 55 X 2008/10/22-
2008/11/21
10.3°S - 17.8°S
M77-2 38 X 2008/11/24-
2008/12/22
0.2°N - 15.1°S
M77-3 111 X X 2008/12/27-
2009/01/23
3.9°S - 18.0°S
M77-4 91 X X 2009/01/27-
2009/02/18
2.0°N - 14.0°S
M90 184 X X 2012/10/28-
2012/11/28
7.0°N - 23.9°S
M91 97 X 2012/12/02-
2012/12/23
4.9°N - 16.1°S
M92 84 X X X 2013/01/05-
2013/02/03
11.0°S - 13.1°S
M93 161 X X X X 2013/02/06-
2013/03/10
12.2°S - 13.9°S
M135 143 X X X 2017/03/02-
2017/04/08
10.6°S - 31.0°S
M136 99 X X X 2017/04/11-
2017/05/03
12.1°S - 15.6°S
M137 92 X X X 2017/05/06-
2017/05/29
12.1°S - 12.9°S
M138 117 X X X 2017/06/01-
2017/07/03
2.00°N - 16.16°S
MSM80 16 X X 2019/01/01-
2019/01/25
9.49°N - 16.00°S
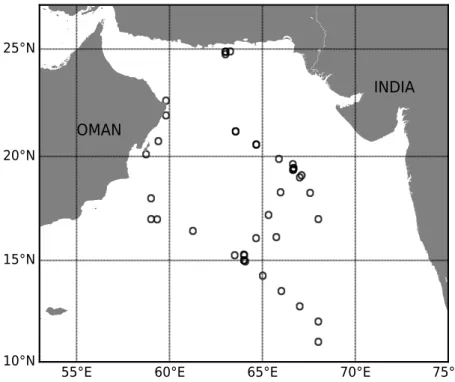
In the Arabian Sea, several cruises from different years are used for the analysis. The nu- trient and physical data were collected on board R.V. Meteor 74/1b and 74/2 (Lam et al., 2011) andR/V Roger Revelle KNOX09RR, both were conducted in 2007. Both cruises collected the water samples from a CTD rosette system equipped with Niskin bottles (Sea-Bird Electronic Inc.) at 10 to 25 m depth intervals and passed the Arabian Sea OMZ region for which high
nitrite accumulation and secondary nitrite peak were reported (Naqvi, 1991).
55°E 60°E 65°E 70°E 75°E
10°N 15°N 20°N 25°N
INDIA OMAN
Fig. 2Stations sampled from Meteor 74/1b, 74/2 and Roger Revelle KNOX09RR in 2007.
DVM depth data from the Arabian sea was downloaded from the data archive of Bianchi and Mislan, 2016, who already analyzed the ADCP data in the Arabian Sea from 1990 to 2010.
The original ADCP data are from the U.S. Joint Archive for Shipboard ADCP (JASADCP) and the British Oceanographic Data Center. The ADCP frequency that was used (38kHz to 153kHz) is suitable to detect organisms in the size range of a few millimeters to centimeters (Luo et al., 2000).
Table 2.2Expeditions to the Arabian Sea with datasets available
Cruise CTD
profiles
Nutrient profiles
ADCP
data Time period Latitude range
Meteor 74/1b 18 X 2007/09/20-
2007/10/01
15.2°N - 22.6°N
Meteor 74/2 4 X 2007/10/13-
2007/10/24
24.7°N - 24.8°N Roger Revelle
KNOX09RR 19 X 2007/09/20-
2007/10/18
10.9°N - 19.6°N JASADCP
(DVM depth) X 1990 - 2010 5.0°N -
25.0°N
2.2 ADCP backscatter signal filtration
Before analysing the ADCP data from the ETSP, it was necessary to filter out backscatter signals which are not suitable for this study. The quality of the ADCP backscatter signal is often low when the ship is on a station as bubbles are introduced in front of the transducers by the ship’s thrusters. To filter out dawn and dusk data, we calculated the day, night, dawn and dusk for the timestamp of each backscatter signal and removed those that came from dawn or dusk. Also, the noisy backscatter signal whith a constantly increasing backscatter strenght with depth was filtered out. After the filtration, four plots for each sampling station were made to check whether the backscatter signal shows clear DVM pattern and whether the unwanted backscatter signal was clearly filtered out.
The first plot shows the typical DVM pattern (Fig. 3a). As previous researches already noted, the DVM zooplankton moves downward at dawn and stays at mid-water depth during the day (Lampert, 1989; Hays, 2003; Loose and Dawidowicz, 1994). After 6 to 8 hours at depth, they start to move upward at dusk and stay at the surface during the night. The second plot supporting the first plot shows single profiles of the backscatter signal (Fig. 3b). However, it is impossible to see any pattern representing the daytime DVM behavior because the profiles involve the profiles from day, night, dawn, dusk and even error. To obtain a clear profile representing the daytime backscatter signal, the profiles from night, dusk, dawn and error were filtered out. After the filtration process, we made the similar plots of previous two plots to see whether the unwanted profiles are clearly filtered out and whether the backscatter profile shows one clear shape (Fig. 3c, 3d).
06 12 18 00 06 12 18 00
Time(utc)
0 100 200 300 400 500 600
Depth(m)
(a)
120 100 80 60 40 20
SV(dB)
1 2 3 4 5 6 7
Nitrite(µM/L)
150 100 50 0
ADCP SV(dB)
0 100 200 300 400 500 600
(b)
06 12 18 00 06 12 18 00
Time(utc)
0 100 200 300 400 500 600
Depth(m)
(c)
120 100 80 60 40 20
SV(dB)
1 2 3 4 5 6 7
Nitrite(µM/L)
150 100 50 0
ADCP SV(dB)
0 100 200 300 400 500 600
(d)
Fig. 3An example of one station’s backscatter signal image and corresponding nitrite sampling depth (R/V meteor 135 station id 113). (a) DVM pattern and (b) backscatter signal profile before the filtration.
(c) DVM pattern and (d) backscatter signal profile after the filtration. The blue and orange backscat- ter profile indicate the night time and day time backscatter profile, respectively. Vertical reddish dots indicate where the nitrite sampled (a, c).
After the filtration of the backscatter signal, the nutrient profile and corresponding backscat- ter signal have to be matched to allow comparisons. The backscatter signal was obtained around 24 hours from the time of the respective CTD cast (nutrient profile acquisition). The best way to obtain an backscatter signal corresponding to the nutrient profile would be to get a daytime backscatter signal and a nighttime backscatter signal from the exact same date and position of the nutrient sampling. However, in some cases, as the backscatter signal is already filtered out due to it’s low quality, it was unavailable to use the exact same date and time of the backscatter signal. If the backscatter signal from the exact same date of nutrient sampling was unavailable, we adopted time and distance as the criteria to get the alternative corresponding backscatter signal. We used the backscatter signal obtained with±24 hour and±100 kilometer from nu- trient sampling. Once each backscatter signal was obtained, the actual backscatter signal from
the DVM zooplankton had to be calculated by subtracting the night from the day backscatter signal.
2.3 Depth of DVM and nitrite peak detection
The general profile of daytime echo signal is represented by the two separated peaks from the surface and mesopelagic zone. Even though the surface echo signal from nighttime is greater than the echo signal from daytime, the echo signal from surface shows intense strength regardless of daytime and nighttime; however, the mesopelagic echo signal peak only occurs during daytime when the DVM animals are at their daytime depth. To detect the DVM depth, for each DVM event from daytime, we manually identified the upper and lower depth limits of DVM to help the detection of DVM and identify the DVM depth with the strongest echo signal.
To explore the vertical and horizontal distribution of nitrite in OMZ regions, we plotted the nitrite profile of each sampling site and categorize the nitrite profile into one of the following criteria. Type 1: nitrite profile that has only a primary nitrite maximum in the euphotic zone, Type 2: nitrite profile that has a primary and a secondary nitrite maximum, Type 3a: nitrite profile that has a tertiary nitrite maximum separated from the secondary nitrite maximum, Type 3b: nitrite profile that has a tertiary nitrite maximum extending from the secondary nitrite maximum. To analyze the DVM effect on the nitrite maximum, we only use Type 3a because we assumed that the tertiary nitrite separated from the secondary nitrite maximum solely relates to DVM activity.
For each nitrite profile, we estimated the depth of the nitrite peak at which the highest concentration occurs in the tertiary nitrite peak. However,we excluded the other nitrite profiles which have continuous tertiary and secondary nitrite peak. Since the nitrite peak of this profile overlaps the nitrite from sinking particles and DVM , the nitrite peak from DVM alone cannot be calculated.
Results
3.1 DVM distribution
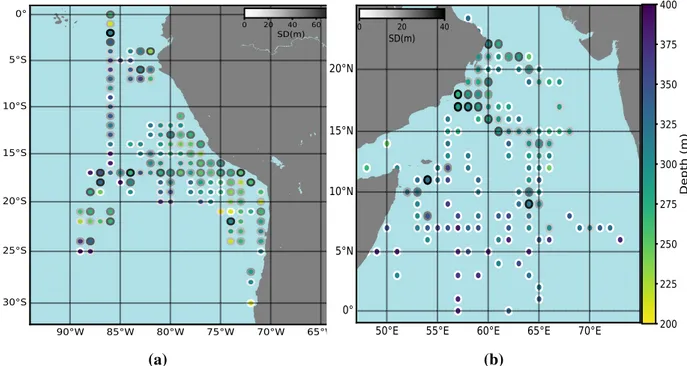
To determine the distribution of the DVM depth off Peru and in the Arabian Sea, we ana- lyzed the daytime ADCP backscatter signal (Fig. 4a). In both regions, the DVM depth ranged from 200m to 400m, and generally the DVM depth was shallower in coastal regions, while it was deeper offshore. In nearshore regions, the average DVM depth was less than 300m but in offshore regions, average DVM depth was deeper than 300m and reached maximum depth of 400m. However, in the offshore region between 17°S to 23°S and 85°W to 90°W, DVM depth was comparatively shallow (around 250 m), showing the patchiness of the distribution which might be related to transient features (e.g. eddies).
90°W 85°W 80°W 75°W 70°W 65°W 30°S
25°S 20°S 15°S 10°S 5°S
0° 0 20 40 60
SD(m)
(a)
50°E 55°E 60°E 65°E 70°E 0°
5°N 10°N 15°N 20°N
200 225 250 275 300 325 350 375 400
Depth (m)
0 20 40
SD(m)
(b)
Fig. 4 Map of DVM depth distribution from ADCP backscatter data off Peru (a) and in the Arabian Sea (b, extracted from Bianchi and Mislan, 2016). Each circle shows data averaged for 1°latitude by 1°longitude and color indicates the average DVM depth within the corresponding coordinate (shallower in yellow and deeper in blue). Outer circles indicate the standard deviation of average DVM depth (higher in dark and lower in white).
3.2 Vertical profiles of nitrogen compounds, oxygen and backscat- ter signal
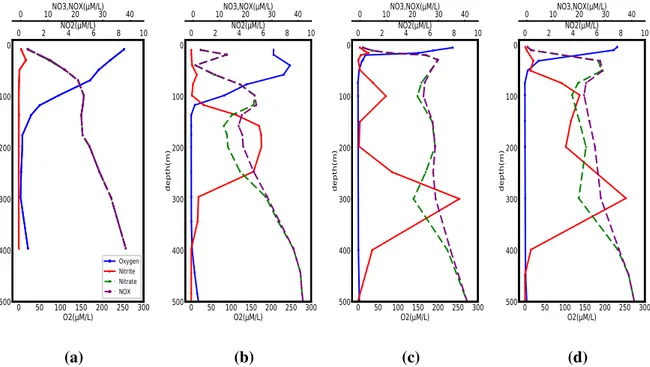
Off Peru, we observed four principle nitrite profiles (Fig.5): Type 1 (Fig.5a); the oxygen level did not drop down drastically and the nitrite profile has only one peak in the euphotic zone. Type 2 (Fig.5b); the oxygen level reached nearly 0 µM/L in the OMZ and the nitrite profile has a primary nitrite maximum in the euphotic zone and a secondary nitrite maximum at and below the upper boundary of the OMZ. Type 3a (Fig.5c); Very intense (≈0µM/L) and thick OMZ and two separate nitrite maxima occur at and below the upper boundary of OMZ and near the core of the OMZ. Type 3b (Fig.5d); Similar to type 3a, thick and intense OMZ with two nitrite maxima in the OMZ. However, the two nitrite maxima are connected to each other.
0 50 100 150 200 250 300 O2(µM/L)
0 100 200 300 400 500
depth(m)
Oxygen Nitrite Nitrate NOX 00 210 NO2(µM/L)420 630 840 10
NO3,NOX(µM/L)
(a)
0 50 100 150 200 250 300 O2(µM/L)
0 100 200 300 400 500
depth(m)
00 210 NO2(µM/L)420 630 84010 NO3,NOX(µM/L)
(b)
0 50 100 150 200 250 300 O2(µM/L)
0 100 200 300 400 500
depth(m)
00 210 NO2(µM/L)420 630 84010 NO3,NOX(µM/L)
(c)
0 50 100 150 200 250 300 O2(µM/L)
0 100 200 300 400 500
depth(m)
00 210 NO2(µM/L)420 630 84010 NO3,NOX(µM/L)
(d)
Fig. 5 Examples of each nitrite profile type with oxygen, nitrate and NOX profile. (a) Type 1 (R/V meteor 135 station id 004, lat: -27.9, lon: -71.3, year: 2017), (b) Type 2 (R/V meteor 135 station id 085, lat: -16.9, lon: -78.0, year: 2017), (c) Type 3a (R/V meteor 92 station id 011, lat: -12.5, lon: -77.6, year:
2013), (d) Type 3b (R/V meteor 135 station id 042, lat: -18.7, lon: -70.8, year: 2017)
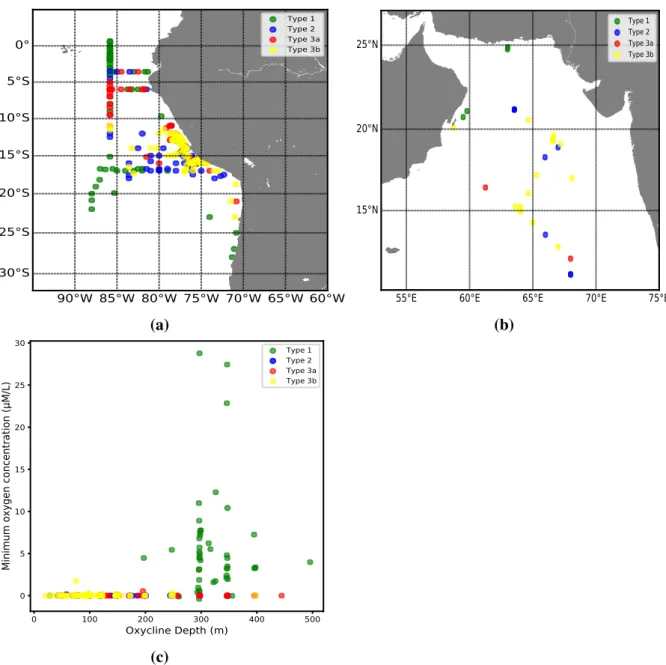
As the shape of the nitrite profiles differs spatially, we evaluated the distribution of nitrite profile types off Peru (Fig. 6a). While type 1 is generally located offshore, type 2, type 3a and type 3b are mostly located closer to shore. However, some cases of type 2 and type 3a are observed in 5°S - 13°S, 86°W, which is far apart from the shore. Type 1 also can be found in nearshore, especially between 25°S - 30°S, 73°W.
To further characterize each type of nitrite profile, their minimum oxygen concentration and upper oxycline depth is analyzed. The minimum oxygen concentration of type 2, type 3a and type 3b are near zero oxygen concentration. Also their upper oxycline depth is mostly positioned from 20 to 200m depth. However, in type 1, the minimum oxygen concentration was normally exceeding 0µM/L (reaching maximum 30µM/L) and the oxycline depth is located at 250m to 500m depth, which is much deeper than the other type’s.
90°W 85°W 80°W 75°W 70°W 65°W 60°W 30°S
25°S 20°S 15°S 10°S 5°S 0°
Type 1 Type 2 Type 3a Type 3b
(a)
55°E 60°E 65°E 70°E 75°E
15°N 20°N 25°N
Type 1 Type 2 Type 3a Type 3b
(b)
0 100 200 300 400 500
Oxycline Depth (m)
0 5 10 15 20 25 30
Minimum oxygen concentration (µM/L)
Type 1 Type 2 Type 3a Type 3b
(c)
Fig. 6(a) Distribution map of nitrite profile types off Peru (a) and in the Arabian Sea (b). (c)Minimum oxygen concentration and upper oxycline depth of each types.
The OMZ occurs near shore due to the intense upwelling event, and it is generally accepted that the oxygen concentration affects the vertically migrating zooplankton’s behavior. To es- timate the DVM depth pattern and oxygen concentration distribution from near shore to open ocean, we analyzed the backscatter signal and oxygen concentration from 73°W - 85°W, 17°S, which has continuous data points (Fig. 6a).
In Fig 7a, the oxycline, which is represented by the sudden change in oxygen concentra- tion, was found at deeper depth further away from the coast. Also, oxygen concentrations below 1µM/L were mostly found between 0km to 700km away from the coast. When oxygen concentrations were below 1µM/L, nitrite was found in a range of 0µM/L to 8µM/L.
The question then arises how the DVM pattern looks like and whether DVM affects the nitrite concentration in the OMZ. The analysis of the ADCP backscatter signal shows that the DVM reaches deeper depth further away from the coast. At 0km to 200km distance from the coast, the daytime DVM depth was found at 200m to 300m depth, however over 1000km away from the coast, the daytime DVM depth was found at around 350m to 500m depth. Also, above the oxycline, where abundant oxygen is found, the distribution of biomass follows the distribution of abundant oxygen concentration (shallower in nearshore, and deeper in the open ocean). Nearshore, which has shallower abundant oxygen concentration area at upper oxycline, the more intensely packed biomass (over -10 SV(dB)) is observed compared to the open ocean’s biomass (less then -20 SV(dB)).
0 200 400 600 800 1000
1200 Distance from shore (km)
0 100 200 300 400 500
Depth (m)
1
1
40 80
120 160
200
240 240
240280
0.0 1.6 3.2 4.8 6.4 8.0
Nitrite (uM/L)
(a)
0 200 400 600 800 1000
1200 Distance from shore (km)
120 100 80 60 40 20
SV(dB)
(b)
Fig. 7(a) Zonal section of Oxygen and Nitrite at 17°S off Peru. (b) Zonal section of acoustic backscatter at 17°S off Peru. The data are from M135, 73°W - 85°W at 17°S. 17°S and 72°W is set as origin of shore, and the distance is achieved by calculating the distance between origin of shore and location of sampling sites.
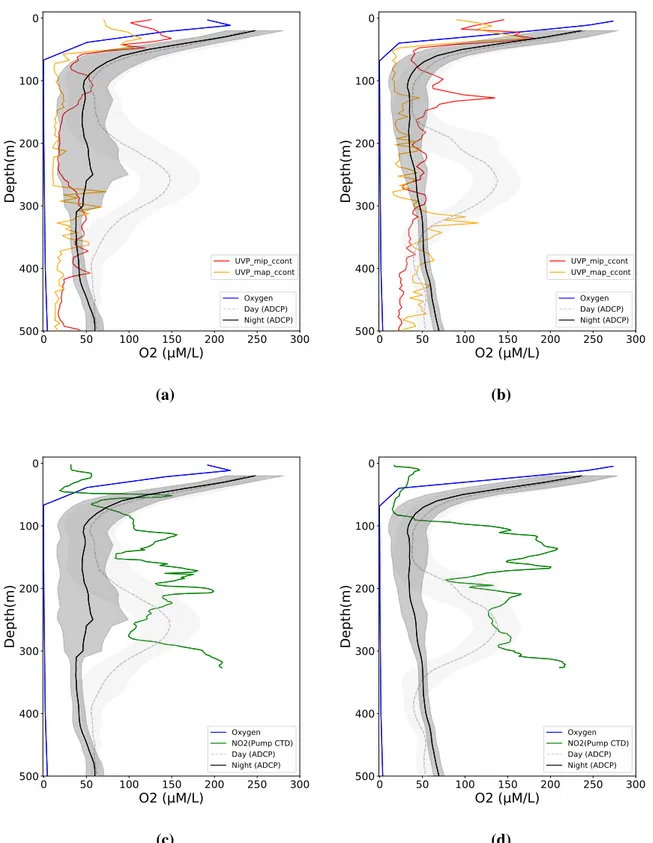
Fig. 8 shows the vertical profile of oxygen, nitrite from Pump-CTD, sinking particle, and ADCP backscatter profile which are taken from the same station.
In both stations, oxygen profiles show a similar pattern across the sites. The upper 50m depth shows high oxygen concentration over 300 µM/L. The concentration dropped rapidly around 50m to 100m depth and reached less than 1 µM/L concentration below 100m depth, which is the upper boundary of OMZ. This anoxic environment extended several hundred me- ters forming the intense OMZ and below the 400m depth, the intense OMZ ended where the oxygen concentration started to increase.
The daytime ADCP backscatter profile shows intense strength in upper 50m and mesopelagic zone (200m - 400m). To compare the daytime ADCP backscatter profile pattern and the nitrite
profile, we used nitrite profile data from pump CTD. As the pump CTD has 1m sampling interval, it is useful to better resolve the different maximum nitrite peaks. The comparison be- tween daytime ADCP backscatter profile and pump CTD profile in a range of 200m to 400m depth show strong spatial difference. In Fig. 8c and Fig. 8d, correlations between the ADCP backscatter profile and nitrite concentration from pump CTD were not significant (p = 2.101, p
= 4.206).
MiPs and MaPs show significant high number in the upper 50m at both sites. However, in the mesopelagic zone, the MiPs and MaPs profile shows high variations following the depth.
In both stations, MiPs and MaPs abundance was high in surface (0-50m depth). While MaPs abundance sharply decreased below 50m depth, MiPs abundance elevated around 150m depth in both stations. Below 200m depth, MiPs and MaPs remained quite constant. The abundance of MaPs in Fig. 8a and MiPs and MaPs in Fig. 8b suddenly increased around 300m depth which is right below the maximum in daytime backscatter at midwater depth.
0 50 100 150 200 250 300
O2 (µM/L)
0 100 200 300 400 500
Depth(m)
UVP_mip_ccont UVP_map_ccont
Oxygen Day (ADCP) Night (ADCP)
(a)
0 50 100 150 200 250 300
O2 (µM/L)
0 100 200 300 400 500
Depth(m)
UVP_mip_ccont UVP_map_ccont
Oxygen Day (ADCP) Night (ADCP)
(b)
0 50 100 150 200 250 300
O2 (µM/L)
0 100 200 300 400 500
Depth(m)
Oxygen NO2(Pump CTD) Day (ADCP) Night (ADCP)
(c)
0 50 100 150 200 250 300
O2 (µM/L)
0 100 200 300 400 500
Depth(m)
Oxygen NO2(Pump CTD) Day (ADCP) Night (ADCP)
(d)
Fig. 8 Vertical profiles of oxygen, nitrite, particles and ADCP backscatter signal. (a), (c) R/V Meteor 93 station id 391 (lat: -12.6 ,lon: -77.8, year: 2013), (b), (d) R/V Meteor 93 station id 399 (lat: -12.5 ,lon: -77.5, year: 2013). Gray and black lines show mean ADCP backscatter signal from 24 hours of sampling event of day and night respectively. Gray and black shading show the standard deviation around the mean. The green line shows the nitrite profile from pump CTD data. The red and orange
3.3 Regression
We analyzed the ADCP backscatter intensity and maximum tertiary nitrite concentration to correlate the abundance of DVM animals and the nitrite concentration (Fig. 9a, 9c). As the tertiary nitrite maximum occurred only in the type 3a (Fig. 5c) and type 3b (Fig. 5d), both types of nitrite profiles are used for analysis.
To find the backscatter intensity solely from DVM zooplankton, the depth range is restricted where DVM happen for each station. Then, we subtracted night backscatter intensity from day backscatter intensity, to get the relative DVM zooplankton biomass. Further, the maximum nitrite concentration is determined within the depth limits of the DVM daytime depth.
The backscatter signal difference between the day and night is mostly in a range from 20 to 80 dB, and the tertiary nitrite maximum did not exceed 8µM/L (Fig. 9c, 9a). When data from both type 3a and type 3b profiles are used, there is no pattern when compared to ADCP backscatter (Fig. 9a). However, when solely type 3a data are included , there is a significant positive correlation with day-night backscatter difference signal intensity (Pearson r=0.50, p<0.02) (Fig 9c).
Further, we compared the DVM depth and the depth of the tertiary nitrite maximum to evaluate whether the two maxima are correlated. If both type 3a and type 3b are included in the analysis (Fig. 9b), the depth ranges of tertiary nitrite maximum and DVM depth were from 150m to 400m and 150m to 300m, respectively. But if only type 3a is used (Fig. 9d), the depth ranges of tertiary nitrite maximum and DVM depth were from 250m to 400m and 200m to 350m, respectively. In both cases, the depth of maximum tertiary nitrite tended to be slightly deeper than the corresponding DVM depth rather than lying on the same DVM depth.
20 40 60 80
echo_signal (Day-Night) SV(dB)
0 2 4 6 8
Nitrite (µM/L)
(a)
100 150 200 250 300 350 400
NO2 maximum depth (m)
100 150 200 250 300 350 400
DVM depth (m)
(b)
20 40 60 80
echo_signal (Day-Night) SV(dB)
0 2 4 6 8
Nitrite (µM/L)
(c)
100 150 200 250 300 350 400
NO2 maximum depth (m)
100 150 200 250 300 350 400
DVM depth (m)
(d)
Fig. 9 Comparison of Day-Night backscatter signal difference and corresponding maximum tertiary nitrite concentration, (a) used both type 3a and type 3b and (c) used only type 3a. The higher Day-Night backscatter difference signal indicates a higher abundance of DVM animals. The red line indicates the regression of data points. Depth of maximum tertiary nitrite and DVM depth, (b) used both type 3a and type 3b and (d) used only type 3a. Black line indicates the one by one line.
To further characterize the relative intensity of the secondary and tertiary nitrite maximum, nitrite profiles from type 3a were chosen for comparison. The maximum nitrite concentration in the two peaks was positively correlated (Pearson r=0.68, p<0.05), and values are in a similar range . However, in some cases, the concentration of the tertiary nitrite maximum tended to exceed the secondary nitrite maximum (Fig. 9). The ratio between the tertiary and the
secondary maximum ranged from 0.17 to 2.80 and the average ratio is 0.94.
0 2 4 6 8 10
Tertiary nitrite (µM/L)
0 2 4 6 8 10
Secondary nitrite (µM/L)
Fig. 10Comparison of the concentration of the secondary and tertiary nitrite maximum from type 3a.
Red line and black line indicate the regression line and the one-to-one line, respectively.
Discussion
Since the 1930s, echosounders have been used to detect fish, and since then, the applica- tion of hydroacoustic methods has steadily developed and allows large-scale, high-resolution observations of organisms in the pelagic realm. Today, the standard shipboard instruments to detect and quantify pelagic organisms are single- or split beam echosounders such as the Simrad EK80, where each transducer is calibrated with a standard sphere to enable biomass estimation from echo strength. The ADCP is a different technical development dedicated to measure ocean currents by the Doppler frequency shift of echoes, and has four transducers.
Due to this physical setup as well as the data collection pipeline (in vertical bins), it is not possible to calibrate the backscatter intensity. Still, it is possible for individual instruments to relate ADCP backscatter to log10 zooplankton biomass from net catches, although the cor- relation coefficient is usually not very high (r ≈ 0.5) (Smeti et al., 2015; Jiang et al., 2007;
Heywood et al., 1991). Thus, ADCPs are still valuable instruments to observe fine-scale distri- bution patterns of zooplankton, but it is difficult to join data from different instruments (even at the same frequency). Thanks to the ADCP backscatter which gives continuous vertical data of the distribution pattern, previous researches found that DVM happens in most of the worlds oceans (Radenac et al., 2010; Jiang et al., 2007; Ashjian et al., 2002).
4.1 Zooplankton vertical distribution and DVM behavior off Peru and in the Arabian Sea
From the Arabian Sea and off Peru, we evaluated the spatial distribution pattern of DVM depth (Fig.4). In both regions, the DVM depth was shallower nearshore and deeper in offshore areas which agrees well with Mislan et al. (2013) and Bianchi and Mislan (2016). As DVM an- imals tend to dive to the core of OMZ (Bianchi et al., 2013), the depth of DVM change follows the extent of OMZ. The vertical extent of the OMZ is less thick nearshore than offshore, and the upper boundary of OMZ is shallower than offshore (Paulmier and Ruiz-Pino, 2009; Resplandy et al., 2012; Morrison et al., 1999). During the downward migration, DVM zooplankton may
stop once they reach a certain point of low oxygen concentration (Bianchi et al., 2013), but it is also possible that light is the ultimate determinant of the migration depth. Light attenuation is greater in nearshore upwelling-impacted turbid waters than in the oligotrophic blue ocean (Lewis et al., 1988). While there are some debates on what is the major factor that affects the DVM depth (Bianchi et al., 2013), it is generally accepted that the DVM animals dive to escape from visually oriented predators (Lampert, 1989; Hays, 2003). The possible ways to escape visual predation are diving into a certain depth where the light can not reach. In OMZ regions, this depth layer (determined by light attenuation) is located in the core of OMZ. If the migrant organisms is tolerant to suboxic conditions for some time, this has the additional advantage that predators with higher respiratory demand are excluded from this zone. The optimal depth would then be in equal distance to both the upper and the lower oxycline from where potential predators could start their foraging excursions into the OMZ.
4.2 Nitrite vertical distribution in OMZ regions
The distribution of nitrite in the ocean depends on generation mechanisms under different environmental conditions. Generally, nitrite is barely detectable in surface seawater in high oxygenated environment. However, nitrification and phytoplankton release supply the source of nitrite and the unbalance between the ammonium oxidation rate and nitrite oxidation rate accumulate the nitrite, called primary nitrite maximum, in the surface in nanomolar levels (≈
0.01 - 0.4µM/L) (Lomas and Lipschultz, 2006; Dore and Karl, 1996; Lomas and Lipschultz, 2006).
The nitrite occurrence (and processes that lead to its accumulation) is fundamentally differ- ent in oxygen depleted areas (<20muM) called OMZs. At the upper boundary of the OMZ, nitrite accumulation happens as sinking detritus from the surface enters the oxygen depleted environment (Lam et al., 2009, 2011; Buchwald et al., 2015; Beckmann and Hense, 2017).
Nitrate is then used to respire the organic material and nitrite is released. This leads to the generation of the secondary nitrite maximum, which is much more intense than the primary nitrite maximum, reaching maximum concentrations of 8µM/L (Casciotti, 2016; Martin and Casciotti, 2017; Lam et al., 2009; Buchwald et al., 2015). The secondary nitrite maximum occurs via nitrate reduction and ammonium oxidation, but the nitrate reduction is the primary process (Lam et al., 2011).
The secondary nitrite is considered as an important indicator of N loss (Kock et al., 2016;
Kuypers et al., 2005; Babbin et al., 2014; Gruber, 2008). Indeed, the nitrite reduced from nitrate is a important step toward the N loss. However, in some cases, the correlation between accumulation of secondary nitrite and N loss was not significant (Lam et al., 2011). This can be explained by insufficient supply of labile organic matter which fuel the further N loss process
directly via denitrification (N O2>N O>N2O>N2) and indirectly via anammox (N H4 +N O2
>N2) (Lam et al., 2009; Zumft, 1997; Ward, 2013). Also, in the upper boundary of the OMZ where still some oxygen might be available, up to 50% of the reduced nitrite is reoxidized to nitrate, meaning that the N loss may not be directly related to the strength of the secondary nitrite maximum (Buchwald et al., 2015; Beman et al., 2013; Casciotti et al., 2013; F¨ussel et al., 2012; Ganesh et al., 2015).
While the presence of a primary nitrite peak in the euphotic zone and a secondary nitrite peak in the upper boundary of the OMZ are well known, the tertiary nitrite peak we found at a depth range of 200m - 400m was generally overlooked, although it was actually present also in previous observations (Buchwald et al., 2015; Martin and Casciotti, 2017; Casciotti, 2016). We also observed a secondary nitrite maximum at the upper boundary of the OMZ (100m-200m, Fig5b, 5c, 5d), which well follows the previous studies (Buchwald et al., 2015; Beckmann and Hense, 2017; Lam et al., 2011, 2009). The nitrite concentration in the secondary nitrite max- imum ranges between 0 and 10µM/L. The increase of secondary nitrite maximum coincided with decrease of nitrate, which well describe the nitrate reduction to nitrite. However, the ni- trite concentration did not increase further below the upper boundary of OMZ, even though the nitrate concentration seems sufficiently high. This may imply that supply of labile organic matter from the surface is an important factor that drives the secondary nitrite maximum in the upper boundary of the OMZ (Ward, 2013; Zumft, 1997).
However, in regions where an intense OMZ extended from 200 to over 400m depth, we found yet another different shape of the nitrite profile, which featured three distinguishable nitrite maxima. In its typical form, this nitrite profile features the first nitrite maximum in the euphotic zone, the secondary nitrite maximum in the upper OMZ (100m-200m) and a ter- tiary nitrite maximum, which is located between approximately 300 to 400m depth (hereafter tertiary nitrite maximum). The concentration decrease between the secondary and tertiary max- imum may either fall to near-zero (type 3a, Fig.5c), or to intermediate levels in which case the secondary and tertiary maxima are less well separable (type 3b Fig.5d).
In the ETSP, the OMZ core is shallower (150-400 m) than in the Indian Ocean and in the Eastern Tropical North Pacific (Karstensen et al., 2008). The shape of the nitrite profiles off Peru shows is different below 1 µmol kg−1 oxygen (Fig. 5). In offshore regions, where the minimum oxygen concentration exceeds 1µmol kg−1, only a primary nitrite maximum in the euphotic zone is detected (Fig. 6 and 5a). In nearshore regions, where the minimum oxygen concentration is lower than 1µmol kg−1, two or three nitrite maxima (type 2 or 3) were detected (Fig. 5b, 5c, 5d and 6).
In the Arabian Sea, the type 2, type 3a and type 3b observed in north eastern part of the Arabian Sea (Fig.6b), which have been reported as a permanent intense OMZ region having less than 1 µmol kg−1 oxygen (Naqvi, 1991; Morrison et al., 1999). On the other had type 1
located in western part of the Arabian Sea where the well oxygenated water follows (Acharya and Panigrahi, 2016). Thus, in the Arabian Sea, the shape of nitrite profile is highly affected by oxygen concentration.
As nitrite is oxidized rapidly when the oxygen concentration over 1 µmol kg−1 (Bristow et al., 2016), type 2 and type 3 which has less than 1 µmol kg−1 oxygen shows secondary nitrite maximum and tertiary nitrite maximum, but type 1 which has over 1µM/L oxygen does not have secondary or tertiary nitrite maximum. Indeed, it is impossible to detect the secondary nitrite where the minimum oxygen concentration is over 1µmol kg−1 (Fig.6c).
Also, in Fig.10, the tertiary nitrite maximum concentration tends to be higher than the sec- ondary nitrite maximum concentration. This may either be due to the active flux exceeding the passive flux, or by reoxidation of nitrite to nitrate in case of the secondary nitrite maximum.
Below the upper oxycline where the secondary nitrite occurs, approximately 50% of nitrite is reoxidized to nitrate due to the intermittent supplying of oxygen by mixing with surface waters (Buchwald et al., 2015; Beman et al., 2013; Casciotti et al., 2013; F¨ussel et al., 2012; Ganesh et al., 2015). This ventilation of the OMZ core where the tertiary nitrite occurs is extremely sluggish (Czeschel et al., 2011), so that conditions are near-anoxic or anoxic throughout. Con- stant anoxia may inhibit the nitrite reoxidation process, which may result in a higher nitrite concentration in the tertiary compared to the secondary nitrite maximum, and, more impor- tantly, the tertiary nitrite maximum may be more directly related to N loss than secondary nitrite maximum.
4.3 Relationship between the nitrite and DVM
We hypothesized that the active transport of organic matter to the OMZ core by defecation of diurnally migrating organisms contributes the substrate and energy source for denitrifying microorganisms. Therefore we explored the relationship of the DVM depth and the depth of the tertiary nitrite maximum, as well as the peak nitrite concentration and the backscatter strength as a proxy for biomass (Fig. 9c).
The ADCP backscatter signal and tertiary nitrite concentration are positively correlated (Pearson r=0.50, p<0.02)(Fig. 9c). The higher ADCP backscatter signal means the more abun- dant zooplankton biomass (Luo et al., 2000; Heywood et al., 1991), and the more excretion of labile organic matter, which can fuel the denitrification (Hulth et al., 2005; Lam et al., 2009;
Zumft, 1997; Ward, 2013). Nevertheless, variability in the data is high, which may be partly due to the wide nitrite sampling depth intervals. Sampling was normally on standard depths (spaced 50 m apart), so the depth of the tertiary nitrite peak may have been missed by the sampling, and thus the ”maximum” concentration used for the correlation is underestimated by varying amounts for most profiles. For the same reason, it is difficult to determine the exact
depth of the peak. Further, in case that the DVM zooplankton reaches the lower boundary of the OMZ (Wishner et al., 2013), where the oxygen concentration starts to increase, the excreted organic matter may not be used for nitrate reduction, resulting in the lower tertiary nitrite max- imum compared to corresponding biomass (ADCP backscatter signal strength). There was no significant positive correlation between the depth of the maximum ADCP backscatter and the depth of the maximum nitrite concentration (Fig. 9d), although the spatial pattern indicates similarities. In many sites, the depth of the tertiary nitrite maximum is deeper than the depth of the maximum ADCP backscatter signal. Similar phenomenon can be found in (Fig.8), where the particle peak is formed right below the maximum day time ADCP backscatter profile. As (Cavan et al., 2017) already reported, particulate organic matter (POM) needs enough time to be degraded and used by microbial respiration, which results in the remineralization of POM.
Thus, the sinking of particles (fecal pellets) during microbial degradation may lead to a mis- match of the two peaks, with the tertiary nitrite peak deeper than the daytime depth of migrating animals.
During this study, we realised that the tertiary nitrite maximum may be absent even in intense OMZ regions if the daytime depth is deeper than the lower oxycline (where the oxygen concentration increases again over 1 µmol kg−1). Also, detection is hampered if the daytime depth is near the upper oxycline of OMZ. In that case, the secondary and tertiary peak overlap and are difficult to separate.
Further, we expected an increase in the total NOX concentration around the DVM depth, because DVM zooplankton release nitrogen-rich compounds that would end up in the DIN pool due to microbial remineralization. However, there rather a decrease in NOX around the depth to which DVM zooplankton migrated to (Fig. 5, indicative of complete denitrification to dinitrogen (N2). This decrease of NOX concentration was found in the OMZ core (Fig. 5b, 5c, 5d) compared to the NOX profiles from offshore where enough oxygen is available (Fig.
5a), preventing total N loss (NO3>NO2 >N2) by denitrification and anammox (Kuypers et al., 2005; Falkowski, 1997; Thamdrup et al., 2006; Dalsgaard et al., 2012). In anoxic or near-anoxic OMZs, the oxidation of nitrite to nitrate is almost impossible and the increased availability of nitrite may also increase denitrification and anammox rates which eventually lead to a loss of fixed nitrogen in the ocean.
Depth (m)
100
200
300
400
500
(O2 <1uM)OMZ Secondary Nitrite peak caused by sinking particles from surface
Tertiary Nitrite peak caused by DVM animals
Nitrite Oxygen NO3
NO2
(E.A)
NO3 NO2
(E.A)
Fig. 11Conceptual model of the nitrite distribution in an oceanic OMZ. The primary nitrite maximum occurs in the euphotic zone due to the remineralization of organic nitrogen and bacterial nitrification.
The secondary and tertiary nitrite maximum occur due to the detritus supply from the euphotic zone and from DVM zooplankton, respectively. The microbial community adapted to anoxic conditions uses the detritus as an energy source. They use nitrate as an electron acceptor (E.A) instead of oxygen and produce nitrite as a by-product.
Further studies in tertiary nitrite maximum and DVM zooplankton need to clarify the following questions. 1) Comparison between ADCP backscatter signal and corresponding biomass. Thus, the estimation of zooplankton biomass via the ADCP backscatter signal still needs some work to clarify the relationship of zooplankton biomass and ADCP backscatter sig- nal. 2) The amount of excretion of organic matter via DVM zooplankton in OMZ. As excreted organic matter is a crucial source to fuel the denitrification process in OMZ, it is necessary to estimate the amount of excreted organic matter via DVM zooplankton when they are located in
OMZ. This is important for the N loss process, because the environment where DVM zooplank- ton dive has constant intense oxygen concentration, driving even more intense denitrification process than in upper boundary OMZ.
Conclusion
Oxygen minimum zone regions are considered remarkable environments due to the multi- ple impacts of hypoxia on metazoan and microbial communities and metabolic processes. The lack of oxygen directly affects the nutrient composition by altering the oxidation process and metabolic processes of the microbial community. Indeed, the secondary nitrite maximum oc- curring at the upper boundary of the OMZ is supported by altered biogeochemical processes under anoxia or near-anoxia. However, the effect of low oxygen on active transport of organic and inorganic matter to midwater by DVM zooplankton is still somewhat unclear. For this reason, this study explored the relationship between the DVM zooplankton and nutrient com- position, especially nitrite, as an intermediate compound of the nitrogen cycle. A tertiary nitrite maximum, which is separable from the secondary nitrite maximum was observed in mid water depth where almost anoxic conditions are found. Further, the acoustic backscatter (indicative of biomass) of DVM zooplankton and the amount of tertiary nitrite maximum was positively correlated, and the tertiary nitrite maximum occurred slightly below the DVM depth. In terms of the nutrient composition, the coincidence of increasing nitrite, and decreasing nitrate may indicate that nitrate is converted to nitrite. Also, the NOX decreasing in OMZ’s mid water depth may indicate the N loss by denitrification and anammox process. We therefore conclude that migrating zooplankton may substantially contribute to fuelling N loss processes within the OMZ by releasing energy-rich organic material directly in the OMZ core, thereby short-cutting the sinking/remineralization curve. Further process studies are needed to assign microbial pro- cesses and rates to zooplankton feces as well as to better constrain gut flux at depth.
REFERENCES
Acharya, S. S. and M. K. Panigrahi (2016). Eastward shift and maintenance of Arabian Sea oxygen minimum zone: Understanding the paradox.Deep-Sea Research Part I: Oceanographic Research Papers 115(July 2016), 240–252.
Antezana, T. (2009, 2). Species-specific patterns of diel migration into the Oxygen Minimum Zone by euphausiids in the Humboldt Current Ecosystem. Progress in Oceanography 83(1-4), 228–236.
Ashjian, C. J., S. L. Smith, C. N. Flagg, and N. Idrisi (2002). Distribution, annual cycle, and vertical migration of acoustically derived biomass in the Arabian Sea during 1994-1995.
Deep-Sea Research Part II: Topical Studies in Oceanography 49(12), 2377–2402.
Babbin, A. R., R. G. Keil, A. H. Devol, and B. B. Ward (2014, 4). Organic matter stoichiometry, flux, and oxygen control nitrogen loss in the ocean.Science (New York, N.Y.) 344(6182), 406–8.
Beckmann, A. and I. Hense (2017, 9). The impact of primary and export production on the formation of the secondary nitrite maximum: A model study. Ecological Modelling 359, 25–
33.
Beman, J. M., J. Leilei Shih, and B. N. Popp (2013, 11). Nitrite oxidation in the upper water column and oxygen minimum zone of the eastern tropical North Pacific Ocean. ISME Jour- nal 7(11), 2192–2205.
Bianchi, D., E. D. Galbraith, D. A. Carozza, K. A. Mislan, and C. A. Stock (2013, 7). In- tensification of open-ocean oxygen depletion by vertically migrating animals. Nature Geo- science 6(7), 545–548.
Bianchi, D. and K. A. S. Mislan (2016, 2). Global patterns of diel vertical migration times and velocities from acoustic data: Global patterns of diel vertical migration. Limnology and Oceanography 61(1), 353–364.
Brandhorst, W. (1958). Nitrite accumulation in the North-East Tropical Pacific. Na- ture 182(4636), 679.
Brewer, P. G., A. F. Hofmann, E. T. Peltzer, and W. Ussler (2014). Evaluating microbial chemical choices: The ocean chemistry basis for the competition between use of O2 or NO3- as an electron acceptor.Deep-Sea Research Part I: Oceanographic Research Papers 87, 35–42.
Brinton, E. (1962). The distribution of Pacific euphausiids. UNIVERSITY OF CALIFORNIA PRESS, 225.
Brinton, E. (1979, 2). Parameters relating to the distributions of planktonic organisms, espe- cially euphausiids in the eastern tropical Pacific. Progress in Oceanography 8(3), 125–189.
Bristow, L. A., T. Dalsgaard, L. Tiano, D. B. Mills, A. D. Bertagnolli, J. J. Wright, S. J. Hallam, O. Ulloa, D. E. Canfield, N. P. Revsbech, and B. Thamdrup (2016, 9). Ammonium and nitrite oxidation at nanomolar oxygen concentrations in oxygen minimum zone waters. Proceedings of the National Academy of Sciences of the United States of America 113(38), 10601–6.
Buchwald, C., A. E. Santoro, R. H. R. Stanley, and K. L. Casciotti (2015, 12). Nitrogen cycling in the secondary nitrite maximum of the eastern tropical North Pacific off Costa Rica. Global Biogeochemical Cycles 29(12), 2061–2081.
Casciotti, K. L. (2016, 11). Nitrite isotopes as tracers of marine N cycle processes. Philo- sophical Transactions of the Royal Society A: Mathematical, Physical and Engineering Sci- ences 374(2081), 20150295.
Casciotti, K. L., C. Buchwald, and M. McIlvin (2013, 10). Implications of nitrate and nitrite isotopic measurements for the mechanisms of nitrogen cycling in the Peru oxygen deficient zone. Deep-Sea Research Part I: Oceanographic Research Papers 80, 78–93.
Cavan, E. L., M. Trimmer, F. Shelley, and R. Sanders (2017). Remineralization of particulate organic carbon in an ocean oxygen minimum zone. Nature Communications 8(May 2016), 1–9.
Chavez, F. P. and M. Messi´e (2009, 12). A comparison of Eastern Boundary Upwelling Ecosys- tems. Progress in Oceanography 83(1-4), 80–96.
Clemens, S., W. Prell, D. Murray, G. Shimmield, and G. Weedon (1991). Forcing mechanisms of the Indian Ocean monsoon. Nature 353(6346), 720–725.
Codispoti, L. and J. Christensen (1985, 7). Nitrification, denitrification and nitrous oxide cy- cling in the eastern tropical South Pacific ocean. Marine Chemistry 16(4), 277–300.
Codispoti, L. A., G. E. Friederich, T. T. Packard, H. E. Glover, P. J. Kelly, R. W. Spinrad, R. T.
Barber, J. W. Elkins, B. B. Ward, F. Lipschultz, and N. Lostaunau (1986, 9). High nitrite levels
off northern Peru: A signal of instability in the marine denitrification rate. Science 233(4769), 1200–1202.
Czeschel, R., L. Stramma, F. U. Schwarzkopf, B. S. Giese, A. Funk, and J. Karstensen (2011, 1). Middepth circulation of the eastern tropical South Pacific and its link to the oxygen mini- mum zone. Journal of Geophysical Research 116(C1), C01015.
Dalsgaard, T., B. Thamdrup, L. Far´ıas, and N. P. Revsbech (2012, 9). Anammox and denitrifi- cation in the oxygen minimum zone of the eastern South Pacific. Limnology and Oceanogra- phy 57(5), 1331–1346.
Darnis, G., L. Hobbs, M. Geoffroy, J. C. Grenvald, P. E. Renaud, J. Berge, F. Cottier, S. Kris- tiansen, M. Daase, J. E. Søreide, A. Wold, N. Morata, and T. Gabrielsen (2017, 7). From polar night to midnight sun: Diel vertical migration, metabolism and biogeochemical role of zoo- plankton in a high Arctic fjord (Kongsfjorden, Svalbard).Limnology and Oceanography 62(4), 1586–1605.
Dore, J. E. and D. M. Karl (1996, 12). Nitrification in the euphotic zone as a source for nitrite, nitrate, and nitrous oxide at Station ALOHA.Limnology and Oceanography 41(8), 1619–1628.
Falkowski, P. G. (1997, 5). Evolution of the nitrogen cycle and its influence on the biological sequestration of CO2 in the ocean. Nature 387(6630), 272–275.
Fowler, S. W. and L. F. Small (1972, 2). Sinking Rates of Euphausiid Fecal Pellets. Limnology and Oceanography 17(2), 293–296.
F¨ussel, J., P. Lam, G. Lavik, M. M. Jensen, M. Holtappels, M. G¨unter, and M. M. Kuypers (2012, 6). Nitrite oxidation in the Namibian oxygen minimum zone. ISME Journal 6(6), 1200–1209.
Ganesh, S., L. A. Bristow, M. Larsen, N. Sarode, B. Thamdrup, and F. J. Stewart (2015, 12).
Size-fraction partitioning of community gene transcription and nitrogen metabolism in a marine oxygen minimum zone. ISME Journal 9(12), 2682–2696.
Gilly, W. F., J. M. Beman, S. Y. Litvin, and B. H. Robison (2013, 1). Oceanographic and Biological Effects of Shoaling of the Oxygen Minimum Zone. Annual Review of Marine Sci- ence 5(1), 393–420.
Gruber, N. (2008). The Marine Nitrogen Cycle. InNitrogen in the Marine Environment, pp.
1–50. Elsevier.
Hays, G., R. Harris, and R. Head (1997, 1). The vertical nitrogen flux caused by zooplankton diel vertical migration. Marine Ecology Progress Series 160, 57–62.