I
roles in nitrate and nitrite reduction
Inaugural-Dissertation zur Erlangung des Doktorgrades
der Mathematisch-Naturwissenschaftlichen Fakultät der Universität zu Köln
vorgelegt von
Marie Agatha Mohn aus Borrisokane, Irland
Köln, März 2019
II
Berichterstatter: Prof. Dr. Guenter Schwarz Gutachter Prof. Dr. Stanislav Kopriva
Tag der mündlichen Prüfung: 17
thApril 2019
III
Dedicated to my family in thanks for their support
IV
Publications
2019 Marie Mohn, Besarta Thaqi, and Katrin Fischer-Schrader. Isoform-
specific NO synthesis by Arabidopsis thaliana nitrate reductase.Plants Special Edition NO
Conference participation, poster contributions
2017 Marie Mohn, Katrin Fischer-Schrader.
Biochemical characterization of plant nitrate reductase isoform 1. MoTEC X, Santa Fe, USA, June 20172018 Marie Mohn, Katrin Fischer-Schrader. Biochemical characterization and
comparison of isoform 1 and 2 Arabidopsis thaliana nitrate reductase.
Chemistry symposium, Department of Chemistry, University of Cologne, April 2018
2018 Marie Mohn, Besarta Thaqi, Dimitri Niks, Russ Hille, Katrin Fischer- Schrader. Biochemical characterization of plant nitrate reductase isoform
1 and 2 in nitric oxide synthesis. 10th International Conference on theBiology, Chemistry and Therapeutic Applications of Nitric Oxide, Oxford, UK, September 2018
2018 Marie Mohn, Besarta Thaqi, Dimitri Niks, Russ Hille, Katrin Fischer-
Schrader.
Isoform specific function of nitrate reductase 1 and 2 in Arabidopsis thaliana. 7th Plant Nitric Oxide International Meeting, Nice,France, October 2018
V Table of contents
List of Figures ... VIII List of Tables ... IX Abbreviations ... X Zusammenfassung ... XII Abstract ... XIII
1 Introduction ... 1
1.1 Nitrogen ... 1
1.2 Ammonium or nitrate? ... 1
1.3 Nitrate as a nutrient ... 2
1.3.1 Nitrate uptake by plants ... 2
1.3.2 Nitrate assimilation ... 3
1.4 Nitrate as a signal ... 3
1.5 Nitric oxide in plants ... 5
1.5.1 Sources of NO• ... 5
1.5.2 Biological functions of NO• ... 7
1.5.3 Mechanism(s) of action of NO• ... 8
1.6 The enzyme nitrate reductase ... 9
1.6.1 Structure of NR ... 10
1.6.2 Electron transport in NR ... 12
1.6.3 Functional domain fragments of NR ... 13
1.6.4 Isoforms of NR ... 14
1.6.4.1 Transcriptional differences between NR isoforms ... 14
1.6.4.2 Differences between NR isoforms on the protein level ... 17
1.6.5 Regulation of NR ... 20
1.6.5.1 Regulation of NR in nitrate reduction ... 20
1.6.5.2 Regulation of NR in nitrite reduction ... 23
1.6.5.3 14-3-3 proteins ... 23
1.7 Aim of this project ... 26
2 Results ... 27
2.1 Production of full-length AtNR ... 27
2.1.1 Expression of AtNR1-fl in KM71 ... 27
2.1.2 Expression of codon-optimized AtNR1-fl in KM71 ... 28
2.1.3 Expression of codon-optimized AtNR1-fl in GS115 ... 30
2.1.4 C-terminal His-tagged AtNR1-co fl ... 32
2.1.5 Full-length NR2 ... 34
VI
2.2 Production of functional domain fragments of AtNR ... 36
2.2.1 Expression and purification of AtNR1-Mo-heme ... 36
2.2.2 Expression of AtNR-FAD fragments ... 39
2.2.3 Expression of AtNR-Mo fragments ... 39
2.3 Other constructs cloned for expression in P. pastoris ... 41
2.4 Nitrate reduction activity of recombinant NR ... 42
2.4.1 NADH:nitrate activity of full-length NR ... 42
2.4.2 The methyl viologen:nitrate activity of NR-Mo-heme ... 43
2.5 Re-constitution of full-length NR-activity from domain fragments ... 46
2.5.1 Establishing re-constituted NR activity ... 46
2.5.2 NADH:nitrate activity of re-constituted-NR ... 47
2.5.3 Pre-steady-state kinetics of NR1 and NR2 in nitrate reduction using re-constituted NR activities 48 2.6 Nitrite reducing activity of recombinant NR ... 52
2.6.1 Establishing a procedure for benzyl viologen nitrite activity determination (BV:nitrite) 52 2.6.2 NR-Mo-heme BV:nitrite activity ... 54
2.6.3 Nitrite reductase activity measured with an NO-Analyzer ... 55
2.6.4 Interplay of nitrate and nitrite as substrates of NR... 58
2.6.5 Stoichiometry of NO• generation ... 60
2.7 Regulation of NR by 14-3-3 proteins ... 62
2.7.1 Regulation of NR activity of NR1 and NR2 ... 62
2.7.2 Regulation of nitrite reductase activity of NR1 and NR2 ... 65
2.8 Structure model of NR ... 68
3 Discussion ... 71
3.1 Recombinant NR expression ... 71
3.2 Functional domain fragments of NR ... 73
3.2.1 Nitrate reduction activity of NR-Mo-heme fragments ... 75
3.2.2 Nitrite reduction activity of NR-Mo-heme fragments ... 76
3.2.3 A comparison of NR isoforms from Arabidopsis and Soybean ... 80
3.3 Reconstitution of full-length NR activity ... 80
3.4 Pre-steady-state kinetics ... 82
3.5 Nitrite reduction activity with the nitric oxide analyzer ... 83
3.6 Stoichiometry of NO• generation by NR ... 86
3.7 14-3-3-mediated inhibition of NR1 and NR2 ... 86
3.8 Structure model of NR ... 88
4 Conclusion and outlook ... 90
VII
5 Materials and Methods ... 92
5.1 DNA cloning ... 92
5.2 Yeast methods ... 94
5.3 Full-length NR expression in Pichia and affinity purification ... 97
5.4 Recombinant protein expression in E. coli ... 99
5.5 Other biochemical techniques ... 102
5.6 Enzyme activity measurements ... 103
6 References ... 108
Appendix 1 ... 121
Appendix 2 ... 126
Appendix 3 ... 132
Acknowledgements ... 133
Erklärung ... 134
VIII
List of Figures Page
Figure 1 Schematic illustration of a plant cell showing nitrate uptake and
assimilation. 2
Figure 2 Schematic representation of the domain structure of NR 10
Figure 3 Model of NR structure 12
Figure 4 Comparison of NIA1 and NIA2 expression in publicly available
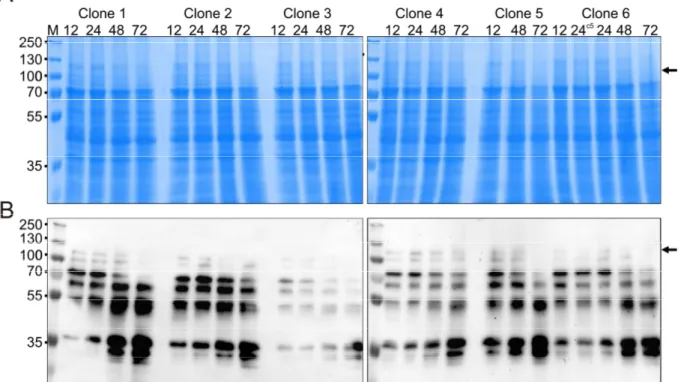
transcriptomics data for wild type Arabidopsis 15 Figure 5 Factors influencing NR1 and NR2 expression and activity in A. thaliana 16 Figure 6 Model of inhibition of NR by 14-3-3 proteins 22 Figure 7 Structure model of 14-3-3ω from A. thaliana 24 Figure 8 Clone selection of P. pastoris KM71 transformed with (natural) AtNR1
DNA for expression 28
Figure 9 Clone selection of P. pastoris KM71 transformed with the codon- optimized AtNR1 DNA for expression
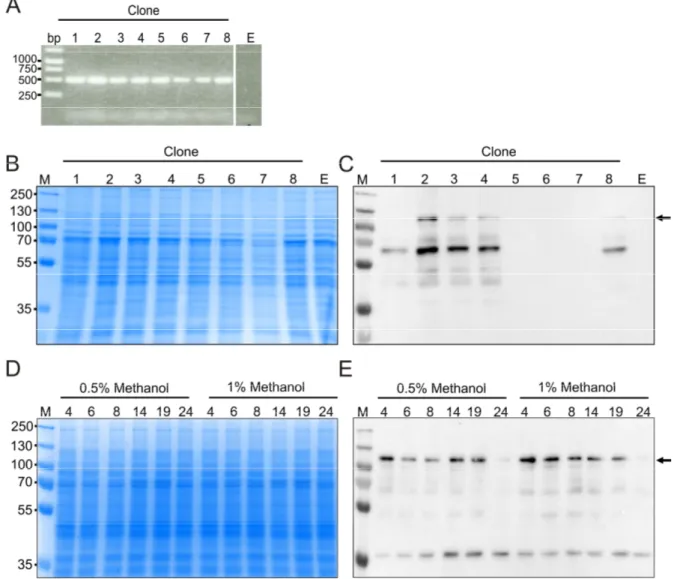
30 Figure 10 Clone selection of P. pastoris GS115 with the codon-optimized AtNR1
DNA for expression 31
Figure 11 Absence of binding to Ni-NTA resin by AtNR1-co expressed Pichia pastoris GS115
32 Figure 12 Expression in Pichia pastoris GS115 and purification of AtNR1-co with C-
terminal his-tag 34
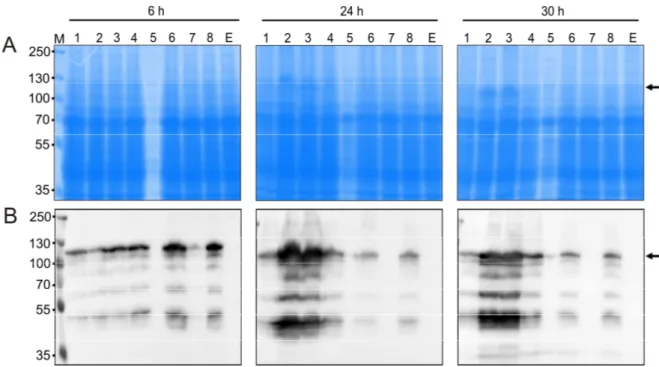
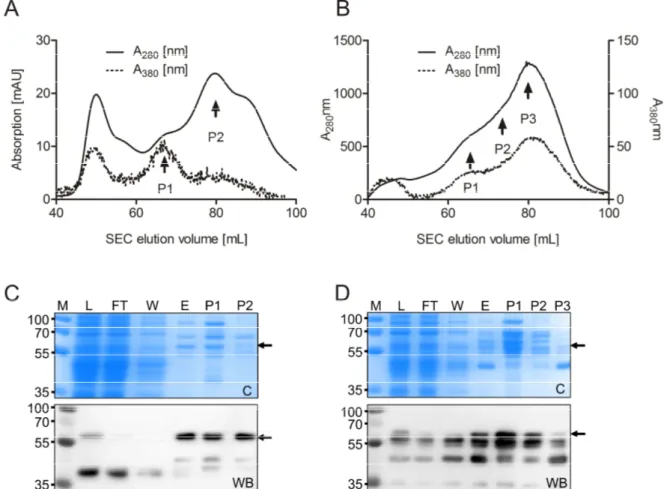
Figure 13 Purification of full-length NR2 expressed in P. pastoris KM71 35 Figure 14 Purification of NR-Mo-heme fragments expressed in E. coli TP1004 38 Figure 15 Purification FAD-domain fragments of NR1 and NR2 39 Figure 16 Purification NR-Mo-domain fragments of NR1 and NR2 40 Figure 17 NADH:nitrate activity of full-length NR1 and NR2 expressed in P. pastoris 43 Figure 18 MV:nitrate reduction activity of NR1-Mo-heme and NR2-Mo-heme 45 Figure 19 NADH:nitrate activity of re-constituted full-length NR1 and NR2 47 Figure 20 Pre-steady-state kinetic measurements of nitrate reduction by NR2 50 Figure 21 Pre-steady-state kinetic measurements of nitrate reduction by NR1 52 Figure 22 Stability of MV and BV in the presence of nitrate and nitrite.
Determination of optimal pH for measuring BV:nitrite activity 53 Figure 23 BV:nitrite steady-state activity measurement 55 Figure 24 Substrate concentration dependent NO• generation measured using the
NO-analyzer 57
Figure 25 Interplay of nitrate and nitrite on NO• generation 59 Figure 26 Stoichiometry of NO• generation by pre-reduced NR2-Mo-heme 61
IX
List of Tables Page
Table 1 List of constructs cloned for expression in P. pastoris 41 Table 2 Michaelis Menten kinetic parameters of NR1 and NR2 NADH:nitrate
activity 43
Table 3 Kinetic constants for MV:nitrate activity using NR-Mo-heme fragments 45 Table 4 Michaelis Menten kinetic parameters for NADH:nitrate activity of re-
constituted NR1 and NR2 48
Table 5 Michaelis Menten kinetic parameters of BV:nitrite activity for NR1-Mo-
heme and NR2-Mo-heme 55
Table 6 Pseudo Michaelis Menten kinetic parameters of NR1-Mo-heme and NR2-
Mo-heme determined using the NO analyzer 57
Table 7 NR1-Mo-heme and NR2-Mo-heme summarized 14-3-3 inhibition-kinetic
parameters 65
Table 8 Kinetic parameters for NR1- and NR2-Mo-domain and NR2-H600A heme
free mutant 68
Figure 27 Phosphorylation of NR1-Mo-heme by CPK3 kinase and MV:nitrate
activity measurement 62
Figure 28 Inhibition of MV:NR activity by 14-3-3 isoforms 64 Figure 29 Test of 14-3-3 inhibition of BV:nitrite activity 67 Figure 30 Cryo-EM for determination of molecular structure of NR2 70 Figure 31 Substrate binding funnel of NR1 and NR2 compared in models based on
Pichia angusta NR-Moco crystal structure 76
Figure 32 Chemical structures of Methyl viologen (MV) and benzyl viologen (BV)
each shown with its single electron reduced radical 77
X
Abbreviations
Abbreviation Definition Abbreviation Definition
ABA Abscisic acid mM millimolar
[M] Molar concentration mm millimeter
AHA2 Arabidopsis plasma membrane
H+-ATPase isoform 2 MM Michaelis Menten
At Arabidopsis thaliana MMH Minimal methanol medium
ATH1 Arabidopsis genome array Mo Molybdenum
Atnoa1 Arabidopsis thaliana nitric oxide
associated 1 mutant plant Moco Molybdenum cofactor Atnos1 Arabidopsis thaliana nitric oxide
synthase 1 mutant plant mRNA messenger RNA ATP Adenosine triphosphate MS Mass Spectrometry
BH4 Tetrahydro-biopterin mV Millivolt
BMMY Buffered methanol medium
yeast extract (complex) MV
Methylviologen (N,N′- dimethyl-4,4′-bipyridinium dichloride)
bp Base pairs of DNA mV Millivolt
BSA Bovine serum albumin MW Molecular weight
BV Benzyl viologen n.d. not determined
Ca++ Calcium ions N2 Nitrogen
CaCl2 Calcium chloride NaCl Sodium Chloride
cDNA copy DNA NADH Nicotinamide adenine
dinucleotide
CO Codon optimized NADPH Nicotinamide adenine
dinucleotide (phosphate)
CO2 Carbon dioxide NaOH Sodium hydroxide
CPK Calcium-dependent protein
kinase family NEB New England Biolabs
CPK3-GST
Calcium dependent protein kinase with Glutathione S Transferase tag
NH4+ Ammonium
Cryo-EM Cryo Electron microscopy NIA The gene for nitrate reductase
CSO Chicken sulfite oxidase nia1 Mutant defective in NIA1 gene
ddH2O distilled, deionized water nia2 Mutant defective in NIA2 gene
DMSO Dimethyl Sulfoxide Ni-NTA Nickel Nitrilotriacetic acid DNA Deoxyribonucleic acid NiR Nitrite reductase
E. coli Escherichia coli NLP Nodule inception-like
proteins ECL Enhanced chemiluminescence nm Nanometer EDTA Ethylenediaminetetraacetic acid NO• Nitric oxide Ɛ413 Extinction coefficient at 413nm NO2- Nitrite FAD Flavin adenine dinucleotide NO3- Nitrate
FeMoco Iron-Molybdenum cofactor NOG Nitric oxide generating
Fig Figure NOS Nitric oxide synthase
FL Full-length NR Nitrate reductase
FMN Flavine mono nucleotide NR-Mo-heme Molybdenum-heme domain fragment of NR
XI
GE General electric NUE Nitrogen use efficiency
GOGAT Glutamate synthase O2 Molecular oxygen
GS Glutamine synthetase O2•- Superoxide anion
GSH Glutathione OD Optical density
GSNO S-Nitrosoglutathione Os Oryza sativa
GTP Guanosine triphosphate PAGE Polyacrylamide gel electrophoresis
h hour PCR Polymerase chain reaction
H+ Hydrogen ion/ Proton PDB Protein Data Bank
H+ATPase
Proton Adenosine triphosphate- ase (Cell membrane proton pump)
PEG Polyethylene glycol H2O2 Hydrogen peroxide PNR Primary nitrate response
H2S Hydrogen sulfide pNR phosphorylated nitrate
reductase
HATS High affinity transport system PP2A Protein phosphatase 2
HCl Hydrochloric acid pSer Phosphorylated serine
His Histidine RNA Ribonucleic acid
HRP Horse radish peroxidase ROS Reactive oxygen species IC50 Inhibitory concentration leading
to half maximal activity RT Room temperature
ID Identify S Sulfur
IMAC Immobilized metal affinity
chromatography s / sec second
IPTG Isopropyl β-D-1-
thiogalactopyranoside SA Salicyclic acid
kcat Enzyme turnover number SDS Sodium dodecyl sulfate
KCl Potassium chloride SEC Size exclusion
chromatography
KD Dissociation constant SEM Standard error of the mean
kDa Kilo Dalton Ser Serine
KM Michaelis constant SNF Sucrose non-fermenting
kobs Observed rate of re-oxidation SNRK1 SNF1 resembling kinase family
kox Reoxidation constant SO Sulfite oxidase
KPO4 Potassium phosphate buffer So Spinacia oleracea LATS Low affinity transport system t1/2 Half-life
LB Lauria bertani medium TA Annealing temperature
M Molar TAE Tris Acetate EDTA buffer
mARC mitochondrial amidoxime
reducing component UV/vis UV/visible
MCS Multiple cloning site wt Wild type
Mg++ Magnesium ions XOR Xanthine oxidoreductase
MgAc Magnesium acetate YPD Yeast peptone dextrose
medium
min minute YPDS Yeast peptone dextrose
sorbitol medium
ABA Abscisic acid mM millimolar
[M] Molar concentration mm millimeter
AHA2 Arabidopsis plasma membrane
H+-ATPase isoform 2 MM Michaelis Menten
At Arabidopsis thaliana MMH Minimal methanol medium
XII
Zusammenfassung
Viele Pflanzen, unter anderem Arabidopsis thaliana, exprimieren zwei Isoformen der Nitrat Reduktase (NR1 und NR2). Dieses Enzym katalysiert die Reduktion des Nitrats zu Nitrit, und damit die schrittlimitierende Reaktion in der Nitratassimilation. Zudem ist NR eine wichtige enzymatische Quelle des universellem Signalmoleküls NO
•.
NR bildet ein Dimer mit drei redox-Cofactoren je monomer; am N-Terminus, ein Molybdän-Cofactor (Moco), in der Mitte eine Häm-b5 und am C-Terminus ein FAD Cofactor. Elektronen werden übertragen vom zellulärem NADH, über FAD und Häm zu dem Substrat, das von Moco reduziert wird.
Die Regulierung der NR Aktivität ist komplex und vielschichtig. Tagsüber wird die Transkription hochreguliert, angepasst an der photosynthetesischen Aktivität, nachts wird es herunterreguliert. Zudem wird NR über ein komplexes System der post- translationalen Regulation gesteuert in dem ein regulatorisches 14-3-3 Protein an einem phosphorylierten Serin-Rest bindet und Domän-Bewegungen und damit Aktivität verhindert. Diese Form der Regulierung ist schnell und reversible und verhindert ein toxischen Überschuss an Nitrit. Interessanterweise ist es in genau diesen Situationen in denen die Nitrit-Konzentration kurzfristig steigt, in welchen NO
•Produktion beobachtet wird.
Obwohl es bekannt ist, dass NR in der Pflanze eine wichtige Quelle für NO
•ist, wurden die kinetischen Parameter der Nitritreduktion durch rekombinante NR noch nicht untersucht. Zudem wurde noch nicht untersucht ob die zwei (oder mehr) Isoformen der NR vielleicht unterschiedlich beteiligt sein könnten an den zwei Reaktionen die das Enzym katalysiert.
In dieser Arbeit wurden die zwei Isoformen der NR rekombinant exprimiert und in
verschiede kinetische Analysen verglichen. Es konnte gezeigt werden, dass NR1
einen hohen K
Mfür Nitrat besitzt und eine vielfach niedrigere katalytische Effizienz für
das Substrat Nitrat, verglichen mit NR2. In der Nitritreduktion hat NR1 ein etwa 10-fach
höherem
kcatverglichen mit NR2. Zudem wurden Unterschiede zwischen den
Isoformen in der 14-3-3 Regulation festgestellt. Diese Ergebnisse zeigen dass NR1
ein spezializiertes Enzym der Nitrit-Reduktion ist, während NR2 eine Nitrat Reduktase
ist. Zudem wurde mittels cryo-EM ein Model der NR generiert. Diese Methode könnte
in Zukunft helfen die Molekularstruktur des NR’s zu ermitteln.
XIII
Abstract
Many plants, including the model plant Arabidopsis thaliana, express two isoforms of the enzyme nitrate reductase (NR1 and NR2). This enzyme catalyses the first and rate- limiting step of nitrate assimilation by conversion of nitrate to nitrite. Furthermore, by reduction of nitrite to NO
•, NR is also a major enzymatic source of this universally important signalling molecule in the plant.
NR is a large, dimeric, multi-domain protein containing three redox-active cofactors per monomer – a Moco at the N-terminus, a b5-type heme located centrally, and an FAD cofactor at the C-terminus. NR transfers electrons from the cellular electron donor NADH through the FAD cofactor, then the heme, to the Moco where the substrates nitrate or nitrite bind and are reduced.
Regulation of NR activity is complex and takes place on multiple levels. Transcriptional regulation mainly functions to serve the diurnal requirement for NR in the plant with up- regulation to match photosynthetic activity during daylight, and down-regulation at night. In addition, a complex post-translational regulation mechanism for NR is known in which a regulatory 14-3-3 protein binds to a phosphorylated serine and arrests domain movement and activity. This means of regulation is fast and reversible allowing the plant to respond within minutes to darkness or lack of CO
2and avoid long-term, toxic nitrite accumulation. On the other hand, there is evidence, that in situations in which a short-term spike in nitrite concentration is observed, NO
•generation occurs.
The kinetic parameters for nitrite reduction have never been determined before for pure recombinant NR protein. In addition, it has not been tested, whether the two or multiple isoforms of NR in many plant species may have distinct catalytic roles in the plant.
To examine these questions, the two NR isoforms of
Arabidopsis were separatelyexpressed and compared in multiple kinetic studies. It could be shown that NR1 has a
very large K
Mfor nitrate and a far lower catalytic efficiency compared with NR2, while
NR1 has a 10-fold higher
kcatfor nitrite and a five-fold higher catalytic efficiency
compared with NR2. Additionally, differences were observed in the post-translational
regulation of NR1 and NR2 via 14-3-3 proteins. These results show that NR2 is a
dedicated nitrate reductase and NR1 a nitrite reductase. In addition, a model of the NR
structure could be obtained by cryo-EM and this method offers a promising possibility
to determine the molecular structure of NR in the future.
1
1.1 Nitrogen
Nitrogen is the fourth-most abundant structural element of living organisms after carbon, oxygen and hydrogen. The earth’s atmosphere is composed of about 78%
nitrogen gas, but in this triple-bonded N
2form it is extremely inert and requires energetically expensive fixation before it can be used by lifeforms (Erisman et al., 2008). In the natural nitrogen cycle, only bacteria containing nitrogenase enzymes (diazotrophs) are capable of fixing gaseous nitrogen into the inorganic forms that can be used by plants (besides an additional small amount of nitrogen fixed by lightning in the atmosphere) (Canfield et al., 2010). This means that plants growing on natural soils are frequently limited in their growth due to low nitrogen availability (Vitousek and Howarth, 1991). The discovery in 1908 of the Haber Bosch process for industrial nitrogen fixation has massively boosted crop productivity worldwide by provision of fixed inorganic nitrogen to plants for food production (Smil, 2002, 2011). Nitrogen compounds within plants – mainly generated by uptake and conversion of nitrate and ammonium into organic forms – represent the main source of organic nitrogen for heterotrophic organisms (Beevers and Hageman, 1983).
1.2 Ammonium or nitrate?
The two main sources of nitrogen nutrients available in the soil for plant growth are
ammonium (NH
4+) and nitrate (NO
3-) (Miller et al., 2007). Ammonium requires less
energy for plants to incorporate it into amino acids, however, excess NH
4+is in fact
toxic to many plant species because it causes an energetically expensive transport
cycling into and out of the cell (Britto et al., 2001). Certain plant species such as rice
which grows on lowland, water-logged soils preferentially uptakes ammonium and is
resistant to ammonium toxicity (Kronzucker et al., 2000). Nevertheless, even for rice,
a strong benefit in growth and productivity is seen when nitrate is also available
(Kronzucker et al., 2000). The vast majority of higher plant species growing in aerobic
temperate soils including most agricultural crop plant species use nitrate as the
preferred source of nutrient nitrogen (Wang and Macko, 2011).
2
1.3 Nitrate as a nutrient
1.3.1 Nitrate uptake by plants
The availability of nitrate in the soil can vary widely from <1 mM up to 70 mM in heavily fertilized agricultural soil (Crawford and Glass, 1998; Forde and T. Clarkson, 1999).
Uptake of NO
3-into the plant root cells is an active process. Specialized transporter proteins have evolved to fulfil this function in both cases of low nitrate supply (High affinity nitrate transporters, HATS) and high nitrate supply (low affinity nitrate transporters, LATS) (Miller et al., 2007) (Fig. 1). The nitrate transporter proteins efficiently capture available nitrate and transport it into the cells in a system in which H
+ions are simultaneously transported in (Buchanan et al., 2015). H
+ions for this uptake are maintained at a locally high concentration outside the cell by the action of the membrane H
+-ATPase (Michelet and Boutry, 1995). Once inside the cytosol, nitrate may follow one of several pathways: Firstly, it may immediately be reduced to nitrite by the enzyme NR as discussed in detail in the coming sections or secondly, it may be stored in the vacuole. Alternatively, it may be exported into the xylem and translocated to aerial plant cells where it may be stored in the vacuole or assimilated.
Figure 1: Schematic illustration of a plant cell showing nitrate uptake and assimilation. Proton
ATPase AHA2 is shown using its crystal structure (PDB 5ksd) (Focht et al., 2017), it functions in maintaining an excess of protons outside the cell for symport of NO3- into the cell.
HATS and LATS are the high- and low- affinity nitrate transporters. Inside the cell NO3- is reduced to NO2- in the cytoplasm then
transported to the plastids for further assimilation, or is stored in the vacuole or loaded in the xylem for transport to other plant parts.
3
1.3.2 Nitrate assimilation
The first committed step of nitrate assimilation in the plant cytosol is the reduction of nitrate to nitrite by the enzyme NR (Campbell, 2001). This enzyme was first recognised and partially purified from soybean in 1953 (Evans and Nason, 1953). The two electrons required for reduction of nitrate are supplied in the plant by either NADH or NADPH. Some plants have a bispecific NADH/NADPH NR such as barley (Dailey et al., 1982), rice (Shen, 1972) and sobean (Dean and Harper, 1988) but the majority of higher plants utilize only NADH. There was a clear allocation in one study, with 15 of 16 NRs tested using the substrate NADH (Ritenour et al., 1967). The reaction catalysed is as follows:
NO
3-+ NAD(P)H + H
+ NO
2-+ NAD(P)
++ H
2O
The nitrite thus formed is rapidly transported to the plastids (in roots) or to the chloroplasts (in leaves) for assimilation. Further reduction of nitrite to ammonium in the plastid requires six electrons which, originate from photosynthetic activity and are supplied in the form of reduced ferredoxin (Solomonson and Barber, 1990). Finally, the ammonium is coupled to the carbon skeleton of a glutamate (also a product of photosynthesis) by the enzyme glutamine synthetase to yield glutamine. Glutamate oxoglutarate aminotransferase then transfers the alpha amino group to 2-oxoglutarate to yield two molecules of glutamate (Masclaux-Daubresse et al., 2006).
Transamination reactions result in the formation of all the nitrogenous compounds required by the plant (Lam et al., 1996). The need for carbon skeletons and electrons derived from photosynthesis mean that nitrogen assimilation ultimately depends on photosynthesis. In fact, it is estimated that 25% of the energy of photosynthesis is used for nitrogen assimilation (Solomonson and Barber, 1990).
1.4 Nitrate as a signal
Besides the primary role of nitrate as a nutrient for plants, nitrate is also a powerful signalling molecule that controls many aspects of plant growth and development, (reviewed in Fredes et al., 2019). In fact, a report in 1983 about the effects of nitrate seen on plants led the author to describe nitrate as a ‘plant hormone’ (Trewavas, 1983).
Meanwhile, the pathways and processes that are controlled by nitrate have been
extensively examined and many details understood. Nitrate effects on the plant start
4
with the sensing of nitrate in the soil by the root cells causing root growth toward the source of the nutrient (Forde and Zhang, 1998; Mlodzinska et al., 2015). Nitrate is also a signal that releases seed dormancy and induces seed germination (Fredes et al., 2019). High nitrate supply stimulates vegetative growth and delays flowering, while plants grown under low nitrate supply accelerate flowering (Castro Marín et al., 2011;
Stitt, 1999).
For the model plant A. thaliana, it is interesting to look at the scale of nitrate signalling effects using the publicly available transcription data obtained using the whole genome microarray chip ATH1 from Affymetrix (GeneChip® Arabidopsis ATH1 Genome Array).
It was shown that 20 minutes of nitrate application to previously nitrate-starved plants resulted in up- or down-regulation of up to 10% of all genes (of 22500 in total) (Wang et al., 2003). In another study, an NR knock-out mutant of
Arabidopsis was used, inorder to exclude that downstream metabolites of nitrate reduction (such as nitrite or ammonium) exerted influence on gene expression. This study could pinpoint that 595 genes (~2% of the genome) were directly influenced by nitrate (Wang et al., 2004) and indirectly implying that the remaining 8% of gene transcription was influenced by downstream metabolites of nitrate (such as nitrite and ammonium).
Up-regulation for some genes (including NR) takes place already only 15 – 30 minutes following nitrate application (Krouk et al., 2010), cannot be inhibited by cyclohexamide (a protein synthesis inhibitor) and is therefore part of the Primary Nitrate Response (PNR) (Medici and Krouk, 2014). There are multiple definitions of PNR, but one definition includes responses stimulated by applied nitrate that do not require de novo protein synthesis (Medici and Krouk, 2014). PNR also comprises transcription of genes for nitrate transport, for nitrite reduction and the gene encoding for Glucose-6- phosphate 1-dehydrogenase 3 which, catalyses the rate-limiting step of the oxidative pentose-phosphate pathway (Medici and Krouk, 2014).
How exactly nitrate influences gene expression leading to this metabolic
reprogramming is not fully understood, however a nitrate responsive cis-element has
been found in the regulatory DNA sequence of some nitrate responsive genes (Konishi
and Yanagisawa, 2011b). In addition, NODULE INCEPTION-like proteins (NLP’s) have
been identified that are post-translationally modified by nitrate and then act as
transcription factors influencing the transcription of nitrate responsive genes
(Yanagisawa, 2014).
5
1.5 Nitric oxide in plants
Up until the late 1980’s and early 1990’s the free radical gaseous molecule NO
•was mainly recognised as an environmental toxin (Yamasaki, 2005). It had been observed emitted from plants under certain conditions – such as upon herbicide treatment (Klepper, 1979) – but the concept of NO
•functioning as a signalling molecule in plants was only recognised after the discovery that NO
•serves as a signalling molecule in animals (Ignarro et al., 1987). In animals this observation was followed by the discovery that NO
•was enzymatically generated by a dedicated family of nitric oxide synthase enzymes (NOS) (Bredt and Snyder, 1990; Lamas et al., 1992; Moncada et al., 1989;
Xie et al., 1992).
1.5.1 Sources of NO
•The early observation of NO
•emission from plants was thought to be the result of a chemical reaction between nitrite, that had accumulated because of herbicide treatment, and plant metabolites (Klepper, 1979). Further research revealed that the NO
•generation was enzymatic, and used nitrite as substrate, (Harper, 1981).
Subsequently, NR was identified as the enzyme responsible for NO
•production from nitrite (Dean and Harper, 1988) and thus it was recognised for the first time that NR catalyses not just the reduction of nitrate to nitrite but also reduction of nitrite to NO
•. Despite these early findings about an important source of NO
•in plants, the focus of much research turned instead to the search for a NOS in plants. It was thought that NOS proteins in plants must exist similar to the NOS in animals. Measurements of L- arginine oxidation by plant extracts in the presence of known NOS cofactors (tetrahydrobiopterin (BH4), calmodulin, Ca
2+, NADPH, FAD and FMN), resulted in detectable NO
•production and the formation of L-citrulline. However higher plants do not produce the cofactor BH4 and therefore, this cannot be a natural cofactor for putative NOS enzymes in plants, nevertheless, it was described as being strictly required for NO
•synthesis (Corpas et al., 2004). Furthermore, this NO
•generation could be pharmacologically modulated by animal NOS inhibitors (Barroso et al., 1999;
Corpas et al., 2004; Delledonne et al., 1998; Modolo et al., 2002). This NO
•synthesising activity was detected in association with cellular organelles such as
peroxisomes and chloroplasts (Barroso et al., 1999; Prado et al., 2004) or mitochondria
(Modolo et al., 2005). Other studies showed cross-reactive protein bands in crude plant
6
extracts to antibodies raised against animal NOS isoforms (Barroso et al., 1999;
Modolo et al., 2002; Ribeiro et al., 1999). This was later proven in some cases to be unspecific cross reaction of the antibody as the protein(s) identified had no similarity with NOS enzymes (Butt et al., 2003).
In 2003, Guo et al. published the discovery of a plant NOS sequence (Guo et al., 2003), which was hailed as a breakthrough. NOS-activity in the mutant plant (Atnos1) as measured by L-citrulline formation in leaf extract was reported to be only 25% of the NOS activity in wild type (wt) plants. Another study showed that lipopolysaccharides (mediators of innate immune responses) caused a burst of NO
•release that was not inhibited by sodium azide (an NR inhibitor), but could be associated with NOS activity since the Atnos1 mutant had 80% reduced levels of NO
•-burst (Zeidler et al., 2004).
Later however, doubts arose about the direct participation of AtNOS in NO
•generation in plants and, the gene had to be renamed from ‘NOS’ to ‘nitric oxide associated’
(NOA1) because NOS activity of the recombinant protein could not be detected (Zemojtel et al., 2006) and the protein was homologous to a GTPase protein (Sudhamsu et al., 2008). Atnoa1 mutant plants have altered NO
•levels, but this is no longer thought to arise from a direct activity of NOA1 protein in NO
•synthesis, rather the effect appears to be indirect.
In summary, it can be said that no NOS gene or enzyme has been detected in plants to date – despite the sequencing of the genomes of 1000 plant species (Matasci et al., 2014). Most recently it has been proposed to cease using the term ‘NOS activity’ in plants and instead to use the term ‘nitric oxide generating (NOG)’ to more accurately name the observed NO
•generation in the absence of any NO-synthase (Hancock and Neill, 2019). However, because such a body of data exists showing oxidative NO
•generation, it has been proposed that NO
•is generated by a NOS/NOG activity putatively composed of multiple subunits (with no similarity to animal NOS, and having no requirement for BH4), but with a conserved function in oxidative NO
•generation (Crawford, 2005). Confirmation of this proposal is outstanding.
In addition, other NO
•sources in plant cells exist, for example, a non-enzymatic low-
pH dependent NO
•release from nitrite, which was shown for the aleurone layer in the
apoplast of barley grains (Bethke et al., 2004). Other nitrite-reductive mechanisms
involving components of the mitochondrial electron transport chain (most likely
Complex III) or other heme-containing proteins have been demonstrated to produce
7
NO
•(Alber et al., 2017; Benamar et al., 2008; Planchet et al., 2005). Finally, other molybdenum-containing enzymes, besides NR have the capacity to produce NO
•via reduction of nitrite (Bender and Schwarz, 2018). In animal systems xanthine oxidoreductase (XOR) is recognised as an NO
•source (Harrison, 2002), however studies with recombinant plant XOR revealed no NO
•production (Planchet, 2006).
Mitochondrial amidoxime reducing component (mARC) is a further Moco enzyme with nitrite to NO
•catalytic activity with in vitro activity shown for the plant enzyme (Yang et al., 2015). In conclusion, a wide range of sources for NO
•exist in plants depending on the context and signal that triggers NO
•production.
1.5.2 Biological functions of NO
•Despite the described controversy concerning the NO
•source in plants, NO
•is now clearly established as a crucial signalling molecule in plants involved in various processes. These include physiological responses, pathogen defence responses and abiotic stress responses and are described in detail below.
Looking more closely at studies showing physiological effects of NO
•, treatment of lettuce seeds with the NO
•donor SNP led to a stimulation of seed germination and chlorophyll production, while hypocotyl elongation was 20% reduced (Beligni and Lamattina, 2000). NO
•modulated the expression of cell cycle regulatory genes in a model examining formation of lateral root primordia (Correa-Aragunde et al., 2006).
Pollen tube orientation as it grows through the pistil toward the female gametophyte was shown to be steered by NO
•(Prado et al., 2004). NO
•also plays a role in flowering induction, with the concentration of NO
•in the floral parts increasing until anthesis (Seligman et al., 2008). The aleurone layer cells of
Arabidopsis seeds have beenshown to be NO
•responsive and thus to function as a primary determinant of seed dormancy (Bethke et al., 2007). In addition, NO
•regulates the expression of several genes involved in the response to wounding by leaf excision or mechanical damage (Jih et al., 2003; Orozco-Cardenas and Ryan, 2002).
Abscisic acid (ABA) is sometimes referred to as the plant ‘water stress hormone’ that
regulates the response to drought by causing stomatal closure. It was found that NO
•is required as a signal in the response to ABA in the guard cells causing them to lose
turgor and close, thus enhancing drought tolerance (Garcia-Mata et al., 2003; Neill et
al., 2002). Many pathogen responses have also been shown to require NO
•signalling
8
(Delledonne et al., 1998; Shi and Li, 2008), and NO
•along with a burst of reactive oxygen species (ROS) initiates cell death in the plant hypersensitive response (Delledonne et al., 1998).
In some of the above mentioned NO
•-signalling responses, the source of the NO
•could be specifically attributed to NR. This is the case for example, in the induction of flowering (Seligman et al., 2008) and for the response of guard cells to ABA (Neill et al., 2002). Other examples will be discussed in section 1.6.4.
Finally, using the whole genome microarray chip ATH1 to detect
Arabidopsistranscripts affected by NO
•treatment, 342 genes were found to be upregulated while 80 genes were down-regulated. This number of genes represents about 2% of the
Arabidopsis transcriptome, however about 10% of those are transcription factors(Parani et al., 2004). In sum, NO
•signalling is involved in a variety of different physiological pathways that are vital for plant survival.
1.5.3 Mechanism(s) of action of NO
•Despite its relatively simple chemical nature, NO
•is well suited to function as signalling molecule (Wilson et al., 2008). Firstly, it is a small non-charged molecule that is highly mobile within biological systems due to its lipophilic nature. Secondly, it can easily pass through biological membranes and thus effectively transfer the signal from its source to its target. Thirdly, it’s reactive, free radical characteristics engages NO
•in a wide variety of chemical reactions, which can be additive or redox in nature (Del Castello et al., 2019). Finally, NO
•has a rather short t
1/2in biological tissues – estimated at about 2 s (Thomas et al., 2001) - resulting in a fast and self-sufficient ending of the signalling cascade.
One of the breakthroughs in the field of NO
•signalling in animals was the discovery that NO
•binds to the ferrous heme iron of soluble guanylyl cyclase and upregulates its activity 100 – 200 fold (reviewed in Childers and Garcin, 2018). This reaction exemplifies one important mode of action of NO
•– that of binding to metal centres. In principle, NO
•will react with any metal center containing an unpaired electron (Thomas, 2015).
Another common mode of action of NO
•is the reaction with reactive cysteine thiols of
a target protein leading to a covalent modification called S-nitrosylation (reviewed in
Feng et al., 2019). Tyrosine residues can also be modified by covalent binding of an
9
NO
•to the phenolic hydroxyl group resulting in tyrosine nitration (reviewed in Corpas et al., 2013). Both of these protein modifications regulate protein function by changing the stability, conformation, subcellular localization or activity of the protein (Feng et al., 2019).
Another important pathway of NO
•signalling involves the reaction of NO
•with glutathione to form S-nitrosoglutathione (GSNO). This molecule is considered a storage pool of NO
•within cells and can react with thiol groups of target proteins to mediate S-nitrosylation as part of a signal transduction (Guerra et al., 2016).
NO
•that is generated in the biological setting co-exists with other similar reactive signalling molecules such as hydrogen sulfide (H
2S), reactive oxygen species, for example superoxide anion (O
2•-) or hydrogen peroxide (H
2O
2) and additionally, antioxidants such as glutathione (GSH) or ascorbic acid. All forms likely compete for reactions with reactive thiol groups of proteins, with different modifications resulting in different regulatory outcomes (e.g. reduction of the thiol by GSH, or S-nitrosylation of the thiol by NO
•) (Wilson et al., 2008). In addition, NO
•is highly reactive with these reactive signalling species resulting in either signal quenching, or formation of additional signal molecules (reviewed in Hancock and Neill, 2019). For example, reaction of NO
•with O
2•-results in the formation of peroxynitrite, which is generally considered to be highly toxic, however some plant cells are resistant to it and it has been suggested to function as a further signalling molecule (reviewed in Gross et al., 2013; Wilson et al., 2008). Overall it can be said that the reaction between NO
•and ROS represents an important part of natural ROS metabolism and an intricate balance exists between different reactive species in the plant maintaining redox homeostasis.
1.6 The enzyme nitrate reductase
NR is the enzyme that links two major fields in plant biology, the assimilation of nitrate
and thus biomass production and the generation of an important molecule of signal
transduction pathways (NO
•). The control of carbon and nitrogen nutrition are tightly
linked by the requirement for the energy from photosynthesis and the enzyme NR plays
a large role in balancing these two processes. At the same time, NR is a major source
of NO
•in plants by reduction of nitrite and the NO
•formed plays roles in many
physiological and stress response signalling pathways in the plant.
10
1.6.1 Structure of NR
NR is a dimeric protein of about 100 kDa per monomer (Redinbaugh and Campbell, 1985) (Fig. 2). In total there are three, modularly folded cofactor binding domains made up by eight functional sequence motifs arranged from N to C terminus as follows: (i) The N-terminal peptide is thought to be unstructured and is not conserved between isoforms and species, however a type-conserved acidic sequence motif in the N- terminal tail is involved in NR activity regulation (Chi et al., 2015). (ii) The dark blue sequence depicted in Fig. 2 incorporates the molybdenum cofactor (Moco), which consists of a molybdenum atom co-ordinated in a specialized pterin structure that is the only known form of catalytic molybdenum found in eukaryotes. (iii) Adjacent is the dimerization region (light blue) that is responsible for the interaction between two monomers forming a functional dimer. The Mo and dimerization segments together make up the Moco domain. (iv) The hinge 1 is probably an unstructured sequence segment and plays a key role in NR catalysis and in activity regulation by phosphorylation of the highly conserved, highlighted serine residue (Bachmann et al., 1996b; Lambeck et al., 2010). (v) The
b5-type heme bound in the central domain(heme domain) is the cofactor that gives NR its typical deep red colour (Redinbaugh and Campbell, 1985). (vi) hinge 2 is another less flexible and non-conserved region connecting the heme domain to the C-terminal FAD cofactor binding domain. This domain consists of (vii) the FAD-cofactor binding lobe and (viii) a lobe where NADH or NADPH binds to supply electrons to the FAD.
Figure 2: Schematic representation of the domain structure of NR. The three domains are highlighted in different colours (blue: Mo domain, red: heme domain, yellow: FAD domain). In addition, important regulatory sequences are highlighted in the N-terminal peptide (Acidic) and in the hinge 1 (pSer). Artificial electron donors and acceptors are shown above (section 1.6.3), physiological electron donors and acceptors below.
Abbreviations: Moco, Moco-binding motif; dimer, dimerization region; b5, heme domain, FAD, FAD-binding region, NADH, NADH-binding motif, BV, benzyl viologen, BPB, Bromphenol blue, MV, methyl viologen, Cyt.c, cytochrome c, FeCN, potassium ferricyanide.
11
Crystallization of full-length NR has not been successful to date. The large size of the 100 kDa monomer, its instability, the requirement for three bound cofactors and intervening unstructured protein sequences between the domains probably all collectively contribute to the difficulty in obtaining ordered crystals of NR (Campbell, 1999; Chi, 2012). Added to this is the practical difficulty in obtaining large quantities of purified and highly concentrated full-length protein. The crystal structures of some of the domains of NR have however, been determined and taken together with the crystal structures of proteins and domains homologous to NR, can be used to develop a model of the NR structure (Fig. 3).
The crystal structure of the FAD domain of corn leaf NR in complex with FAD-cofactor was determined (Lu et al., 1994). Likewise, the Moco domain of
Pichia angusta NRhas been crystalized and the structure determined (Fischer et al., 2005). Animal sulfite oxidase (SO) is a Moco and heme domain-containing protein with high sequence identities to the Moco and heme domains of NR (about 40% identity between the Moco domains and 29% identity between the heme domains (determined based on Clustal Omega alignment of residues 1-483 of
AtNR2 (Uniprot P11035) with chicken SO(CSO)(Uniprot P07850)).
Functionally, SO catalyses the oxidation of sulfite to sulfate in the liver of animals as
the final step in the degradation of sulfur containing amino acids. The crystal structure
of CSO has been determined (Kisker et al., 1997). The homology of the domains may
be helpful in modelling the structure of NR, however SO differs from NR in that the
heme domain of SO is at the N-terminus (i.e. opposite to the orientation relative to
Moco-domain found in NR (Fig. 2)). Also, the position/orientation of the linker in SO
was not clearly defined in the CSO crystal structure and therefore the heme position
observed in the CSO crystals may not reflect the physiological heme position in CSO
(or NR). In fact for both proteins, large domain movements between heme and Moco
are thought to play a role in catalytic turnover, as viscous media during catalysis slowed
enzyme turnover (Barbier and Campbell, 2005; Feng et al., 2002; Lambeck et al.,
2012). Finally, NR contains an additional FAD domain that SO does not have, and the
positioning of this C-terminal domain relative to the central heme and N-terminal Moco
domain is unknown. However a model has been proposed (Campbell, 1999), in which
the C-terminal FAD-domain is arranged next to the heme in such a way that electron
transfer from the NADH-reduced FAD to the heme-cofactor could occur (Fig. 3).
12
Subsequent to the model in 1999, the crystal structure for Pichia angusta Moco domain was determined (Fischer et al., 2005) and proved a different orientation of the dimer to the head to toe orientation proposed (Campbell, 1999). The corrected dimer- orientation is shown in Fig. 3.
A
B
Figure 3: Model of NR structure. The domains of AtNR2 were individually modelled using Swiss-Model (Waterhouse et al., 2018). Moco domain modelled on CSO (1sox, 40% identity), heme domain on fly cytochrome b5 (2ibj 1A, 42% identity) and FAD domain on corn NR-FAD-domain (1cne, 65% identity). The Moco and heme domains are arranged in the orientation that was observed in CSO. The FAD-NADH was placed as suggested (Campbell, 1999). Visualization was performed using PyMOL (DeLano, 2002). A: Cartoon representation of the protein, cofactors (Moco, heme and FAD) are shown in ball and stick. B: Mesh representation. Dark blue: Moco domain, light blue: dimerization motif, brown: heme-domain, dark yellow: FAD binding motif, light yellow: NADH binding motif
1.6.2 Electron transport in NR
NR is considered to function as a mini-electron transport chain (Campbell, 1988). The
cellular reductants NADH or NADPH bind at the C-terminal FAD domain (Fig. 2) and
13
transfer two electrons to the FAD cofactor. The electrons are then passed one at a time to the central heme domain and onward to the Moco. It is at the Moco domain, which carries one or two electrons in the partially or fully reduced state (Mo (V) or (IV)), where nitrite or nitrate reduction takes place. Based on the redox potentials of the redox-active cofactors, a ‘downhill’ electron flow is thought to occur in NR from FAD (~
-280 mV) to heme (~ -160 mV) to Moco (~ 0 mV) (Campbell, 2001; Ratnam et al., 1996). Evidence for this was seen in the full reduction of the heme cofactor by UV/vis spectroscopy, before reduction of the FAD cofactor could be spectroscopically observed using a heme-FAD fragment of NR (Campbell, 2001; Lambeck, 2009;
Ratnam et al., 1996).
While nitrate reduction is a two-electron process that must start with the fully reduced Mo (IV), it is unclear whether nitrite reduction is possible with Mo (V) or only with Mo (IV) as the fully reduced Mo (IV) redox state has been reported compulsory for nitrite reduction by SO (Bender, 2017; Wang et al., 2015). A single electron is required for the reduction of nitrite to NO
•and the reaction is thought to be as follows:
NO
2-+ NAD(P)H + 1 H
+ NO
•+ NAD(P)
++ 1 H
2O + 1e
-1.6.3 Functional domain fragments of NR
The full-length NR protein is rather unstable and difficult to work with; probably for the same reasons stated above that full-length protein has not yet been crystallized.
Nonetheless, some studies in the literature exist using full-length NR extracted from native tissue or recombinantly expressed. These studies were used, for example, to generate NR-specific antibodies (Campbell and Remmler, 1986), to determine the steady-state and pre-steady state kinetic parameters for the enzyme (Barber and Notton, 1990; Skipper et al., 2001) and to study post-translational regulation of NR (Lambeck et al., 2010).
It was realized early-on, however that the proteolytic digested or separately recombinantly expressed domain fragments of NR retain the partial activity of the respective domain(s) in the full-length enzyme (Campbell, 1996; Kubo et al., 1988).
These studies offered the advantage of working with the more stable protein fragments and have helped to define the individual electron transfer steps during catalysis.
Domain fragments such as the isolated FAD-domain (Hyde and Campbell, 1990; Lu et
al., 1994), the heme-FAD fragment (‘Mo-reductase fragment’) (Mertens et al., 2000),
14
and the Moco-heme fragment (NR-Mo-heme) (Lambeck et al., 2012) have been successfully recombinantly expressed and display activity similar to parts of the full- length protein – if suitable artificial electron donors or acceptors are provided (Fig. 2).
For example, the FAD-domain fragment displays diaphorase activity by using NADH/NADPH for reduction of ferricyanide (Kubo et al., 1988), the Mo-reductase fragment can be used to reduce ferricyanide or cytochrome c (Mertens et al., 2000) and the NR-Mo-heme can reduce nitrate when artificial electron donors are supplied, such as methyl viologen (MV) or bromphenol blue (Lambeck et al., 2012).
1.6.4 Isoforms of NR
Many plant species express more than one isoform of NR. This includes the model plant A. thaliana (2 isoforms), but also barley (Hordeum vulgare, 3 isoforms), soybean (Glycine max, 3 isoforms), rice (Oryza sativa, 2 isoforms), tobacco (Nicotiana tabacum, 4 isoforms), and maize (Zea mays, 3 isoforms). Other plants express just one isoform, for example spinach (Spinacea oleracea), squash (Curcurbita pepo) and tomato (Solanum lycopersicum). For plants with multiple isoforms, differences have been discerned on the level of transcription, on the protein expression level and in the role of one or other isoform in a particular function. For example, differences have in some cases been determined between the isoforms in their specificity for the co-substrate NADH or NADPH (Beevers et al., 1964; Dailey et al., 1982) while other NR isoforms in a species are either constitutively or inducibly expressed (Wu et al., 1995). Soybean is thought to be unique in that it expresses two constitutive and one inducible NR isoform (Wu et al., 1995). The greatest number of comparisons has been performed for the model plant A. thaliana, which expresses 2 isoforms; NR1 and NR2 encoded by the genes
NIA1 (GenBank accession Z190520) and NIA2 (GenBank accession J03240)respectively.
1.6.4.1 Transcriptional differences between NR isoforms
The largest body of information about differences between transcription of NR isoforms
has been gleaned from transcriptome data. Using the Genevestigator software (Hruz
et al., 2008) the transcripts for NIA1 and NIA2 in wild type Arabidopsis were compared
for their expression in various plant tissues. This tool accesses publicly available
Affymetrix ATH1 transcriptomics data and allows a visual depiction of the expression
result. The expression of
NIA2 in this analysis is higher in all tissues, except for the15
inflorescence (which includes the ovule, seed and embryo) (Fig. 4). Although overall
NIA expression is lower in this tissue, NIA1 was more highly expressed than NIA2.Figure 4: Comparison of NIA1 and NIA2 expression in publicly available transcriptomics data for wild type Arabidopsis. NIA2 expression is higher compared to NIA1 in all tissues except the inflorescence.
Besides looking at the transcriptomics data for the entire plant, many studies have focussed on looking at NIA expression in particular tissues or under certain conditions.
One of the first observations was that NIA1 and NIA2 expression oscillates diurnally and is linked to the circadian clock (Fig. 5) (Cheng et al., 1991). The nutrient nitrate is a major signal inducing expression of NR and many other genes involved in nitrate uptake and assimilation, and in the case of Arabidopsis, nitrate supply leads to massive upregulation of both
NIA1 and NIA2 (Cheng et al., 1991). In fact, both genes havenitrate responsive elements in the 5´ promoter region (Lin et al., 1994), NIA1, however has an additional nitrate responsive
cis-element in the 3´genomic sequence thatrenders
NIA1 even more nitrate responsive compared to NIA2 (Konishi andYanagisawa, 2011a). Another group looked only at the promoter sequence for
NIA1and found that it contained elements responsive to nitrate, nitrite and ammonium (Wang et al., 2010).
In the presence of nitrate, light also has a profound effect on NIA1 and NIA2 expression because nitrate assimilation is closely linked to photosynthesis (Cheng et al., 1991).
Later, the same group of researchers found that sucrose could mimic the effect of light-
stimulation on NR transcription (Cheng et al., 1992). While these effects were general
for transcription of both NIA1 and NIA2, isoform-specific differences have also been
reported. Under conditions of nitrogen starvation, low levels of
NIA1 are basallyexpressed while NIA2 is absent (Cheng et al., 1991) and in certain specific pathways
of light signalling, differences have been discerned in the induced expression of NIA1
16
and
NIA2. In the cr88 mutant Arabidopsis, red light signalling that controls NIA2expression was lost, while no effect on
NIA1 expression was seen (Lin and Cheng,1997). Similarly, an Arabidopsis mutant lacking HY5 (LONG HYPOCOTYL 5) and HYH (HOMOLOG OF HY5) lost light induction of NIA2 expression while no effect on NIA1 expression was seen (Jonassen et al., 2009a; Jonassen et al., 2009b). On the other hand, the cytokinin benzyladenine induced a ~14-fold increase in NR activity in
Arabidopsis. This correlated with increased NIA1 transcription and mRNA levels while NIA2 transcript level was unchanged (Yu et al., 1998). To summarize, there are factorscontrolling the transcription of NIA1 and NIA2 that are common to both isoforms, and there are also factors that result in individual expression patterns that points toward specialized requirements in the plant for one or other isoform under particular environmental conditions or in certain tissues (Fig. 5).
Figure 5: Factors influencing NR1 and NR2 expression and activity in A. thaliana.
17