O. Lutz,
20S. Neubauer,
20M. Heck,
20T. Kuhr,
20A. Zupanc,
20I. Adachi,
10H. Aihara,
54D. M. Asner,
42T. Aushev,
17T. Aziz,
49A. M. Bakich,
48K. Belous,
16V. Bhardwaj,
34B. Bhuyan,
12A. Bondar,
3G. Bonvicini,
59A. Bozek,
38M. Braˇ cko,
27, 18T. E. Browder,
9P. Chang,
37V. Chekelian,
28A. Chen,
35P. Chen,
37B. G. Cheon,
8R. Chistov,
17K. Cho,
21V. Chobanova,
28Y. Choi,
47D. Cinabro,
59J. Dalseno,
28, 50M. Danilov,
17, 30Z. Doleˇ zal,
4Z. Dr´ asal,
4D. Dutta,
12S. Eidelman,
3D. Epifanov,
54H. Farhat,
59J. E. Fast,
42M. Feindt,
20V. Gaur,
49N. Gabyshev,
3S. Ganguly,
59R. Gillard,
59Y. M. Goh,
8B. Golob,
25, 18J. Haba,
10T. Hara,
10K. Hayasaka,
33H. Hayashii,
34Y. Hoshi,
52W.-S. Hou,
37Y. B. Hsiung,
37H. J. Hyun,
23T. Iijima,
33, 32A. Ishikawa,
53R. Itoh,
10Y. Iwasaki,
10T. Julius,
29J. H. Kang,
61P. Kapusta,
38E. Kato,
53T. Kawasaki,
40C. Kiesling,
28H. J. Kim,
23H. O. Kim,
23J. B. Kim,
22J. H. Kim,
21K. T. Kim,
22M. J. Kim,
23K. Kinoshita,
5J. Klucar,
18B. R. Ko,
22P. Kodyˇ s,
4S. Korpar,
27, 18R. T. Kouzes,
42P. Kriˇ zan,
25, 18P. Krokovny,
3B. Kronenbitter,
20T. Kumita,
56A. Kuzmin,
3Y.-J. Kwon,
61J. S. Lange,
6S.-H. Lee,
22Y. Li,
58C. Liu,
45Y. Liu,
5D. Liventsev,
10D. Matvienko,
3K. Miyabayashi,
34H. Miyata,
40G. B. Mohanty,
49A. Moll,
28, 50T. M¨ uller,
20N. Muramatsu,
44E. Nakano,
41M. Nakao,
10Z. Natkaniec,
38M. Nayak,
13E. Nedelkovska,
28C. Ng,
54N. K. Nisar,
49S. Nishida,
10O. Nitoh,
57S. Ogawa,
51T. Ohshima,
32S. Okuno,
19S. L. Olsen,
46Y. Onuki,
54C. Oswald,
2P. Pakhlov,
17, 30G. Pakhlova,
17H. Park,
23H. K. Park,
23T. K. Pedlar,
26R. Pestotnik,
18M. Petriˇ c,
18L. E. Piilonen,
58M. Prim,
20M. Ritter,
28M. R¨ ohrken,
20H. Sahoo,
9T. Saito,
53Y. Sakai,
10S. Sandilya,
49D. Santel,
5L. Santelj,
18T. Sanuki,
53Y. Sato,
53O. Schneider,
24G. Schnell,
1, 11C. Schwanda,
15A. J. Schwartz,
5K. Senyo,
60O. Seon,
32M. E. Sevior,
29M. Shapkin,
16V. Shebalin,
3C. P. Shen,
32T.-A. Shibata,
55J.-G. Shiu,
37B. Shwartz,
3A. Sibidanov,
48F. Simon,
28, 50P. Smerkol,
18Y.-S. Sohn,
61A. Sokolov,
16E. Solovieva,
17M. Stariˇ c,
18M. Sumihama,
7T. Sumiyoshi,
56G. Tatishvili,
42Y. Teramoto,
41K. Trabelsi,
10T. Tsuboyama,
10M. Uchida,
55T. Uglov,
17, 31Y. Unno,
8S. Uno,
10Y. Usov,
3C. Van Hulse,
1G. Varner,
9V. Vorobyev,
3M. N. Wagner,
6C. H. Wang,
36J. Wang,
43M.-Z. Wang,
37P. Wang,
14M. Watanabe,
40Y. Watanabe,
19K. M. Williams,
58E. Won,
22H. Yamamoto,
53Y. Yamashita,
39Z. P. Zhang,
45V. Zhilich,
3and V. Zhulanov
3(The Belle Collaboration)
1
University of the Basque Country UPV/EHU, 48080 Bilbao
2
University of Bonn, 53115 Bonn
3
Budker Institute of Nuclear Physics SB RAS and Novosibirsk State University, Novosibirsk 630090
4
Faculty of Mathematics and Physics, Charles University, 121 16 Prague
5
University of Cincinnati, Cincinnati, Ohio 45221
6
Justus-Liebig-Universit¨ at Gießen, 35392 Gießen
7
Gifu University, Gifu 501-1193
8
Hanyang University, Seoul 133-791
9
University of Hawaii, Honolulu, Hawaii 96822
10
High Energy Accelerator Research Organization (KEK), Tsukuba 305-0801
11
Ikerbasque, 48011 Bilbao
12
Indian Institute of Technology Guwahati, Assam 781039
13
Indian Institute of Technology Madras, Chennai 600036
14
Institute of High Energy Physics, Chinese Academy of Sciences, Beijing 100049
15
Institute of High Energy Physics, Vienna 1050
16
Institute for High Energy Physics, Protvino 142281
17
Institute for Theoretical and Experimental Physics, Moscow 117218
18
J. Stefan Institute, 1000 Ljubljana
19
Kanagawa University, Yokohama 221-8686
20
Institut f¨ ur Experimentelle Kernphysik, Karlsruher Institut f¨ ur Technologie, 76131 Karlsruhe
21
Korea Institute of Science and Technology Information, Daejeon 305-806
22
Korea University, Seoul 136-713
23
Kyungpook National University, Daegu 702-701
24
Ecole Polytechnique F´ ´ ed´ erale de Lausanne (EPFL), Lausanne 1015
25
Faculty of Mathematics and Physics, University of Ljubljana, 1000 Ljubljana
26
Luther College, Decorah, Iowa 52101
27
University of Maribor, 2000 Maribor
28
Max-Planck-Institut f¨ ur Physik, 80805 M¨ unchen
arXiv:1303.3719v3 [hep-ex] 11 Jun 2013
29
School of Physics, University of Melbourne, Victoria 3010
30
Moscow Physical Engineering Institute, Moscow 115409
31
Moscow Institute of Physics and Technology, Moscow Region 141700
32
Graduate School of Science, Nagoya University, Nagoya 464-8602
33
Kobayashi-Maskawa Institute, Nagoya University, Nagoya 464-8602
34
Nara Women’s University, Nara 630-8506
35
National Central University, Chung-li 32054
36
National United University, Miao Li 36003
37
Department of Physics, National Taiwan University, Taipei 10617
38
H. Niewodniczanski Institute of Nuclear Physics, Krakow 31-342
39
Nippon Dental University, Niigata 951-8580
40
Niigata University, Niigata 950-2181
41
Osaka City University, Osaka 558-8585
42
Pacific Northwest National Laboratory, Richland, Washington 99352
43
Peking University, Beijing 100871
44
Research Center for Electron Photon Science, Tohoku University, Sendai 980-8578
45
University of Science and Technology of China, Hefei 230026
46
Seoul National University, Seoul 151-742
47
Sungkyunkwan University, Suwon 440-746
48
School of Physics, University of Sydney, NSW 2006
49
Tata Institute of Fundamental Research, Mumbai 400005
50
Excellence Cluster Universe, Technische Universit¨ at M¨ unchen, 85748 Garching
51
Toho University, Funabashi 274-8510
52
Tohoku Gakuin University, Tagajo 985-8537
53
Tohoku University, Sendai 980-8578
54
Department of Physics, University of Tokyo, Tokyo 113-0033
55
Tokyo Institute of Technology, Tokyo 152-8550
56
Tokyo Metropolitan University, Tokyo 192-0397
57
Tokyo University of Agriculture and Technology, Tokyo 184-8588
58
CNP, Virginia Polytechnic Institute and State University, Blacksburg, Virginia 24061
59
Wayne State University, Detroit, Michigan 48202
60
Yamagata University, Yamagata 990-8560
61
Yonsei University, Seoul 120-749
We report a search for the rare decays B
→h
(∗)ν¯ ν, where h
(∗)stands for K
+, K
S0, K
∗+, K
∗0, π
+, π
0, ρ
+, ρ
0and φ. The results are obtained from a 711 fb
−1data sample that contains 772
×10
6B B ¯ pairs collected at the Υ(4S) resonance with the Belle detector at the KEKB e
+e
−collider. We search for signal candidates by fully reconstructing a hadronic decay of the accompanying B meson and requiring a single h
(∗)meson left on the signal side. No significant signal is observed and we set upper limits on the branching fractions at 90% confidence level. The measurements of B
+→K
∗+ν¯ ν, B
+→π
+ν ν, ¯ B
0→π
0ν¯ ν and B
0→ρ
0ν¯ ν provide the world’s currently most restrictive limits.
PACS numbers: 13.25.Hw, 14.40.Nd, 12.15.Mm
The decays B → K
(∗)ν ν ¯ proceed through the flavor-changing neutral-current process b → sν ν, which ¯ is sensitive to physics beyond the standard model (SM) [1, 2]. The dominant SM diagrams are shown in Fig. 1. The SM branching fractions are estimated to be (6.8 ± 2.0) × 10
−6for B
+→ K
∗+ν ν ¯ [2] and (4.4 ± 1.5) × 10
−6for B
+→ K
+ν ν ¯ decays [1]. The decays B → (π, ρ)ν ¯ ν proceed similarly through b → dν ν. ¯ Compared to b → sν ν ¯ transitions, the branching fractions are further suppressed by a factor |V
td/V
ts|
2. The decay B
0→ φν ν ¯ proceeds through a yet unob- served penguin annihilation process, with the expected branching fraction thus much lower. The advantage of ν ν ¯ rather than `
+`
−in the final state is the absence of long-distance electromagnetic interactions. In the ratio of the individual branching fractions for B → Kν¯ ν and B → K`
+`
−, the form factor normalization cancels out, leading to a factor of three smaller theoretical error
compared to the ν ν ¯ mode alone [2]. Measurements of the B → Kν ν ¯ and B → K`
+`
−branching fractions might reveal moderate deviations from SM expectations due to New physics such as SUSY particles, a possible fourth generation and a non-standard Z-coupling which would contribute to the penguin loop or box diagram and affect the branching fractions [3].
Experimental measurements [4] of the b → s`
+`
−transitions with two charged leptons are in good
agreement with SM calculations [2]. The challenging
search for decays with two final-state neutrinos was
previously carried out by the CLEO, BaBar and Belle
collaborations [5–8]. No signal was observed, and the
experimental upper limit for the B
+→ K
+ν ¯ ν decay is
a factor of three above the SM prediction; for the other
branching fractions, the limits are an order of magnitude
above the predictions.
This measurement of B → h
(∗)ν ν, where ¯ h
(∗)stands for K
+, K
S0, K
∗+, K
∗0, π
+, π
0, ρ
+, ρ
0and φ [9], is based on the full Belle data sample recorded at the Υ(4S) resonance that contains 772 × 10
6BB pairs. The main improvements compared to the previous analysis [6]
consist of the use of a new probabilistic full reconstruc- tion, a further optimized background suppression and an improved signal extraction procedure.
b s
t, c
Z ν
W
ν (a) Penguin diagram
b s
ν ν t, c
W W
(b) Box diagram
FIG. 1: The quark-level diagrams for the b
→sν¯ ν transition in the standard model.
The Belle detector is a large-solid-angle magnetic spectrometer that consists of a silicon vertex detector (SVD), a 50-layer central drift chamber (CDC), an array of aerogel threshold Cherenkov counters (ACC), a barrel-like arrangement of time-of-flight scintillation counters (TOF), and an electromagnetic calorimeter comprised of CsI(Tl) crystals (ECL) located inside a superconducting solenoid coil that provides a 1.5 T magnetic field. An iron flux return located outside of the coil is instrumented to detect K
L0mesons and to identify muons (KLM). The detector is described in detail elsewhere [10]. Two inner detector configurations were used. A 2.0 cm radius beam pipe and a 3-layer silicon vertex detector was used for the first sample of 152 × 10
6B B ¯ pairs, while a 1.5 cm radius beam pipe, a 4-layer silicon detector and a small-cell inner drift chamber were used to record the remaining 620 × 10
6B B ¯ pairs [11]. The data set recorded with the second config- uration of the SVD was reprocessed with respect to [10]
using new track finding algorithms, which improved the track reconstruction efficiency. A GEANT3-based [12]
Monte Carlo (MC) simulation of the Belle detector is used to optimize the event selection and to estimate the signal efficiency.
We identify signal candidates by fully reconstructing the accompanying B meson (B
tag) and requiring one single h
(∗)meson on the signal side. The B
tagcandidates are reconstructed in hadronic decay channels using a neural network-based hierarchical full reconstruction method [13], which provides, for a given purity, roughly twice as many B
tagcandidates compared to the full reconstruction method used in the previous analysis [6].
The reconstruction is done in four stages; at each stage, the signal probabilities are calculated. In the first stage charged tracks, photons and K
s0and π
0mesons are reconstructed. In the following step, two to five of these
particles are combined in different modes to form D
(s)±, D
0and J/ψ candidates. Some of the most important variables used in the neural network training are the product of the neural network output for the children, the invariant mass of child pairs and the angle between them, the angle between the momentum of the D meson and the vector between the D decay vertex and the inter- action point, and the significance of his vector’s length.
In the third stage, the particles from the prior stages are combined to form the D
(s)∗±and D
∗0mesons. In the final stage, the B
±and B
0candidates are reconstructed in one of 1104 exclusive hadronic decay channels.
Here, variables with good discrimination power are the product of the neural network outputs of the children, the mass of the D meson, the mass difference of the D and D
∗candidates, the angle between the B meson and the thrust axis, and angles between the children. We use the output variable o
tagof the full reconstruction, which ranges from zero for background events to unity if a clear B
tagis obtained from the network, and require o
tag> 0.02. This cut was found to give the best expected branching fraction limit for all channels. We select the B
tagcandidates using the energy difference
∆E ≡ E
B− E
beamand the beam-energy constrained mass M
bc≡ p
E
beam2− p
2B, where E
beamis the beam energy and E
Band p
Bare the reconstructed energy and momentum of B
tagcandidate in the Υ(4S) center-of- mass (c.m.) frame. We require B
tagcandidates to satisfy the requirements M
bc> 5.27 GeV/c
2and −0.08 GeV
< ∆E < 0.06 GeV. If there are multiple B
tagcandidates in an event, the candidate with the highest o
tagis chosen.
The particles in the event not associated with the B
tagmeson are used to reconstruct a B
sig→ h
(∗)ν ν ¯ candidate. Prompt charged tracks are required to have a maximum distance to the interaction point (IP) of 5 cm in the beam direction (z), of 2 cm in the transverse plane (r − φ) and a minimum momentum of 0.1 GeV/c in the transverse plane. K
±(π
±) candidates are reconstructed from charged tracks having a kaon likelihood greater than 0.6 (less than 0.4). The kaon likelihood is defined by R
K≡ L
K/(L
K+ L
π), where L
K(L
π) denotes a combined likelihood measurement from the ACC, the TOF, and dE/dx from the CDC for the K
±(π
±) tracks.
It is a function of the momentum and the polar angle of the tracks in the laboratory frame. The kaon (pion) identification efficiency is 88%-93% (86%-93%) with a pion (kaon) misidentification probability of 10%-12%
(8%-11%). We use pairs of oppositely charged tracks
to reconstruct K
S0decays, with an invariant mass that
is within ±15 MeV/c
2of the nominal K
S0meson mass
(corresponding to a width of 5.8σ). We adopt the stan-
dard K
S0selection criteria developed within the Belle
collaboration [14]. For π
0→ γγ, a minimum photon
energy of 50 MeV is required and the γγ invariant mass
must be within ±16 MeV/c
2of the nominal π
0mass
(4.1σ).
The decays B
sig+→ K
+ν ν, ¯ B
+sig→ π
+ν ν, ¯ B
sig0→ K
S0ν ¯ ν and B
sig0→ π
0ν ¯ ν are reconstructed from single K
+, π
+, K
S0and π
0candidates, respectively.
The B
sig0→ K
∗0ν ν ¯ candidates are reconstructed from a charged pion and an oppositely charged kaon, while B
sig+→ K
∗+ν ν ¯ decays are reconstructed from a K
S0candidate and a charged pion, or a π
0candidate and a charged kaon. The reconstructed mass of the K
∗0(K
∗+) candidate is required to be within a ±75 MeV/c
2window around the nominal K
∗0(K
∗+) mass. Furthermore, pairs of charged pions with opposite charge are used to form B
sig0→ ρ
0ν ν ¯ candidates, where the π
+π
−invariant mass must be within ±150 MeV/c
2of the nominal ρ
0mass.
For B
sig+→ ρ
+ν ν ¯ , a charged pion and a π
0candidate within a ±150 MeV/c
2mass window around the nominal ρ
+mass are used. A K
+K
−pair with a reconstructed mass within ±10 MeV/c
2of the nominal φ mass is used to reconstruct φ candidates. After identifying the B
tagcandidate and reconstructing the light meson, we require that no additional charged tracks nor π
0candidates remain in the event. These vetoes and the mutually exclusive PID requirements for kaons and pions also eliminate the possibility of obtaining multiple h
(∗)candidates per event.
The dominant backgrounds are from e
+e
−→ q q ¯ (q = u, d, s, c) continuum events and B B ¯ decays with a b → c transition. During the full reconstruction, a continuum suppression algorithm based on modified Fox-Wolfram moments [15] is applied. To further suppress the continuum background, we use the cosine of the angle between the momentum of the h
(∗)and the thrust axis with the sign convention to the side of momentum flow of the rest of the charged tracks, evaluated in the Υ(4S) rest frame. This cosine is close to
−1 or 1 for continuum events but uniformly distributed for spherical B B ¯ events. We require the cosine to lie between −0.8 and 0.7. The selection criteria are asy- metric due to the kinematic selection performed during the B
tagreconstruction. In this way, the continuum background component is nearly completely removed from the signal region, which leads to a better signal sensitivity compared to the previous analysis [6].
We introduce a lower bound of 1.6 GeV/c on the momentum of the h
(∗)candidate in the B
sigrest frame to suppress the background from b → c transitions. An upper bound of 2.5 GeV/c rejects the contributions from radiative two-body modes such as B → K
∗γ. The momentum requirement is removed for φ candidates due to the lack of theoretical calculations for B → φ form factors. To suppress backgrounds with undetected particles produced along the beam pipe, we require the cosine of the angle between the missing momentum in the laboratory frame and the beam to lie between −0.86 and 0.95. Contributions from rare B decays involving b → u, b → s, or b → d processes are found to be
small according to MC studies. The only exception is the B
sig→ φν ν ¯ decay, where rare decays represent the majority of the remaining background events. The B
+→ τ
+ν
τdecay with the π
+ν ¯ ν and ρ
+ν ν ¯ final states contributes only 3% and 2% of the total background in these channels, respectively.
The efficiency of the full reconstruction differs be- tween data and MC simulation. The correction ratio, depending on the B
tagdecay mode and obtained from a study using b → c semileptonic decays on the signal side, lies between 0.7 and 0.8 and is applied to all correctly reconstructed B
tagcandidates in the MC simulation.
The most powerful variable to identify the signal decays is the residual energy in the ECL, E
ECL, which is the sum of the energies of ECL clusters that are not associated with the B
tagdaughters nor with the signal- side h
(∗)candidate. To suppress contributions from noise in the calorimeter, minimum energy thresholds are required: 50 MeV for the barrel, 100 MeV for the forward endcap and 150 MeV for the backward endcap region. These thresholds were determined and optimized to achieve an optimal signal to noise ratio in the calorimeter crystals. In a properly reconstructed signal event, no activity should appear in the calorimeter, so signal events peak at low E
ECLvalues.
The signal yield is extracted from an extended binned maximum likelihood fit to the E
ECLdistribution in the range from 0 to 1.2 GeV. The likelihood is
L = ( P
j
N
j)
Ne
−PjNjN!
N
Y
i=1
X
j
N
jP
ji, (1) where N is the total number of observed events, N
jis the yield for category j, which corresponds to either signal or background, i is the event index and P
jis the probability density function (PDF) of the fit component j. The PDFs are obtained using MC simulation and are modeled as histogram functions. The normalizations of single background components (continuum, b → c, and rare) relative to each other are estimated from the MC simulation and fixed in the fit, leading to two free parameters in the fit for signal and total background yields. Compared to the counting procedure performed in the previous analysis [6], this fitting method makes use of the signal shape to discriminate between signal and background contributions.
We calculate the significances and the upper limits by evaluating the likelihood profile. To take into account the systematic uncertainty, we convolve the likelihood function with a Gaussian whose width equals the total systematic uncertainty. The significance is obtained by comparing the likelihood values at maximum and at zero signal yield: S =
r 2 log
Lmax
L0
. The upper limit
[GeV]
EECL 0.0 0.2 0.4 0.6 0.8 1.0 1.2
Events/0.1 GeV
0 2 4 6 8 10 12
14 B+→ K+νν
[GeV]
EECL 0.0 0.2 0.4 0.6 0.8 1.0 1.2
Events/0.1 GeV
0 1 2 3 4 5 6 7 8 9 10
ν
Sν K0
→ B0
[GeV]
EECL 0.0 0.2 0.4 0.6 0.8 1.0 1.2
Events/0.1 GeV
0 2 4 6 8 10
ν ν K*+
→ B+
[GeV]
EECL 0.0 0.2 0.4 0.6 0.8 1.0 1.2
Events/0.1 GeV
0 2 4 6 8 10
ν ν K*0
→ B0
[GeV]
EECL 0.0 0.2 0.4 0.6 0.8 1.0 1.2
Events/0.1 GeV
0 5 10 15 20 25
ν ν π+
→ B+
[GeV]
EECL 0.0 0.2 0.4 0.6 0.8 1.0 1.2
Events/0.1 GeV
0 1 2 3 4 5 6 7 8 9 10
ν ν π0
→ B0
[GeV]
EECL 0.0 0.2 0.4 0.6 0.8 1.0 1.2
Events/0.1 GeV
5 10 15 20 25
ν ν ρ+
→ B+
[GeV]
EECL 0.0 0.2 0.4 0.6 0.8 1.0 1.2
Events/0.1 GeV
0 1 2 3 4 5 6 7 8 9 10
ν ν ρ0
→ B0
[GeV]
EECL 0.0 0.2 0.4 0.6 0.8 1.0 1.2
Events/0.1 GeV
0 1 2 3 4 5 6 7 8 9 10
ν ν φ
→ B0
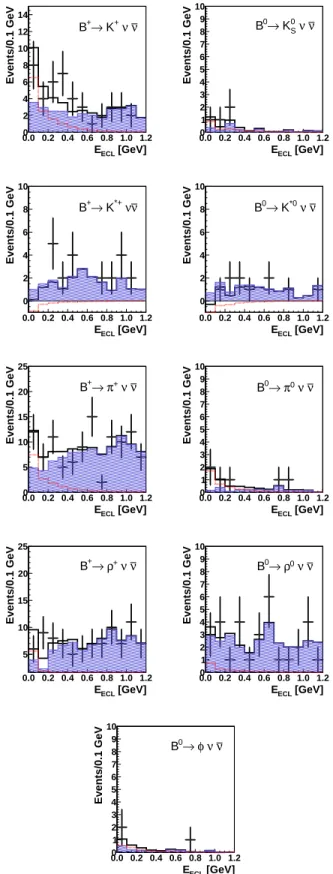
FIG. 2: The E
ECLdistributions for B
→h
(∗)ν¯ ν decays.
Points with error bars are data; the solid black histogram is the total fit result. The blue cross-hatched region is the background component; the dashed red histogram shows the signal contribution.
on the branching fraction at 90% confidence level (C.L.) is evaluated through a Bayesian method by integrating the likelihood function from zero to the bound that gives 90% of the total area; this assumes a uniform prior distribution for the branching fraction. We obtain the branching fraction using the signal yield N
sig, the signal efficiency and the total number of B B ¯ pairs N
BB¯: B = N
sig/( · N
BB¯).
To evaluate the sensitivity, simulated experiments with the expected amount of background events and zero signal events were generated. For each of the experiments, an upper limit on the branching fraction at 90% C.L. was calculated. The median values of the obtained upper limit distributions are summarized in the rightmost column in Table I.
The E
ECLdistributions in data are shown in Fig. 2, superimposed with the fit result. The total numbers of observed events, the signal yields, the significances of the observed signal, the reconstruction efficiencies and the upper limits on the branching fractions are summarized in Table I. None of the signal modes show a significant signal contribution. According to MC studies, the enhancements in the K
+ν ν ¯ and πν ν ¯ modes are unlikely to be caused by peaking background contributions. The signal reconstruction efficiencies are estimated with MC simulations using the B → h
(∗)form factors from Ref. [16].
The systematic uncertainty is dominated by the statistical uncertainty of the background model. The stringent selection increases the signal to background ratio but also reduces the number of MC events in the signal box. This leads to a large uncertainty in the background shape, despite using an MC sample corresponding to five times the data luminosity. To estimate the uncertainty, we replace the nominal back- ground model with two alternative models compatible with the simulation and repeat the fit. The alternative background models are Chebyshev polynomials of order 0, 1 or 2. For each channel, the two models that are most compatible with the background distribution are used.
After the fit with these models, the largest deviation
of the signal yield from the nominal fit is assigned as
systematic error, which can vary in size among channels
due to the different background shapes. To validate
the procedure we also performed a crosscheck for one
of the channels by refitting the sample with randomly
fluctuating background histogram models and obtained
a compatible result. The fit bias is evaluated through
pseudo-experiments with signal and background yields
set to the observed values. The systematic uncertainty
due to MC data discrepancy of the track and π
0rejection
was studied using a D
(∗)lν control sample. Uncertainties
associated with the B
tagreconstruction efficiency, signal
MC statistics, particle identification, track or particle
reconstruction efficiency, the total number of the B B ¯
TABLE I: Summary of the total number of observed events in the signal box N
tot, the resulting signal yield N
sig, the significance of the observed signal, the signal efficiencies , the measured and the expected upper limits on the branching fractions at 90%
C.L.
Mode N
totN
sigSignificance , 10
−4Upper limit Expected limit
B
+→K
+ν¯ ν 43 13.3
+7.4−6.6(stat)
±2.3(syst) 2.0σ 5.68 < 5.5
×10
−52.2
×10
−5B
0→K
s0ν¯ ν 4 1.8
+3.3−2.4(stat)
±1.0(syst) 0.7σ 0.84 < 9.7
×10
−57.3
×10
−5B
+→K
∗+ν ν ¯ 21
−1.7+1.7−1.1(stat)
±1.5(syst) – 1.47 < 4.0
×10
−55.8
×10
−5B
0→K
∗0ν¯ ν 10
−2.3+10.2−3.5(stat)
±0.9(syst) – 1.44 < 5.5
×10
−54.6
×10
−5B
+→π
+ν ν ¯ 107 15.2
+7.1−6.2(stat)
±1.4(syst) 2.6σ 3.39 < 9.8
×10
−53.8
×10
−5B
0→π
0ν¯ ν 6 3.5
+2.6−1.9(stat)
±0.6(syst) 1.9σ 1.66 < 6.9
×10
−53.6
×10
−5B
+→ρ
+ν ν ¯ 90 11.3
+6.3−5.4(stat)
±4.1(syst) 1.7σ 1.35 < 21.3
×10
−510.2
×10
−5B
0→ρ
0ν ν ¯ 31 1.6
+5.0−4.1(stat)
±0.4(syst) 0.4σ 0.64 < 20.8
×10
−515.7
×10
−5B
0→φν ν ¯ 3 1.4
+2.9−0.9(stat)
±0.8(syst) 0.5σ 0.58 < 12.7
×10
−58.7
×10
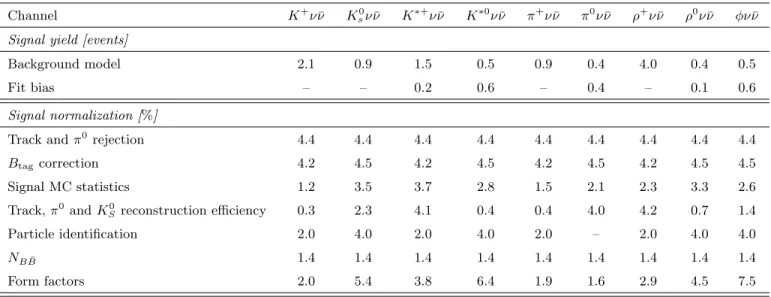
−5TABLE II: Summary of the systematic errors. The errors on the signal yield are given in the number of events and the errors of the signal normalization are given in %.
Channel K
+ν ν ¯ K
s0ν¯ ν K
∗+ν ν ¯ K
∗0ν ν ¯ π
+ν¯ ν π
0ν¯ ν ρ
+ν¯ ν ρ
0ν¯ ν φν ν ¯ Signal yield [events]
Background model 2.1 0.9 1.5 0.5 0.9 0.4 4.0 0.4 0.5
Fit bias – – 0.2 0.6 – 0.4 – 0.1 0.6
Signal normalization [%]
Track and π
0rejection 4.4 4.4 4.4 4.4 4.4 4.4 4.4 4.4 4.4
B
tagcorrection 4.2 4.5 4.2 4.5 4.2 4.5 4.2 4.5 4.5
Signal MC statistics 1.2 3.5 3.7 2.8 1.5 2.1 2.3 3.3 2.6
Track, π
0and K
S0reconstruction efficiency 0.3 2.3 4.1 0.4 0.4 4.0 4.2 0.7 1.4
Particle identification 2.0 4.0 2.0 4.0 2.0 – 2.0 4.0 4.0
N
BB¯1.4 1.4 1.4 1.4 1.4 1.4 1.4 1.4 1.4
Form factors 2.0 5.4 3.8 6.4 1.9 1.6 2.9 4.5 7.5
pairs and the form factors of the signal model are included as well. Because the limits quoted in this paper are derived under the assumption a SM signal distribution, the signal model uncertainty is obtained from the uncertainties of the SM prediction of the form factors. As the main impact of the different form factors relates to the h
(∗)momentum distribution, the evaluated systematic error also includes the impact of a different h
(∗)momentum distribution. The systematic effects of the o
tagand ∆E cuts, as well as the minimum energy thresholds in the calorimeter were found to be negligible.
All systematic uncertainties are summarized in Table II.
The total systematic uncertainty is calculated by sum- ming all contributions in quadrature and is generally smaller than the statistical error.
In conclusion, we have performed a search for B → h
(∗)ν ν ¯ decays in nine different modes with a fully
reconstructed B
tagon a data sample of 772 × 10
6B B ¯ pairs collected at the Υ(4S) resonance with the Belle detector. No significant signal is observed and we set upper limits on the branching fraction at 90% C.L. The results of this analysis supersede the previous results from Belle [6]. The limits reported here for K
∗+ν ν, ¯ π
+ν ν, ¯ π
0ν ν ¯ and ρ
0ν ν ¯ are the most stringent constraints to date [17]. These limits are above SM predictions and allow room for new physics contributions. The upcom- ing Belle II experiment [18] should be able to reach a sensitivity high enough to probe the SM predictions for exclusive b → sν ν ¯ decays.
We thank the KEKB group for excellent operation
of the accelerator; the KEK cryogenics group for effi-
cient solenoid operations; and the KEK computer group,
the NII, and PNNL/EMSL for valuable computing and
SINET4 network support. We acknowledge support from
MEXT, JSPS and Nagoya’s TLPRC (Japan); ARC and DIISR (Australia); NSFC (China); MSMT (Czechia); the Carl Zeiss Foundation and the DFG (Germany); DST (India); INFN (Italy); MEST, NRF, GSDC of KISTI,
and WCU (Korea); MNiSW (Poland); MES and RFAAE (Russia); ARRS (Slovenia); SNSF (Switzerland); NSC and MOE (Taiwan); and DOE and NSF (USA).
[1] G. Buchalla, Nucl. Phys. Proc. Suppl.
209, 137 (2010).[2] W. Altmannshofer, A.J. Buras, D.M. Staub and M. Wick, JHEP
0904,022 (2009). M. Bartsch, M. Beylich, G. Buchalla and D. N. Gao, JHEP
0911,011 (2009).
[3] A. Schwartz, N. G. Deshpande and J. Urheim, Phys. Rev.
D
44, 291 (1991). G. Buchalla, G. Hiller and G. Isidori,Phys. Rev. D
63, 014015 (2000). C. Bird, P. Jackson,R. V. Kowalewski and M. Pospelov, Phys. Rev. Lett.
93, 201803 (2004). G. Hiller, Phys. Rev. D 70, 034018
(2004). H. K. Dreiner et al.. Phys. Rev. D
80, 035018(2009). A. J. Buras, PoS EPS-HEP2009
024(2009).
[4] M. Iwasaki et al. (Belle Collaboration), Phys. Rev. D
72, 092005 (2005), J.-T. Weiet al. (Belle Collabora- tion), Phys. Rev. Lett.
103, 171801 (2009), B. Aubertet al. (BaBar Collaboration), Phys. Rev. Lett.
93, 081802(2004), B. Aubert et al. (BaBar Collaboration), Phys.
Rev. D
79, 031102 (2009). J. P. Leeset al. (BaBar Col- laboration), Phys. Rev. D
86, 032012 (2012). T. Aaltonenet al. (CDF Collaboration), Phys. Rev. Lett.
106161801 (2011). R. Aaij et al. (LHCb Collaboration), JHEP
1207,133 (2012). R. Aaij et al. (LHCb Collaboration), Phys.
Rev. Lett.
108181806 (2012).
[5] T. E. Browder et al. (CLEO collaboration), Phys. Rev.
Lett.
86, 2950 (2001).[6] K.-F. Chen et al. (Belle Collaboration), Phys. Rev. Lett.
99, 221802 (2007).
[7] B. Aubert et al. (BaBar Collaboration), Phys. Rev. Lett.
94, 101801 (2005). B. Aubert
et al. (BaBar Collabo-
ration), Phys. Rev. D
78, 072007 (2008). P. del AmoSanchez et al. (BaBar Collaboration) Phys. Rev. D
82,112002 (2010).
[8] B. Aubert et al. (BaBar Collaboration), arXiv:1303.7465 [hep-ex] (2013).
[9] Throughout this paper, the inclusion of the charge- conjugate decay mode is implied unless otherwise stated.
[10] A. Abashian et al. (Belle Collaboration), Nucl. Instr. and Meth. A
479, 117 (2002).[11] Z. Natkaniec et al. (Belle SVD2 Group), Nucl. Instr. and Meth. A
560, 1 (2006).[12] R. Brun et al., GEANT 3.21, CERN Report No.
DD/EE/84-1 (1987).
[13] M. Feindt et al., Nucl. Instr. and Meth. A
654, 432(2011).
[14] E. Won et al. (Belle Collaboration), Phys. Rev. D
80,111101 (2009).
[15] S. H. Lee et al. (Belle Collaboration), Phys. Rev. Lett.
91, 261801 (2003).
[16] P. Ball and R. Zwicky, Phys. Rev. D
71, 014015 (2005);71, 014029 (2005).