Page 1 of 2 Examination
Microwave and Radar Remote Sensing
Computer Vision &
Remote Sensing Dr. Andreas Reigber
Name: …... Student ID:...
Duration: 2 hours Auxiliary Material: NO
To avoid misunderstanding, you are requested to write your answers in English.
Berlin, 24th July 2017
1. Synthetic Aperture Radar (SAR) (20 P)
a. What is a Synthetic Aperture Radar (SAR)? Explain its principal idea and its image acquisition geometry.
(2 P)
b. To achieve a SAR azimuth resolution of 1m, what antenna length is needed? Why is this resolution much higher than a classical Real Aperture Radar / SLAR can achieve with the same antenna length?
(3 P)
c. To achieve an even higher resolution with the same antenna length, the Spotlight SAR mode can be used. Explain its idea and differences to “normal” SAR.
(3 P)
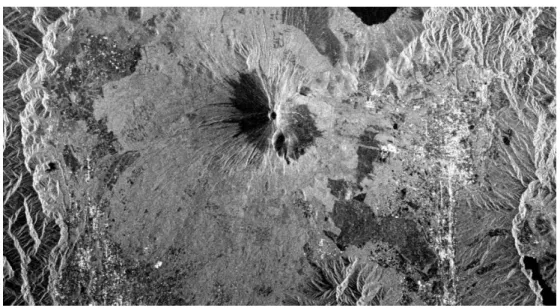
d. Explain the so-called “layover” and “shadow” effect in SAR imaging (use a sketch if necessary).
Identify them in the following image (Fig. 1).
(4 P)
e. Identify also the direction of illumination of the radar in Fig. 1. (1 P) f. In Fig. 1, identify two types of areas with high backscatter and two types of areas with low back-
scatter. Explain what you see in these areas and why these areas have high or low backscatter.
(4 P)
g. What is the name of the “noise” like effect always present in SAR images? What is its origin? (3 P)
Fig. 1: SAR image example.
Page 2 of 2
2. SAR Polarimetry (20 P)
a. What are “repeat-pass” sensors and their main application? Give one example for a space-borne SAR system capable of repeat-pass acquisitions.
(3 P)
b. What are “single-pass” sensors and their main application? Give one example for a space-borne SAR system capable of single-pass acquisitions.
(3 P)
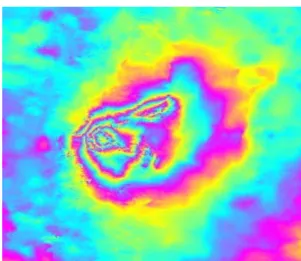
c. Fig. 2 shows a SAR interferogram after flat-earth removal, acquired by the ERS-2 satellite at C- band. In this example, a mountainous region was imaged. Where in the image is the highest peak located? Mark it with a clear cross.
(1 P)
d. In the below example, why do areas with the same colour (e.g. yellow) resp. phase do not possess all the same topographic height? What needs to be done to resolve that?
(2 P)
e. The interferometric coherence is a measure of phase quality. How is it calculated and how does an interferogram looks like in areas of low coherence?
(3 P)
f. What kinds of surfaces are expected to show high coherence and which are expected to show low coherence (2 examples each)?
(3 P)
g. Make a simple proposal describing how the deformation occurring during an earthquake could be estimated by using SAR imagery.
(5 P)
3. SAR Polarimetry (10 P)
a. How many independent polarisation channels exist for a monostatic SAR system? Give an example.
(4 P)
b. The Pauli-representation is often used to display polarimetric SAR images. What do the three different channels correspond to, and why is this representation more attractive than a simple HH-VV-HV image?
(6 P)
Altogether 50 points can be obtained.
A short and accurate style as well as a clear handwriting should be intended.
Pay attention to a clear and comprehensible preparation of sketches.
Good luck!
Fig. 2: Example of an SAR interferogram