Crop Growth Monitoring by Hyperspectral and Microwave Remote Sensing
Inaugural-Dissertation zur Erlangung des Doktorgrades
der Mathematisch-Naturwissenschaftlichen Fakultät der Universität zu Köln
vorgelegt von Wolfgang Koppe
aus Jena
Friedrichshafen, 12.11.2013
Berichterstatter: Prof. Dr. Georg Bareth
Prof. Dr. Karl Schneider
Tag der mündlichen Prüfung: 21.01.2014
I
ABSTRACT
Timely monitoring of crop growth status at different scales is crucial for improving regional crop management decisions. The main objective of the recent study is a model development to predict and estimate crop parameters, here biomass, plant N concentration and plant height, based on different earth observation systems that provide complementary information. Among these are the hyperspectral sensor Hyperion and the multi-spectral sensor ALI based on EO-1 satellite, ASAR on Envisat and TerraSAR-X. Based on the characteristics of the different systems, methods are analysed regarding crop parameter estimation and crop growth status monitoring on a regional level. Factors which are taken into account for optical data are bandwidth and centre of the wavebands, spectral reflectance response from visible and near infrared and the performance of vegetation indices based on the two sensors for semi- empirical parameter estimation. Concerning the SAR sensors Envisat ASAR and TerraSAR-X, parameters such as wavelength, incidence angle and polarization were analysed in terms of crop parameter retrieval and crop status determination. For this, two test areas, one for winter wheat in Northern China Plain (Huimin County) and one for rice in the Northeast of China (Jiansanjiang) were selected. At both sites, intensive ground data collection during the vegetation periods in 2006, 2007 for Huimin and 2009 and 2011 for Jiansanjiang were performed.
Concerning the winter wheat crop monitoring based on hyperspectral, multi-spectral and C-band SAR data, the study was conducted in Huimin County, Shandong Province of China in the growing season of 2005/2006 involving three large winter wheat fields each year managed by different farmers. Winter wheat growth parameters including aboveground biomass, plant N concentration, LAI, and plant height were collected at different growth stages. Three different prediction models were investigated:
traditional vegetation indices calculated from broad and narrow bands, and
Normalized Ratio Indices (NRI) calculated from all possible two-band combinations of
Hyperion between 400 and 2500 nm. The results indicated that TVI performed best
among the tested vegetation indices using either broad bands (R
2= 0.69, 0.32 and 0.64
for biomass, N concentration and plant height, respectively) or narrow bands (R
2=
II 0.71, 0.33 and 0.65 for biomass, N concentration and plant height, respectively). The best performing Normalized Ratio Index (NRI) selected through band combination analysis were significantly better than TVI, achieving R
2of 0.83, 0.81 and 0.79 for biomass, plant N concentration and plant height, respectively. The different NRI models use wavebands from the NIR (centred at 874, 732, and 763 nm) and the SWIR (centred at 1225 and 1305 nm) spectrum with varying bandwidth between 10 and 190 nm. The result of this part proved that vegetation indices derived from NIR- and SWIR- Hyperion spectrum are better predictors of plant aboveground biomass, nitrogen concentration and plant height than indices derived from only visible spectrum. In addition, Envisat ASAR VV polarization data were related to winter wheat crop parameters. Bivariate correlation results from this study indicate that both multi- temporal EO-1 Hyperion as well as Envisat ASAR data provides notable relationships with crop conditions. As expected, linear correlation of hyperspectral data performed slightly better for biomass estimation (R
2= 0.83) than microwave data (R
2= 0.75) for the 2006 field survey. Based on the results, hyperspectral Hyperion data seem to be more sensitive to crop conditions. Improvements for crop parameter estimation were achieved by combining hyperspectral indices and microwave backscatter into a multiple regression analysis as a function of crop parameter. Combined analysis was performed for biomass estimation (R
2= 0.90) with notable improvements in prediction power.
For the rice monitoring in the Sanjiang Plain, Northeast China, the main objective was the understanding of the coherent co-polarised X-band backscattering signature of rice at different phenological stages in order to retrieve growth status. For this, multi- temporal dual polarimetric TerraSAR-X High Resolution SpotLight data (HH/VV) as well as single polarised StripMap (VV) data were acquired from the test site. In conjunction with the satellite data acquisition, a ground truth field campaign was carried out.
The backscattering coefficients at HH and VV of the observed fields were extracted on
the different dates and analysed as a function of rice phenology to provide a physical
interpretation for the co-polarised backscatter response in a temporal and spatial
manner. Then, a correlation analysis was carried out between TerraSAR-X
III backscattering signal and rice biomass of stem, leaf and head to evaluate the relationship with different vertical layers within the rice vegetation.
HH and VV signatures show two phases of backscatter increase, one at the beginning up to 46 days after transplanting and a second one from 80 days after transplanting onwards. The first increase is related to increasing double bounce reflection from the surface-stem interaction. Then, a decreasing trend of both polarizations can be observed due to signal attenuation by increasing leaf density. A second slight increase is observed during senescence. Correlation analysis showed a significant relationship with different vertical layers at different phenological stages which prove the physical interpretation of X-band backscatter of rice. The seasonal backscatter coefficient showed that X-band is highly sensitive to changes in size, orientation and density of the dominant elements in the upper canopy.
Overall, the study demonstrated successfully the estimation of crop status by multi-
sensoral remote sensing data. The use of different sensor systems to acquire timely
information is especially important for agricultural decision support systems. Thus, as
many different systems are available in the future, the combination of different
satellite sources is gaining more importance.
IV
KURZZUSAMMENFASSUNG
Methoden und Techniken der Fernerkundung fungieren als wichtige Hilfsmittel im regionalen Umweltmanagement. Um diese zu optimieren, untersucht die folgende Arbeit sowohl die Verwendung als auch Synergien verschiedener Sensoren aus unterschiedlichen Wellenlängenbereichen.
Der Fokus liegt auf der Modellentwicklung zur Ableitung von Pflanzenparametern aus fernerkundlichen Bestandsmessungen sowie auf deren Bewertung. Zu den verwendeten komplementären Fernerkundungssystemen zählen die Sensoren EO-1 Hyperion und ALI, Envisat ASAR sowie TerraSAR-X. Für die optischen Hyper- und Multispektralsysteme werden die Reflexion verschiedener Spektralbereiche sowie die Performanz der daraus abgeleiteten Vegetationsindizes untersucht und bewertet. Im Hinblick auf die verwendeten Radarsysteme konzentriert sich die Untersuchung auf Parameter wie Wellenlänge, Einfallswinkel, Radarrückstreuung und Polarisation. Die Eigenschaften verschiedener Parameterkombinationen werden hierbei dargestellt und der komplementäre Beitrag der Radarfernerkundung zur Wachstumsüberwachung bewertet. Hierzu wurden zwei Testgebiete, eines für Winterweizen in der Nordchinesischen Tiefebene und eines für Reis im Nordosten Chinas ausgewählt. In beiden Gebieten wurden während der Wachstumsperioden umfangreiche Feldmessungen von Bestandsparametern während der Satellitenüberflüge oder zeitnah dazu durchgeführt.
Mit Hilfe von linearen Regressionsmodellen zwischen Satellitendaten und Biomasse
wird die Sensitivität hyperspektraler Reflexion und Radarrückstreuung im Hinblick auf
das Wachstum des Winterweizens untersucht. Für die optischen Daten werden drei
verschiedene Modelvarianten untersucht: traditionelle Vegetationsindices berechnet
aus Multispektraldaten, traditionelle Vegetationsindices berechnet aus
Hyperspektraldaten sowie die Berechnung von Normalised Ratio Indices (NRI)
basierend auf allen möglichen 2-Band Kombinationen im Spektralbereich zwischen 400
und 2500 nm. Weiterhin wird die gemessene Biomasse mit der gleichpolarisierten (VV)
C-Band Rückstreuung des Envisat ASAR Sensors linear in Beziehung gesetzt. Um den
V komplementären Informationsgehalt von Hyperspektral und Radardaten zu nutzen, werden optische und Radardaten für die Parameterableitung kombiniert eingesetzt.
Das Hauptziel für das Reisanbaugebiet im Nordosten Chinas ist das Verständnis über die kohärente Dualpolarimetrische X-Band Rückstreuung zu verschiedenen phänologischen Wachstumsstadien. Hierfür werden die gleichpolarisierte TerraSAR-X Rückstreuung (HH und VV) sowie abgeleitete polarimetrische Parameter untersucht und mit verschiedenen Ebenen im Bestand in Beziehung gesetzt. Weiterhin wird der Einfluss der Variation von Einfallswinkel und Auflösung auf die Bestandsparameterableitung quantifiziert. Neben der Signatur von HH und VV ermöglichen vor allem die polarimetrischen Parameter Phasendifferenz, Ratio, Koherenz und Entropy-Alpha die Bestimmung bestimmter Wachstumsstadien.
Die Ergebnisse der Arbeit zeigen, dass die komplementären Fernerkundungssysteme
Optik und Radar die Ableitung von Pflanzenparametern und die Bestimmung von
Heterogenitäten in den Beständen ermöglichen. Die Synergien diesbezüglich müssen
auch in Zukunft weiter untersucht werden, da neue und immer variablere
Fernerkundungssysteme zur Verfügung stehen werden und das Umweltmanagement
weiter verbessern können.
VI
ACKNOWLEDGEMENT
The thesis was embedded in The International Center For Agro-Informatics and Sustainable Development (ICASD). The research of this project was supported by different institutions and companies: the Natural Science Foundation of China (Project number: 30571080), International Bureau of the BMBF, the GIS&RS Group of the University of Cologne, the Sino-German Cooperative Nitrogen Management Project (MOST 2007DFA30850), the Qixing Research and Development Center in Heilongjiang and Astrium GEO-Information Services.
The thesis was supervised by Prof. Dr. Georg Bareth, which is also the person to whom I owe most for many reasons. First, he was giving me the chance to come to the University of Cologne to participate in his pleasant working group and to start working on the thesis. Furthermore, his enthusiastic and motivating way of supervising was like a “fountain” of ideas and always refreshing which enabled me to continue and accomplish the thesis, even in difficult times. After leaving the University and the interesting city of Cologne, Prof. Bareth provided always support and continued taking care for me – Vielen Dank!
I also thank to Prof. Dr. Karl Schneider, for his willing to act as the second examiner for the thesis and for providing software licences and support during my time in Cologne.
Furthermore, my sincerely thanks to
• Jürgen Janoth, for fully supporting my PhD activities at Infoterra.
• Simon Hennig and Martin Gnyp and many more students for working hard in the field.
• All colleagues of the “Bareth working group”, for the always fruitful
collaboration and for not getting tired to weaken my dislike of Cologne and for making it a nice place for living.
And finally special thanks to my parents, who always supported the long and rocky way
with warm words and Thüringer Klöße!
VII
TABLE OF CONTENT
ABSTRACT ...I KURZZUSAMMENFASSUNG ... IV ACKNOWLEDGEMENT ... VI TABLE OF CONTENT ... VII LIST OF FIGURES ... IX LIST OF TABLES ... XI LIST OF ABBREVIATIONS... XII
1 INTRODUCTION ... 1
1.1 Motivation ... 1
1.2 Thesis Outline ... 3
1.3 Remote Sensing for Supporting Crop Monitoring ... 4
1.4 Objective and Hypotheses ... 10
2 LITERATURE REVIEW ... 12
2.1 Multispectral and Hyperspectral Imaging ... 12
2.1.1 Reflectance Properties ... 12
2.1.1.1 Atmospheric Effects ... 15
2.1.1.2 Radiance and Reflectance ... 16
2.1.2 Hyperspectral Crop Monitoring* ... 17
2.2 Synthetic Aperture Radar ... 19
2.2.1 SAR System Parameters ... 20
2.2.1.1 Frequency ... 20
2.2.1.2 Radar Equation ... 21
2.2.1.3 Range and Azimuth Resolution ... 22
2.2.2 Properties of Imaging Radar ... 23
2.2.2.1 Speckle ... 23
2.2.2.2 Image Geometry and Geometric Distortions ... 24
2.2.2.3 SAR Interaction with the Target ... 25
2.2.2.4 Scattering Mechanism ... 27
2.2.2.5 Polarization ... 30
2.2.2.6 Compact Polarimetric Data ... 32
2.2.3 State of the Art SAR Crop Monitoring ... 32
2.2.3.1 Rice Crop Monitoring ... 33
2.2.3.2 Winter Wheat Crop Monitoring ... 36
2.3 Synergism of Optical and SAR ... 37
3 METHODS AND USED DATA ... 40
3.1 Ground Truth ... 42
3.1.1 Huimin County Test Site* ... 42
3.1.1.1 Experimental Design ... 43
3.1.1.2 Field Measurements ... 44
3.1.2 Jiansanjiang Test Site* ... 49
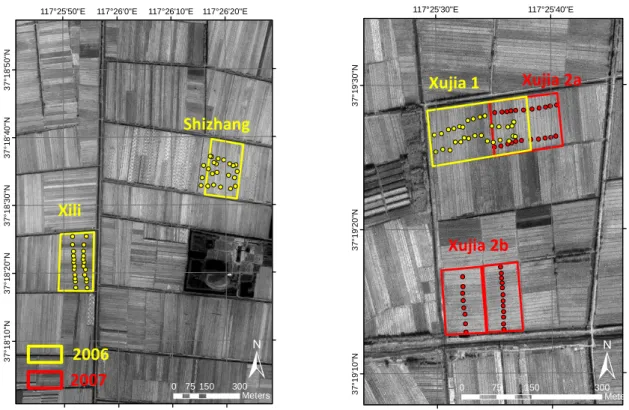
3.1.2.1 Experimental Design ... 50
3.1.2.2 Field Measurements ... 52
3.2 Satellite Data Acquisitions, Processing and Analysis ... 53
3.2.1 EO-1 Hyperion and ALI* ... 55
3.2.1.1 EO-1 Hyperion and ALI Processing ... 56
3.2.1.2 Analysis of Hyperspectral EO-1 Hyperion Data ... 58
VIII
3.2.2 Envisat ASAR Processing* ... 60
3.2.3 TerraSAR-X Processing ... 63
3.2.3.1 Speckle Suppression ... 65
3.2.3.2 Power ... 68
3.2.3.3 Correlation ... 69
3.2.3.4 Compact Polarimetric Decomposition ... 71
3.2.4 Statistical Analysis* ... 72
4 RESULTS ... 75
4.1 Crop Phenological Development ... 75
4.1.1 Winter Wheat Growth* ... 75
4.1.2 Rice Growth ... 78
4.2 Hyperspectral Imaging of Winter Wheat ... 83
4.2.1 Spectral Reflectance as a Function of Crop Parameters* ... 83
4.2.2 Spectral Vegetation Indices and the Relationship with Crop Parameters* ... 86
4.2.2.1 Single Band Relationship with Crop Parameters ... 86
4.2.2.2 Standard Broad Band and Narrow Band Vegetation Indices ... 87
4.2.2.3 Relationship of Narrow Band Normalized Ratio Indices (NRI) with Crop Parameters ... 88
4.2.2.4 Validation of NRI model ... 89
4.2.3 Discussion of Multispectral and Hyperspectral Data for Winter Wheat Monitoring* ... 91
4.2.3.1 Processing of EO-1 Data ... 91
4.2.3.2 Single Band and Standard Vegetation Indices ... 92
4.2.3.3 Narrow Band Normalized Difference Indices ... 93
4.3 Winter Wheat Monitoring with C-band ... 96
4.3.1 Temporal Backscatter Behaviour of Winter Wheat ... 96
4.3.2 Relating Crop Condition to Envisat ASAR ... 98
4.3.3 Discussion of C-band SAR Data for Wheat Monitoring ... 99
4.4 Synergy of Hyperspectral and C-band SAR Data for Crop Parameter Estimation* ... 100
4.5 Polarimetric Rice Monitoring with X-band ... 102
4.5.1 Power: Backscattering Signature and Ratio ... 102
4.5.1.1 Incidence Angle Differences ... 103
4.5.1.2 Typical Backscattering Signature ... 104
4.5.1.3 Co-pol Ratio (HH/VV) ... 105
4.5.2 Correlation: Polarimetric Coherence and Phase Difference ... 106
4.5.3 Polarimetric Decomposition: Alpha and Entropy ... 107
4.5.4 Correlation Analysis between Backscattering Coefficients and Plant Variables* ... 108
4.5.5 Polarimetric Growth Stage Monitoring... 111
4.5.6 Discussion of Polarimetric Rice Monitoring* ... 113
4.5.6.1 Incidence Angle ... 119
4.5.6.2 Polarimetric Parameters ... 119
5 SYNERGISTIC SUMMARY AND CONCLUSION ... 122
5.1 Hyperspectral Imaging ... 123
5.2 SAR C-band Imaging and Synergism of Optic and SAR ... 124
5.3 SAR X-band Imaging ... 125
5.4 Validation of Hypothesis and Objectives ... 126
5.4.1 Huimin Test Site ... 126
5.4.2 Jiansanjiang Test Site ... 128
6 REFERENCES ... 129
APPENDIX ... 141
A.1: Selection of Standard Vegetation Indices ... 141
A.2: TerraSAR-X HH and VV Imagery of Rice ... 142
A.3: Separability of Rice against other Crops ... 145
A.4: Polarimetric parameters for rice and non-rice. ... 148
IX
LIST OF FIGURES
Figure 1-1: Recent and future earth observation optical satellite missions. ... 7
Figure 1-2: Recent and future earth observation SAR satellite missions. ... 8
Figure 2-1: Hyperspectral image cube of EO-1 Hyperion extracted over the study site in Huimin County. ... 14
Figure 2-2: Typical reflectance curves (soil and vegetation) extracted from EO-1 Hyperion of Huimin County (April 19, 2006). ... 15
Figure 2-3: Inter-relationship between wavelength and frequency for the most common SAR systems on a log scale (modified after Henderson & Lewis 1998). ... 21
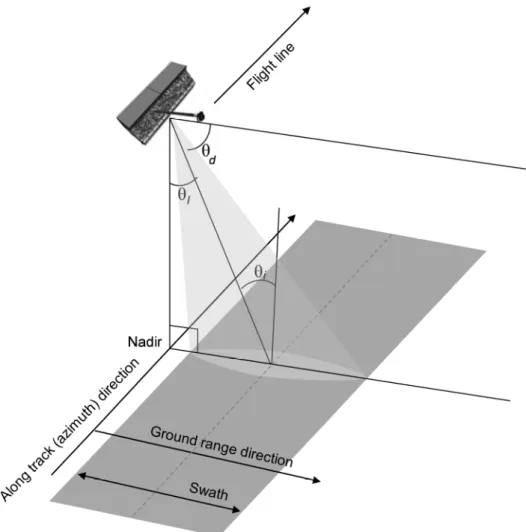
Figure 2-4: Imaging geometry of side looking SAR (modified after Woodhouse 2006).
θlis the look angle,
θdis the depression angle and
θithe incidence angle. ... 24
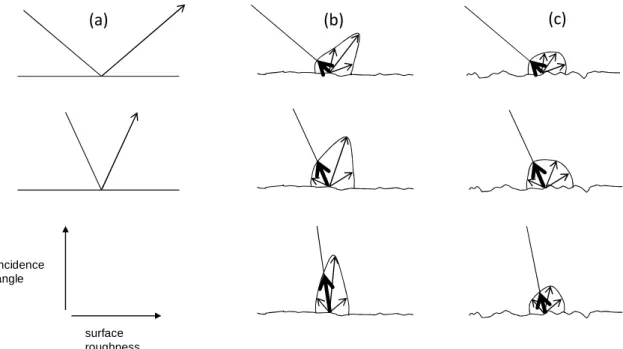
Figure 2-5: Backscatter as a function of surface roughness (after Woodhouse 2006). ... 27
Figure 3-1: Overview of processing steps applied in the thesis. ... 41
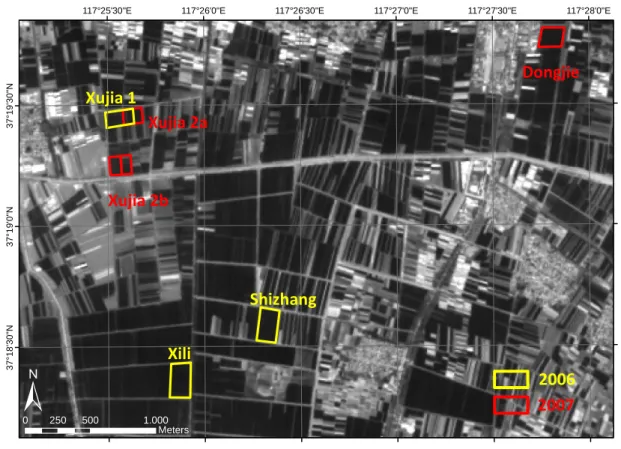
Figure 3-2: Test sites in Huimin County (Gnyp et al. 2013). ... 43
Figure 3-3: Farming fields in Huimin County. ... 44
Figure 3-4: Farming fields in Huimin County with measurement points. ... 45
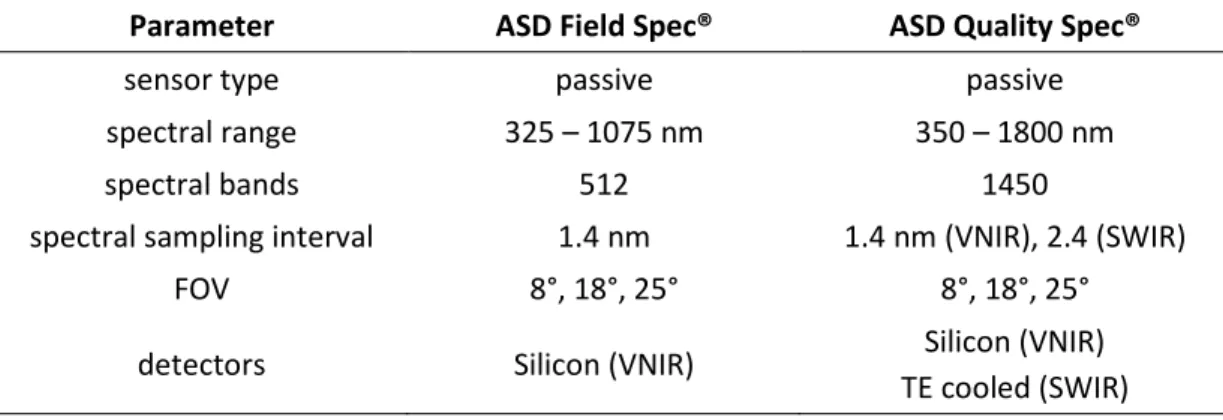
Figure 3-5: Arrangement of canopy spectral reflectance measurements with ASD Handheld and QualitySpec (modified after Laudien 2007). ... 47
Figure 3-6: Canopy spectral reflectance measurements at April 7, 2006 (Photo Martin Gnyp). ... 48
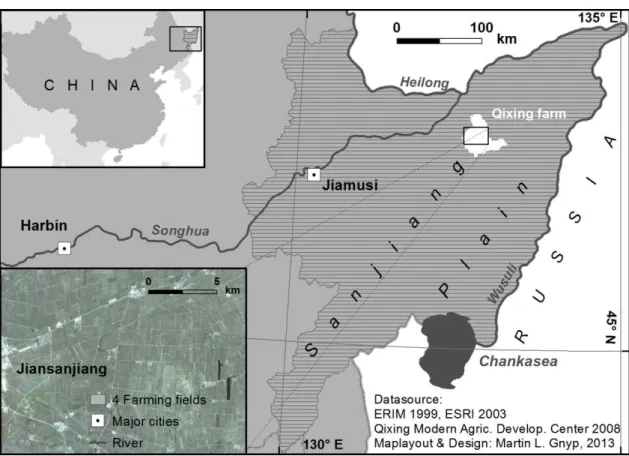
Figure 3-7: Test sites in Jiansanjiang (Gnyp et al. 2013). ... 49
Figure 3-8: Experimental design of the Jiansanjiang test site. ... 51
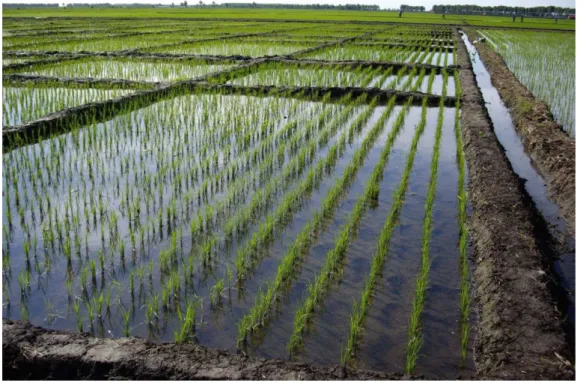
Figure 3-9: Small plots within larger rice fields (Photo Martin Gnyp 2009). ... 52
Figure 3-10: Pre-processing steps of EO-1 Hyperion data. ... 56
Figure 3-11: Comparison of single pixel spectra before (a) and after (b) atmospheric correction. Spectra were acquired on April 19, 2006. ... 57
Figure 3-12: Processing chain of Envisat ASAR. ... 61
Figure 3-13: Processing chain of TerraSAR-X. ... 65
Figure 3-14: SAR filter results (based on HS, August 8, 2009). Left: Unfiltered. Middle: Level Bell. Right: Anisotropic, 8 iterations. ... 68
Figure 4-1: Biomass development of winter wheat in 2006 and dates of image and ground truth acquisition. ... 76
Figure 4-2: Spatial-temporal distribution of dry matter of two fields in 2006. ... 77
Figure 4-3: Rice growth stages, growth phases as well as plant height and total biomass graphs of the growing season of 2009 and 2011. Time is represented in days after transplantation (modified after Koppe et al. 2013). ... 81
Figure 4-4: Total dry matter and yield measured at the farmers’ fields. Fields with biomass measurements and plots with detailed sampling. ... 82
Figure 4-5: Reflection behavior of winter wheat (Xili). Left: recorded by ASD Fieldspec (blue) and EO-1
Hyperion (red) in 2006. Right: recorded by QualitySpec (blue) and EO-1 Hyperion (red) in
2007. ... 84
X
Figure 4-6: Correlation coefficient (r) between Hyperion single band reflection and biomass in the
growing season of 2006. ... 87
Figure 4-7: Coefficient of determination (R
2) between Hyperion narrow band vegetation indices calculated from all possible two-band combinations and biomass (a) and total nitrogen content (b) (Koppe et al. 2010a). ... 89
Figure 4-8: Measured versus predicted aboveground biomass using the regression model described in equation 4.2 (Koppe et al. 2012). ... 91
Figure 4-9: Scatterplot of (a) aboveground biomass against standard narrow band NDVI and (b) best waveband combination from NRI, 874 nm and 1225 nm (Koppe et al. 2010a). ... 95
Figure 4-10: Temporal evolution for bare soil (green) and winter wheat (blue) of C-VV backscatter (Koppe et al. 2012). ... 96
Figure 4-11: C-VV backscatter related to aboveground biomass (Koppe et al. 2012). ... 99
Figure 4-12: Mean temporal backscattering coefficient (sigma nought) for different incidence angles of VV and HH of rice during the vegetation periods in 2009 and 2011. (a) SL, 26°. (b) HS, 39° and SM, 36°. (c) SL, 46°. ... 103
Figure 4-13: TerraSAR-X Spotlight images at HH (top), VV (down) at three acquisition dates in 2009 (modified after Koppe et al. 2013). ... 104
Figure 4-14: HH/VV ratio of six rice parcels as a function of time at 26° incidence angle. ... 106
Figure 4-15: Co-polar phase difference and coherence of six rice parcels as a function of time at 26° incidence. ... 107
Figure 4-16: Co-polar eigenvector decomposition (alpha and entropy) of six rice parcels at 26° incidence. ... 108
Figure 4-17: Relating phenological stage of rice to polarimetric parameters. ... 112
Figure 4-18: Correlation coefficients of TerraSAR-X HS backscatter (VV and HH) with stem, leaf, head and total biomass at DAT 35, 46 and 79. ... 115
Figure 4-19: Backscatter behavior of rice at different growth stages. (a) Flooded rice field, DAT 0. (b) Early vegetative stage, DAT 35. (c) Late vegetative stage, DAT 46. (d) Reproductive stage, DAT 79. ... 116
Figure 4-20: Left: Comparison of σ
0signature between problematic fields (blue dashed line) and average of the normal growing fields (red solid line) based on SM VV backscatter. Upper right: Photo of a problematic field. Lower right: Photo of a normally growing field. ... 117
Figure 4-21: Left: Comparison of coherence signatures of different land cover classes. Right: Coherence image (July 7, 2011). ... 121
Figure A-1: Landcover classification (TerraSAR-X HS 2009, July 5 and July 27) (modified after Hütt, 2012), overlaid by experimental plots. ... 142
Figure A-2: TerraSAR-X HH and VV images (incidence angle 26°) of growing season of 2011). ... 144
Figure A-3: X-band backscatter (inc. angle 39°) of HH and VV of rice crop 2009. ... 145
Figure A-4: TerraSAR-X color composite of DAT 46 and DAT 68 (2009). ... 145
Figure A-5: Separability analyses of land cover classes based on HH and VV difference (modified after Hütt 2012). ... 146
Figure A-6: Separability analyses of land cover classes based on alpha angle (modified after Hütt 2012). ... 146
Figure A-7: Land cover classifications (modified after Hütt 2012). ... 147
Figure A-8: Polarimetric parameters for rice and non-rice for incidence angle of 26° and 46°. ... 149
XI
LIST OF TABLES
Table 2-1: Crop characteristics which influence remote sensing in the VIS – NIR and in the microwave
domain (Kühbauch & Hawlitschka 2003). ... 38
Table 3-1: Soil chemical properties of the farming fields in 2006 (Li et al. 2008). ... 44
Table 3-2: Sensor specifications of ASD Field Spec and Quality Spec (Analytical Spectral Devices 1999).. 47
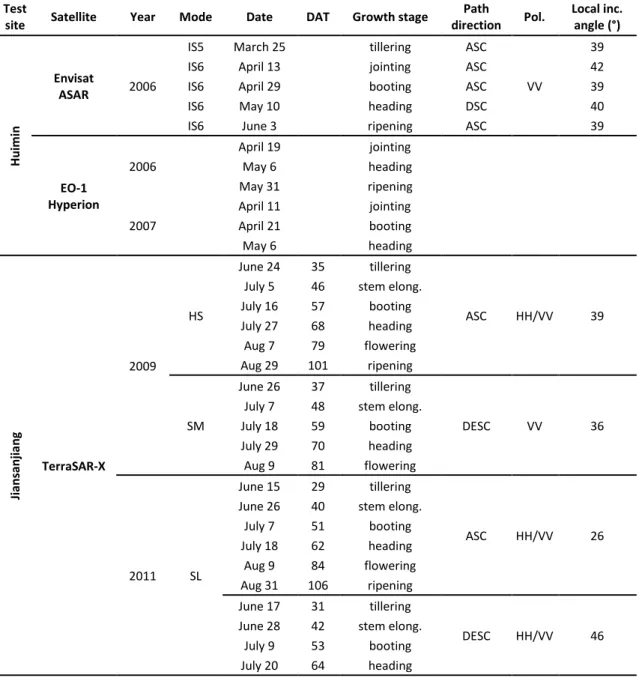
Table 3-3: Acquired satellite data for the test sites Huimin and Jiansanjiang (modified after Koppe et al. 2012 and Koppe et al. 2013). ... 54
Table 3-4: Technical specification of EO-1 Hyperion and ALI. ... 55
Table 3-5: Standard vegetation indices evaluated in this study (Koppe et al. 2010a). ... 59
Table 3-6: Technical specification of Envisat ASAR. ... 61
Table 3-7: Technical specification of TerraSAR-X and TanDEM-X. ... 64
Table 3-8: Quantitative measurement of noise for standard adaptive and experimental filters. ... 67
Table 4-1: Crop growth variables measured at different dates in 2006 and 2007 (Koppe et al. 2012). .... 77
Table 4-2: Statistics of measured agronomic parameters during the field campaign 2009 (modified after Koppe et al. 2013). ... 79
Table 4-3: Information about field experiments in 2009 and 2011. ... 80
Table 4-4: Coefficient of determination (R
2) between ALI broad band, Hyperion narrow band vegetation indices and measured agronomic parameters (Koppe et al. 2010a)... 86
Table 4-5: Coefficient of determination (R
2) between biomass and NRI for the validation model based on multi-temporal and mono-temporal data (modified after Koppe et al. 2012). ... 90
Table 4-6: Coefficient of determination (R
2) between biomass and Envisat ASAR backscatter (Koppe et al. 2012). ... 99
Table 4-7: Coefficient of determination (R
2) between biomass and Envisat ASAR backscatter (Koppe et al. 2012). ... 101
Table 4-8: Correlation coefficients (R
2) between backscatter (HH and VV) and plant variables, including total biomass of the whole plant and the components stem, leaf and head for HS and SM (modified after Koppe et al. 2013). ... 110
Table 5-1: Validation of objective and hypothesis for Huimin test site. ... 127
Table 5-2: Validation of objective and hypothesis for Jiansanjiang test site. ... 128
Table A-1: Standard vegetation indices. ... 141
XII
LIST OF ABBREVIATIONS
ALI Advanced Land Imager
ASAR Advanced Synthetic Aperture Radar
ASD Analytical Spectral Device
BBCH Biologische Bundesanstalt, Bundessortenamt und
Chemische Industrie
BIOM Biomass
DAT Day After Transplanting
dB Decibel
DN Digital Number
ENL Effective Number of Looks
EO-1 Earth Observing 1 mission
FAO Food Agricultural Organization
GCP Ground Control Point
GHz Gigahertz
GIS Geographical Information System
GMES Global Monitoring for Environment and Security
HH Horizontal-Horizontal (polarization)
HR High Resolution
HS High-Resolution SpotLight
IEEE Institute of Electrical and Electronics Engineers ICASD International Center for Agro-Informatics and
Sustainable Development
IR Infrared
LAI Leaf Area Index
MARS Monitoring Agricultural ResourceS
NDVI Normalized Differenced Vegetation Index
NIR Near Infrared
NRI Normalised Ratio Index
OSAVI Optimised Soil-Adjusted Vegetation Index
PAZ Identical satellite to TerraSAR-X, Spanish for peace
XIII POLInSAR Polarimetric Interferometric SAR
PPD Polarimetric Phase Difference
PRF Pulse Repetition Frequency
PWC Plant Water Content
RADAR Radio Detection and Ranging
RAR Real Aperture Radar
REP Red Edge Position
RE Relative Error
RMSE Root Mean Square Error
SAR Synthetic Aperture Radar
SEAMLESS System for Environmental and Agricultural Modelling;
Linking European Science and Society
SLAR Side Looking Radar Systems
SL SpotLight
SM StripMap
SR Simple Ratio
SWIR Short Wave Infrared
TCI Triangle Chlorophyll Vegetation Index
STD Standard Deviation
TIROS Television and InfraRed Observation Satellite
TanDEM-X TerraSAR-X-Add-on for Digital Elevation Measurements
TVI Triangular Vegetation Index
UAV Unmanned Aerial Vehicle
VHR Very High Resolution
VIS Visible
VV Vertical-Vertical (polarization)
WB World Bank
WFP World Food Program
WRS World Reference System
1
1 INTRODUCTION
The recent study with its elaborate design would not have been possible without and is closely interwoven with the research of The International Center For Agro-Informatics and Sustainable Development (ICASD). The ICASD is a cooperation between the Institute of Geography, University of Cologne and the College of Resources and Environmental Sciences, China Agricultural University. The overall mission of the Center is to promote the sustainable development of intensive agriculture, an efficient management of natural resources as well as the application of information technology in agriculture.
Within the framework of this cooperation, the focus of this thesis lies on the integration of active and passive remote sensing technologies into modern agricultural management.
1.1 Motivation
As cereal grains, rice (Oryza) and wheat (Triticum) are the most important agricultural crops covering together 369 million ha of earth’s surface in 2010, accounting for 53%
of total harvested area of cereal crops in 2010 (FAOSTATS 2013). The productions
quantity amounts to 672 million tons rice and 650 million tons wheat in 2010,
representing over 54% of the total production amount of cereal crops. Over the last 40
years, the cereal production quantity increased by 20% in average per decade,
whereas the harvested area remains constant in a certain range (FAOSTATS 2013). As a
consequence, most of the increase must be attributed to a more efficient agricultural
production due to increase of fertilizer, pesticides and water supply as well as the
usage of new cropping technologies. Beside to positive effects concerning productivity,
along with the intensification of agricultural production also environmental problems
may arise. The use of pesticides and over-fertilization contaminates surface and
ground water unintendedly (Miller 2004); irrigation of crops in dry areas can lead to
depletion of underground aquifers, subsidence and salinization (ILRI 1989). As a
consequence, the intensive agriculture may aggravate temporal and permanent land
2 degradation or land use change. In 2012, global agriculture had to feed around seven billion people, and although the population growth rate is expected to decrease, in 2050 the global population will be more than nine billion (UN Database 2012). Based on these figures, improvement in production efficiency must further accelerate to guarantee food security for the next decades. According to FAO (2013), the definition of food security is as follows: “Food security is a situation that exists when all people, at all times, have physical, social and economic access to sufficient, safe and nutritious food that meets their dietary needs and food preferences for an active and healthy life”. To meet the goals and requirements for food security, different programs were established. From an European perspective, the most important program is the Global Monitoring for Environment and Security (GMES, from 2013 Copernicus), whereas one of the ‘Land Applications’ aims at global food security. For this, a global crop monitoring service shall be established with the objective of near real-time crop condition assessment and yield forecast (GMES 2012). Another European program, already established in 1988, is the Monitoring Agricultural ResourceS (MARS), providing scientific support in terms of agro-meteorological crop modelling, yield forecast and crop inventories in- and outside Europe (MARS 2012). There are further initiatives for improving food security on continental and global level, e.g. the Food and Agricultural Organization (FAO), the World Bank (WB), the World Food Programme (WFP) or the System for Environmental and Agricultural Modelling – Linking European Science and Society (SEAMLESS 2012). Beside these initiatives for food security, there is parallel also a commercial market emerging in the field of agricultural services for insurance and finance. Especially the crop insurance market is interested in timely information on productivity and an end-to-end service solution on crop status and yield forecast. In conclusion, the identified stakeholders of timely agricultural information are numerous, but primarily include: policy makers, organizations responsible for food security and environment, land use planers, crop insurances as well as the financial market controlling prices and trade volumes.
In the mentioned initiatives and programs, remote sensing based technologies are
important tools for information extraction and decision support. In this context,
remote sensing is used for gathering spatial-temporal crop information to calibrate
3 crop growth models, provide spatial variability information of crop status and final yield forecast. In particular, to cope with the imbalance between food supply and demand today and in the future, there is strong need to further investigate and develop agricultural monitoring systems that assure a sustainable use of land resources (Justice & Becker-Restef 2007).
1.2 Thesis Outline
The present thesis uses different data acquisition methods such as space-borne active and passive remote sensing, in-situ ground truth measurements and interviews to allow a quantitative analysis of the data.
Chapter 1 addresses the benefit of using remote sensing data for spatial-temporal agricultural monitoring. An overview of actual and future sensor systems for earth observation is given. Furthermore, the motivation, hypothesis and objectives and the significance of the thesis are highlighted. Chapter 2 reviews the physical properties of remote sensing, the properties of imaging spectroscopy as well as the properties of radar imagery. One focus in this chapter is put on the physics of radar imaging. Beside the physics, a literature review of agricultural monitoring based on hyperspectral and radar sensor systems is provided. In the methods part (Chapter 3) an introduction into the two different test areas, which were explored in the framework of this study, is given. Additionally to this, the used satellite imagery and the processing methods are presented. This includes the image pre-processing, the core processing of the satellite data, the collection and analysis of the ground truth data. The results of the study are presented in chapter 4. At first, winter wheat and rice phenological development are described. Subsequently the results of hyperspectral and radar crop monitoring of winter wheat are presented, followed by the polarimetric analysis of X-band rice monitoring. In each of the three sections, the results are discussed in relation to state of the art research. In chapter 5, the results and discussions from chapter 4 are summarised in relation to the objectives and hypothesis of the thesis.
The thesis is based on three published papers, which form the core of the study. The
topics addressed in the three papers are summarized in Figure 3-1. Additionally to the
4 papers, a literature review addressing the theoretical fundamentals of optical and radar remote sensing as well as a polarimetric analysis of the X-band data was carried out. The published papers are:
K OPPE , W., G NYP , M. L., L AUDIEN , R., J IA , L., L I , F., C HEN , X., Z HANG , F., & B ARETH , G., 2006:
Deriving of winter wheat characteristics from combined radar and hyperspectral data analysis. – SPIE Proceedings, Geoinformatics'2006, Wuhan, China.
K OPPE , W., L I , F., G NYP , M. L., M IAO , Y., J IA , L., C HEN , X., Z HANG , F., & B ARETH , G., 2010:
Evaluating Multispectral and Hyperspectral Satellite Remote Sensing Data for Estimating Winter Wheat Growth Parameters at Regional Scale in the North China Plain. – Photogrammetrie, Fernerkundung, Geoinformation, 3: 167-178.
K OPPE , W., G NYP , M. L., Y AO , Y., M IAO , Y., & B ARETH , G., 2011: Agricultural Monitoring with Spaceborne X-band SAR Data. – Proceedings on the Workshop of Remote Sensing Methods for Change Detection and Process Modelling, 18-19 November 2010, University of Cologne, Germany, Kölner Geographische Arbeiten, 92: 55- 61.
K OPPE , W., H ENNIG , S. D., L I , F., G NYP , M. L., M IAO , Y., J IA , L., C HEN , X., & B ARETH , G., 2012:
Multi-Temporal Hyperspectral and Radar Remote Sensing for Estimating Winter Wheat Biomass in the North China Plain. – Photogrammetrie, Fernerkundung, Geoinformation, 3: 281-298.
K OPPE , W., L I , F., G NYP , M. L., H ÜTT , C., M IAO , Y., Y AO , Y., C HEN , X., & B ARETH , G., 2013: Rice monitoring with multi-temporal and dual-polarimetric TerraSAR-X data. – International Journal of Applied Earth Observation and Geoinformation, 21: 568- 576.
1.3 Remote Sensing for Supporting Crop Monitoring
To meet the requirements for sustainable resource management, a continuous monitoring and evaluation of resources is essential. Important information for decision support on local, regional and global level are:
• information about cropped areas and crop type
• timely information on production estimate
• yield forecast
This information needs to be updated on a regular basis, as it is fundamental in terms
of agricultural production assessment and change of land use on different spatial
levels. To account frequently for agricultural production, land cover and land use, yield
forecast and environmental problems, diverse methods are used that serve different
scales. Among others, these methods surveys regarding land use and interview of
5 farmers (De Groote & Traoré 2005), collection of statistical data (FAOSTAT 2013), crop growth modelling such as ORYZA for rice (Bouman et al. 2001) as well as airborne and spaceborne remote sensing data acquisition (Moran et al. 1997). As this thesis addresses low scale spatial monitoring, the following chapters focus on space-borne remote sensing for agricultural applications.
Remote sensing is a data acquisition method that acquires information about objects on earth’s surface without any physical contact. For data retrieval the electromagnetic radiation in different wavelength is used. In general, the sensor systems are mounted on UAV (Unmanned Aerial Vehicle), plane or satellite (Albertz 2009).
Space-borne satellite earth observation allows for frequent monitoring of agricultural areas in different wavelength and spatial resolutions. The use of satellite remote sensing for earth observation has a long history. Already in the early 1960s, the first low-resolution television camera mounted on a satellite (TIROS mission – Television and InfraRed Observation Satellite) was brought into space for monitoring purpose.
Since the early 1960s, many earth observations satellites with different characteristics have been launched in order to image earth surface. Today there is a wide variety of sensor systems available, whereas the main distinguishing factors in terms of monitoring applications are:
• Orbit (sun synchronous, geosynchronous) and revisit time
• Operating frequency range
• Footprint size / swath width
• Sensor resolution and radiometric performance
• Number of spectral bands or polarizations
The listed parameters characterize the different sensor systems and qualify them for
dedicated monitoring applications such as agricultural monitoring. In Figure 1-1 and
Figure 1-2 recent and future commercial and scientific earth observation missions are
shown. The earth observations missions with optical sensors are separated into High
Resolution missions (HR) with up to 1 m resolution and Very High Resolution missions
(VHR) with a resolution higher than 1 m. As apparent from the Figure 1-1 and Figure
6 1-2, a lot of space-borne optical imaging systems from medium to very high resolution are currently available that can contribute to agricultural monitoring at different spatial and temporal scales. In the field of radar sensors there are many different systems currently in orbit. In Figure 1-2 the SAR missions are distinguished in X-, C-, S-, and L-band. In the future there will be a large number of X-band systems, the four satellites from the Cosmo-Skymed 2
ndgeneration mission or TerraSAR-X2 as well.
There is also a large number of missions in longer wavelength, enabling a complementary use of the different frequencies. In terms of SAR, the trend is towards higher resolution, larger swath width, shorter revisit time by constellation missions and full polarization.
The wide variety of missions in the optical and SAR domain allow for using
complementary information with short time intervals to improve agricultural
monitoring tasks. In the recent thesis, data from hyperspectral optical mission EO-1
Hyperion and from the SAR missions Envisat ASAR (C-band) and TerraSAR-X (X-band)
are used to extract information for crop status monitoring.
In tr o d u ct io n
7 F ig u re 1 -1 : R e ce n t a n d fu tu re e a rt h o b se rv a tio n o p tic a l s a te lli te m is sio n s.
DMC-1
DMC-2 Formosat-2
INGENIO (SEOSAT) Landsat-7 ETM
Landsat-8 (LDCM) RapidEye
Resourcesat 1 (IRS-P6)
Resourcesat 2
Sentinel-2a
Sentinel-2b SPOT-4
SPOT-5
SPOT-6 SPOT-7 SMOTR 2
SMOTR 1 Cartosat 2A
Cartosat 2B GeoEye-1
GeoEye-2 IKONOS
Plejades HR1 Plejades HR2 Quickbird (2)
Worldview 1
Worldview 2
EnMAP EO-1
PRISMA
2005 2006 2007 2008 2009 2010 2011 2012 2013 2014 2015 2016 2017 2018 2019 2020 2021 2022 2023
VHR HR
In tr o d u ct io n
8 F ig u re 1 -2 : R e ce n t a n d fu tu re e a rt h o b se rv a tio n S A R s a te lli te m is sio n s.
Radarsat 1
Radarsat 2
Radarsat Constellation 1
Radarsat Constellation 2 Radarsat Constellation 3 Sentinel 1a
Sentinel 1b ALOS (PalSAR)
ALOS-2 SAOCOM-1A
SAOCOM-1B Cosmo Skymed 1
Cosmo Skymed 2 Cosmo Skymed 3
Cosmo Skymed 4
Cosmo Skymed 2nd gen. 1
Cosmo Skymed 2nd gen. 2 Cosmo Skymed 2nd gen. 3
Cosmo Skymed 2nd gen. 4 Kompsat 5
PAZ TanDEM-X
TerraSAR-X
TerraSAR-X-2
HRWS-X GulfSAR 1
GulfSAR 2
GulfSAR 3 GulfSAR 4 SMOTR-3
NovaSAR-S
2005 2006 2007 2008 2009 2010 2011 2012 2013 2014 2015 2016 2017 2018 2019 2020 2021 2022 2023
C-band L-band X-band S-band
9 Vegetation development during the growing period is based on physical and biochemical processes which interact with environmental conditions such as atmosphere or soil (Kumar et al. 2003). The material-specific characteristics of objects (e.g. vegetation) determine the interaction of incoming radiation and the object. Based on these characteristics, the incoming radiation is either reflected or absorbed, or penetrates the object. The illumination source can be the solar radiation or in case of an active system the sensor itself (Albertz 2009). As remote sensing sensors measure the electromagnetic radiation reflected by an object, one can infer the physical properties of the object. In vegetation science, spectral algorithms such as vegetation indices were developed to extract biophysical parameters based on differential absorption, reflectance and transmittance of energy (Lyon et al. 1998).
In terms of agriculture, satellite remote sensing enables the acquisition of information that is essential for modern crop monitoring since large areas can be monitored with different sensor systems at regular intervals. The contribution of remote sensing to crop monitoring can be as follows:
• Land cover mapping. Land cover and land use mapping are among of the most important contributions of remote sensing to agricultural monitoring. Inventory map are used for assessing the dynamic change in an agricultural environment (Ran et al. 2010).
• Crop status monitoring. As reflected or backscattered energy from vegetation changes with changing plant phenological stage, remote sensing can be used to monitor plant development during the growing season (Albertz 2009).
• Crop growth modelling. Spatial remote sensing data can be linked to crop
growth models to calibrate or re-initialize crop models on the one hand, or to
upscale local simulations to a regional level (Dente et al. 2007).
10
1.4 Objective and Hypotheses
Although there are manifold recent and future earth observation missions, area-wide remote sensing based crop monitoring is still not implemented. To support crop monitoring systems by remote sensing, it is essential to acquire data at specific phenological stages to extract information that is relevant for agricultural monitoring.
Furthermore, multi-temporal remote sensing acquisitions improve monitoring during the growing season in terms of land cover mapping, crop status monitoring and the calibration of crop growth models. Beside the cost component, factors that could prevent a timely monitoring are: availability of acquisition capacity, cloud cover problems or lack of appropriate methodologies for a synergistic use of different sensor systems. Thus, it is necessary to develop methodologies to retrieve biophysical information from different sources (multispectral, hyperspectral, microwave) which can be used to supply agricultural monitoring systems. Within this thesis, optical and SAR sensors for monitoring were under investigation to validate the advantages and synergies of the different systems. Especially the new generation of X-band SAR sensors offer new capabilities for crop monitoring, but up to now only a few number of research papers on rice crop monitoring based on space-borne X-band data has been published. Based on this, specific research objectives were identified that are subdivided into four parts:
Multispectral and Hyperspectral Remote Sensing
• to quantitatively describe hyperspectral reflectance signature of winter wheat canopy during the vegetation period
• to analyse, compare and evaluate satellite based multispectral and
hyperspectral images in terms of broad band and narrow band vegetation
indices for the estimation of winter wheat aboveground biomass, plant N
concentration and plant height. It is assumed, that advanced narrow band
vegetation indices perform better than standard vegetation indices based on
multi-spectral data. Three different types of vegetation indices will be
evaluated.
11 o standard broad band vegetation indices derived from multispectral
sensor ALI
o standard narrow band vegetation indices derived from hyperspectral sensor Hyperion
o systematic identification of best waveband combinations in the Hyperion reflectance spectrum from 400 to 2500 nm
• to investigate the ability to predict crop standing biomass by different vegetation indices
C-band microwave remote sensing
• to quantitatively describe C-VV SAR backscattering of winter wheat canopy during the vegetation period
• to investigate the ability to predict crop standing biomass by Envisat ASAR
Synergy of Hyperspectral and C-band microwave remote sensing
• to explore the potential of complementary use of SAR and hyperspectral data for mapping crop and field conditions at a regional level
X-band microwave remote sensing
• to assess the potential of high-resolution and multi-polarization X-band SAR data in agricultural monitoring
• to study the sensitivity of X-band co-polar backscatter as a function of rice phenology stages based on multi-temporal acquisitions and different incidence angles
o to evaluate the relationship between X-band co-polar backscatter and biomass of the different scattering layers (stem, leaf, and head)
o to analyse to benefit of dual polarimetric X-band data for crop growth
status monitoring
12
2 LITERATURE REVIEW
This chapter introduces the essential basics of multispectral and hyperspectral imaging, SAR systems, and agricultural vegetation. The section 2.1 serves as an introduction to the field of multispectral and hyperspectral data properties and its applicability to crop monitoring. The second section (2.2) deals with the description of the SAR system parameters, with the properties of imaging radar such as radiometry, geometry, and the monitoring of crop by microwave radiation.
As multispectral and hyperspectral remote sensing has been known well for decades and described in many review papers and textbooks such as Thenkabail et al. (2011), Kumar et al. (2003), Mulla (2012) and Schowengerdt (2007), the introduction to this topic is rather short and will only address elements that are of main importance for the recent study. Due to this, the focus of the literature review is put on radar and especially on polarimetric radar remote sensing.
2.1 Multispectral and Hyperspectral Imaging
Optical remote sensing records image data in different wavelength ranges across the visual and infrared part of the electromagnetic spectrum. If image data is captured simultaneously at several frequencies, it is called multispectral imaging. Usually the electromagnetic spectrum is sampled in dedicated wavelength bands, whereas each of these bands covers a wide frequency range. Compared to this broad-band sampling of dedicated wavelength ranges with low spectral resolution, multispectral imaging offers the opportunity to acquire high spectral resolution and narrow-band image data continuously across the electromagnetic spectrum (Albertz 2009).
2.1.1 Reflectance Properties
For biochemical processes of plants the main source of energy is the incoming solar
radiation. Solar radiation is the driver of photosynthetic processes, where energy is
converted to organic compounds. The interaction of the incident electromagnetic
13 radiation with objects of the surface can be divided into the main processes:
absorption, transmission and reflectance (Kumar et al. 2003). Absorption describes a process in which energy of the incident radiation is taken by the pigments of the plants. The process of transmission, in turn, illustrates the passing of electromagnetic radiation through the vegetation without reflection or absorption. Furthermore, there is the surface reflection, whereas the incident illumination is reflected from the surface of the object. The reflectance spectrum is a function of absorption and scattering processes, determined by the biochemical composition, water content, incidence angle and geometrical characteristics of the canopy (Borengasser et al. 2007). The optical properties of the stand are therefore a complex combination of these parameters. They provide compositional information about the vegetation in the visible (VIS), near-infrared (NIR) and short wave infrared (SWIR). The reflectance curve of green vegetation has a characteristic shape from the VIS to the SWIR and is determined by vegetation attributes (Thenkabail et al. 2011).
The VIS range (400 to 700 nm) of vegetation reflectance spectrum is determined by
strong absorption of foliar pigments, whereas reflectance and transmittance of energy
is very low. Most of the energy is absorbed by chlorophyll a and chlorophyll b in the
blue and red light of the spectrum; lower amounts of energy of the blue light are also
absorbed by carotenoids (Lillesand et al. 2008). The slightly lower absorption in the
green light induces a small reflection peak in the visible portion of the spectrum. The
absorbed light of the VIS is used for electron transitions. The liberated energy of this
transition is then used for photochemical reactions. With the senescence of the plants
the reflectance behaviour changes due to chlorophyll degradation which results in an
increase of red light reflectance (Kumar et al. 2003). The transition zone between the
VIS and NIR is called the red edge zone (between 680 and 750 nm) and is characterized
by a steep reflectance slope from the low chlorophyll reflectance to the high
reflectance of the red edge shoulder. Especially the red edge inflection point, where
the slope is at its maximum, is an important indicator for chlorophyll content (Mulla
2012). Due to the lower energy level of the NIR light compared to the visible range,
most of the light is reflected or transmitted and not absorbed by the pigments. The
reflectance curve is mainly determined by the internal structure and anatomy of the
14 leaves and the water content. In the NIR, part of the incoming light is transmitted by the first leaf layers and reaches a subsequent layer. This layer also reflects and transmits the light. As a result of the multilayer structure of a vegetation canopy, the total reflectance is an addition of multiple leaf layers (Kumar et al. 2003). Within the NIR range, there are two weak water absorption bands around 970 and 1200 nm. The SWIR is dominated by water absorption bands that are centred at 1200, 1450, 1940 and 2400 nm. Compared to this, the absorption of foliar pigments is insignificant, especially in fresh leaves (Schowengerdt 2007).
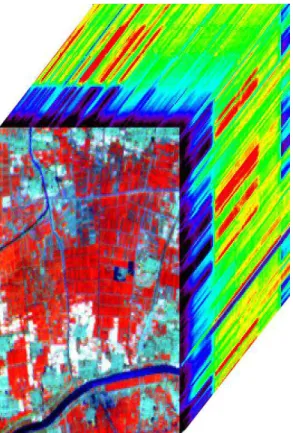
Figure 2-1: Hyperspectral image cube of EO-1 Hyperion extracted over the study site in Huimin County.
Hyperspectral imaging provides the opportunity to image the surface in a high number
of narrow spectral bands to provide a continuous spectral curve. Figure 2-1 shows a 3D
image cube of one test site of the study (Huimin County). The hyperspectral image
cube is a three dimensional representation of the area; it emphasizes the high spectral
resolution. The short wavelengths are displayed close to the border of the image
plane, whereas to the back of the cube the wavelengths are increasing.
15 Figure 2-2 shows two average reflectance curves extracted from the test area. The first curve represents typical soil, the second a typical vegetation reflectance curve.
Figure 2-2: Typical reflectance curves (soil and vegetation) extracted from EO-1 Hyperion of Huimin County (April 19, 2006).
2.1.1.1 Atmospheric Effects
Hyperspectral imaging spectrometers acquire data in contiguous bands over a wide range of the electromagnetic spectrum in a passive way. The sun is the illumination source and the solar irradiance curve shows a decreasing trend with increasing wavelength. The recorded at-sensor-radiance curve in general follows the solar irradiance curve. Additionally, the measured at-sensor-radiance is affected by interactions of the atmosphere with the incident and reflected solar radiation (Gao et al. 2009). The illuminated and reflected energy is scattered and absorbed by atmospheric gases and particles which influences the measured energy that is reflected by the object and received by the instrument (Thenkabail et al. 2011). Major absorption features, approximately centred around 1400 nm and 1900 nm. They are caused by water vapour and carbon dioxide and diminish incoming and reflected solar radiation almost completely. Minor absorption bands that reduce the at-sensor- radiance are centred at 700 nm (O
2), 940 nm and 1140 nm (H
2O) and 2000 nm due to
0 0,05 0,1 0,15 0,2 0,25 0,3 0,35 0,4 0,45
488 610 732 854 973 1094 1215 1336 1457 1578 1699 1820 1942 2093 2214 2335
Reflectance
Wavelength (nm)
Soil Vegetation
16 the occurrence of carbon dioxide (CO
2) (Borengasser et al. 2007). Absorption elements causes distortions on the recorded radiance includes also ozone (O
3), carbon monoxide (CO), and methane (CH
4). All these absorption features affect the transmittance through the atmosphere in a range between 400 nm and 2500 nm. In contrast to absorption features reducing the amount of recorded energy, scattered light (path radiance) is added to the radiance measurement. Scattering processes that occur within the atmosphere are Rayleigh scattering in the case of smaller particles compared to the wavelength, Mie scattering of particles in size of the wavelength and not specified scattering on droplets (Gao et al. 2009). The total radiance measured at the sensor (L
tot) consists of direct reflection from the object and diffuse atmospheric scattering and can be expressed as follows (Lillesand et al. 2008):
= + (2.1)
where p is the reflectance of an object, E the irradiance of an object, T the transmission of the atmosphere, λ the wavelength and L
pthe path radiance.
2.1.1.2 Radiance and Reflectance
For hyperspectral imaging, radiance is an important parameter since it is measured by
the optical instrument. Radiance is the total reflection or emission from a diffuse area
and its unit is Watts per steradian per square meter (W*sr
-1*m
-2) when measured per
unit wavelength (Borengasser et al. 2007). In the case of an optical instrument carried
by a satellite, the electromagnetic energy has to pass the atmosphere. Within the
atmosphere, the emitted or reflected light from the observed target is scattered or
absorbed which will influence the measured radiance (Gao et al. 2009). The radiance
values are therefore dependent on illumination intensity and direction. Compared to
this, reflectance spectra are defined as the ratio of amount of light reflected from a
target to the amount of incident light. This explains why the reflectance is independent
from illumination. Spectral reflectance is unitless and ranges between 0 and 1.0
(Lillesand et al. 2008).
17 2.1.2 Hyperspectral Crop Monitoring*
Timely monitoring of crop growth status is important for dynamic in-season site specific crop management, detection of plant vitality, assessment of seasonal production as well as environmental pollution control and yield prediction (Miao et al.
2009, Laudien & Bareth 2006, Zhao et al. 2004, Hansen & Schjoerring 2003).
Traditional techniques for the measurement of accurate crop parameters such as plant aboveground biomass and nitrogen concentration are destructive, extremely cost and labour intensive, and not able to provide spatial distributed data on regional level (Lu 2006). The estimation of these parameters can be done more efficiently by non- destructive spectral reflectance observations (Daughtry et al. 2000), obtained from field-, airborne- or satellite based sensors. For the linkage of crop parameters with spectral reflectance measurements, a lot of different vegetation indices were developed (Zhao et al. 2004, Haboundane et al. 2004, Broge & Mortensen 2002) that are based on the understanding of reflectance behaviour. Vegetation indices obtained from spectral reflectance measurements are designed to enhance the vegetation cover signal while minimizing the response of various background materials (Schowengerdt 2007). They are mainly based on the difference between low reflection due to strong absorptions by foliar pigments in the red spectrum and high reflection of structural components (cell walls) in the near infrared spectrum (Kumar et al. 2003, Lillesand et al. 2008). In the past decades, many attempts have been made to estimate crop parameters at regional level, either directly from remote sensing data or by assimilating remote sensing data into crop models (Schneider 2003). A lot of earth observation satellites carrying multispectral imaging sensors (Wooster 2007), which provide data that can be used for the calculation of broad band vegetation indices (Liu 2006). Vegetation indices calculated from the visible and near infrared bands of multispectral scanners have been used to estimate crop parameters such as standing biomass and grain yield (Tucker 1979, Thenkabail et al. 2000, and Doralswamy et al.
2003), leaf area index (LAI) (Cloutis et al. 1999) and plant nitrogen content (Reyniers &
Vrindts 2004). At higher vegetation densities, standard broadband vegetation indices,
*