Evaluating and Developing Methods for Non-Destructive Monitoring of Biomass and Nitrogen in Wheat and Rice
Using Hyperspectral Remote Sensing
Inaugural-Dissertation
zur
Erlangung des Doktorgrades
der Mathematisch-Naturwissenschaftlichen Fakultät
der Universität zu Köln
vorgelegt von Martin Leon Gnyp
aus Oppeln 2014
Berichterstatter: Prof. Dr. Georg Bareth Prof. Dr. Karl Schneider Tag der mündlichen Prüfung: 14.04.2014
Abstract
iii Abstract
Aboveground plant biomass and plant nitrogen are two important parameters for plant growth monitoring, which have a decisive influence on the final yield. Mismanagement of fertilizer or pesticide inputs leads to poor plant growth, environmental pollution, and accordingly, yield loss.
Biomass development is driven by nutrient supply, temperature, and phenology. Crop biomass reaches its highest weight at the harvest time. In contrast, plant nitrogen is dependent from fertilizer inputs to the soil and from biomass. Destructive measurement of both parameters is time-consuming and labor- intensive. Remote sensing offers remotely non-direct observation methods from outer space, air space, or close-range in the field by sensors. This dissertation focuses on non-destructive monitoring of plant biomass (the primary parameter) and plant nitrogen (the secondary parameter) using hyperspectral data from non-imaging field spectrometers and the imaging EO-1 Hyperion satellite.
The study was conducted on two field crops: winter wheat of two growing seasons of the Huimin test site in the North China Plain; and rice of three growing seasons of the Jiansanjiang test site in the Sanjiang Plain of China. Study fields were set up in different spatial scales, from small experimental scale to large farmers' scale. Extensive field measurements were carried out, including both destructive measuring and non-destructive hyperspectral remote sensing of biomass and plant nitrogen. Besides, two years' Hyperion images were acquired at the Huimin test site. Four different approaches were used to develop the estimation models, which include: vegetation indices (VIs), band combinations, Optimum Multiple Narrow Band Reflectance (OMNBR) and stepwise Multiple Linear Regression (MLR), and derivatives of reflectance. Based on these four approaches, models were constructed, compared, and improved step by step. Additionally, a multiscale approach and a new VI, named GnyLi, were developed. Since experimental and farmers' fields were differently managed, several calibration and validation methods were tested and the field datasets were pooled.
All tested approaches and band selections were greatly influenced by single growth stages.
The broad band VIs saturated for both crops at the booting stage at the latest and were greatly outperformed by the narrow band VIs with optimized band combinations. Model applications from experimental to farmers' scale using the narrow bands measured by field spectrometers mostly failed due to the effects of different management practices and crop cultivars at both spatial scales. In contrast, the multiscale approach was successfully applied in winter wheat monitoring to transfer data and knowledge from field spectrometer measurements from the experimental scale to the farmers' field scale and the scale that is covered by the Hyperion imagery. The GnyLi and the Normalized Ratio Index (NRI) based on the optimized band combinations performed the best in the up-scaling process in the winter wheat study. In the rice study, MLR or OMNBR models based on 4–6 narrow bands better explained biomass variability compared to VIs based on broad bands and optimized band combinations. The models were more robust when data from different scales were pooled and then randomly divided into calibration and validation datasets. Additional model improvements were obtained using derivatives of reflectance.
iv This dissertation evaluates different hyperspectral remote sensing approaches for non- destructive biomass and plant nitrogen monitoring, with the main focus on biomass estimation. The results and comparisons of different approaches revealed their potentials and limits. Development of new VIs, such as GnyLi, is advantageous due to the saturation problem of broad band VIs. However, the developed VIs need to be tested and improved for different crops and sites. Detection of optimized band combinations facilitates the development of new VIs, which are site-specific and crop-specific.
MLR-based models may better explain the biomass variability; nevertheless, with more bands, they are prone to the issues of over-fitting and collinearity. Hence, no more than six bands were recommended to select from the hyperspectral data. Derivatives of reflectance were beneficial at the early growing season of rice when the canopy was strongly influenced by background signals from soil and water. However, their benefits were reduced when more bands were used.
Zusammenfassung
v Zusammenfassung
Oberirdische Pflanzenbiomasse und Pflanzenstickstoff sind zwei wichtige Parameter für das Monitoring von Pflanzenwachstum, die einen entscheidenden Einfluss auf den Ertrag haben.
Mißmanagement von Stickstoffdüngung und Pestizideinsatz führen zu schlechtem Pflanzenwachstum, Umweltverschmutzung, und entsprechendem Ertragsverlust. Die Entwicklung von Biomasse wird von Nährstoffversorgung, Temperatur, und Phänologie gesteuert. Die Biomasse von Feldfrüchten erreicht ihr höchstes Gewicht zur Erntezeit. Demgegenüber ist Pflanzenstickstoff von der Düngerzufuhr in den Boden und von der Biomasse abhängig. Die destruktive Messung von beiden Parametern ist zeitaufwendig und arbeitsintensiv. Die Fernerkundung bietet indirekte Beobachtungsmethoden durch Sensoren aus dem Weltraum, Luftraum, und dem Nahbereich im Feld. Diese Dissertation legt den Schwerpunkt auf nicht-destruktives Monitoring primär von Pflanzenbiomasse und sekundär von Pflanzenstickstoff unter Verwendung hyperspektraler Daten von nichtbildgebenden Feldspektrometern und dem bildgebenden EO-1 Hyperion Satelliten.
Die Studie wurde an zwei Feldfrüchten durchgeführt: während der Wachstumsperioden von Winterweizen in zwei Jahren auf dem Versuchsgelände in Huimin in der nordchinesischen Tiefebene und während der Wachstumsperioden von Reis in drei Jahren auf dem Versuchsgelände in Jiansanjiang in der Sanjiang Ebene von China. Die Versuchsfelder wurden in unterschiedlichen Skalen angelegt, von der kleinen Versuchsfeldskala bis zu großen Farmskala. Umfangreiche Feldmessungen wurden durchgeführt, welche destruktives als auch nicht-destruktives, hyperspektrales Erfassen von Biomasse und Pflanzenstickstoff einbezogen haben. Zusätzlich wurden Hyperionaufnahmen von zwei Jahren für das Versuchsgelände in Huimin berücksichtigt. Vier unterschiedliche Methoden wurden für die Schätzmodelle genutzt: Vegetationsindizes (VIs), Bandkombinationen, Optimierte Multiple Narrow Band Reflexion (OMNBR), schrittweise Multiple Lineare Regression (MLR) und Reflexionsableitungen. Basierend auf diesen vier Methoden wurden Modelle entwickelt, verglichen und schrittweise verbessert. Zusätzlich wurden eine Multiskala-Methode und ein neuer VI namens GnyLi entwickelt. Da die Versuchs- und Farmfelder unterschiedlich bewirtschaftet wurden, wurden einige Kalibrierungs- und Validierungsmethoden getestet und die Felddatensätze zusammengefaßt.
Alle getesteten Methoden und Bandselektionen wurden im hohen Maß durch einzelne Entwicklungsstadien beeinflußt. Für beide Feldfrüchte waren die Breitband VIs spätestens zum Stadium des Ährenschwellens gesättigt und wurden durch Schmalband VIs mit optimierten Bandkombinationen deutlich übertroffen. Modellübertragungen von der Versuchs- zur Farmskala unter Verwendung von Schmalband VIs gemessen durch Feldspektrometer waren meistens nicht erfolgreich, bedingt durch unterschiedlichen Bewirtschaftungsverfahren und Feldfruchtsorten in beiden räumlichen Skalen. Im Gegensatz dazu, wurde die Multiskala-Methode erfolgreich auf das Monitoring von Winterweizen angewendet, welche die Transferierbarkeit von Daten und Erkenntnissen der Feldspektrometermessungen von der Versuchsskala auf die Farmskala und die Skala der Hyperionaufnahme, ermöglicht. Der GnyLi und der auf optimierten Bandkombinationen
vi basierende Normalisierte Ratio Index (NRI) erzielten die besten Ergebnisse beim Hochskalierungsprozess in der Winterweizenstudie. In der Reisstudie erklärten MLR oder OMNBR Modelle, die auf 4–6 schmalen Bändern basieren, die Biomassenvariabilität besser als VIs, die auf breiten Bändern und optimierten Bandkombinationen basieren. Die Modelle waren robuster, wenn Daten von unterschiedlichen Skalen zusammengefasst und dann zufällig in Kalibrierungs- und Validierungsdatensätze geteilt wurden. Zusätzliche Modellverbesserungen wurden durch Reflexionsableitungen erreicht.
Diese Dissertation bewertet unterschiedliche hyperspektrale Erfassungsmethoden für nicht- destruktives Monitoring von Biomasse und Pflanzenstickstoff mit dem Hauptfokus auf die Abschätzung von Biomasse. Die Ergebnisse und Vergleiche der unterschiedlichen Verfahren zeigen ihre Potentiale und Grenzen auf. Die Entwicklung von neuen VIs, wie z. B. des GnyLi, ist von Vorteil, bedingt durch das Sättigungsproblem von Breitband VIs. Allerdings müssen die entwickelten VIs für verschiedene Feldfrüchte und Standorte getestet und verbessert werden. Die Detektion von optimierten Bandkombinationen ermöglicht die Entwicklung von neuen Bandkombinationen, die standort- und feldfruchtspezifisch sind. MLR-basierte Modelle können besser die Variabilität von Biomasse erklären. Dennoch tendieren sie mit mehr Bändern zu Problemen, wie zum Beispiel Überanpassung und Kollinearität. Deshalb werden nicht mehr als sechs Bänder zur Auswahl von hyperspektralen Daten empfohlen. Die Reflexionsableitungen waren vorteilhaft im frühen Entwicklungsstadium von Reis, wenn der Bestand stark durch Hintergrundsignale vom Boden und Wasser beeinflußt war.
Jedoch wurde deren Nutzen gemindert, wenn mehr Bänder verwendet wurden.
Acknowledgements
vii Acknowledgements
The present thesis was prepared during the phase of two projects "Regional N-management in Huimin County, Shandong Province, China" and "Microwave imaging to derive upland rice characteristics in Jiansanjiang, Heilongjiang Province, China", funded by the International Bureau (IB) and the Federal Ministry of Education and Research (BMBF). I gratefully acknowledge the financial support from the projects. Both projects were conducted in cooperation with our colleagues from the China Agricultural University (CAU) in Beijing.
I wish to express my gratitude to my supervisor, Prof. Dr. Georg Bareth, for introducing me to this research field, for the opportunity to work in his research group, and for his guidance and invaluable suggestions for improving this work.
I sincerely thank Prof. Dr. Karl Schneider for consenting to act as the second examiner and also Prof. Dr. Bülent Tezkan for chairing the examination committee.
I am indebted to my Chinese supervisors, Prof. Dr. Xinping Chen, Ass. Prof. Fei Li, and especially Ass. Prof. Dr. Yuxin Miao from CAU, for their guidance and support during the field campaigns in Huimin and Jiansanjiang. I greatly appreciated their knowledge and their fruitful thoughts. In particular, I am grateful for Ass. Prof. Yuxin Miao for his valuable comments and his efforts of acting as the corresponding author for my fifth manuscript (chapter 7).
Thanks also go to many student helpers from our group and also from CAU for their cooperation and assistance during the field campaigns. Many thanks also to the farmers for their hospitality and consent to carry out our measurements in their fields.
Many thanks to Prof. Fei Yuan from the Minnesota State University for her comfort and encouragement during my thesis writing and especially her readiness to help me whenever needed.
I thank to my colleagues in our group for their friendly conversations and collaborations, particularly to Wolfgang, Kang, Dirk, Helge, Juliane, and Simon.
My wholehearted thanks to my parents Theresa and Leon for their constant loving care of me and for their assurance of their support at all times, and also to my brother Michael.
viii Table of contents
1. Introduction ... 1
1.1 Preface and introduction of the topic... 1
1.2 Problem statement ... 5
1.3 Outline and aims ... 7
2. Basics ... 10
2.1 Agronomy of winter wheat and rice and their geographical extent ... 10
2.1.1 Winter wheat ... 10
2.1.1.1 Global producing areas of winter wheat ... 10
2.1.1.2 Phenology of winter wheat ... 11
2.1.1.3 Growth requirements and cultivation practice for winter wheat ... 12
2.1.2 Rice ... 13
2.1.2.1 Global producing areas of rice ... 13
2.1.2.2 Phenology of rice ... 14
2.1.2.2 Growth requirements and cultivation practice for rice ... 15
2.1.3 Biomass and plant nitrogen ... 16
2.1.3.1 Biomass ... 16
2.1.3.2 Plant nitrogen ... 17
2.2 Remote sensing and proximal remote sensing of vegetation ... 17
2.2.1 Principles of remote sensing ... 17
2.2.2 Multispectral remote sensing ... 18
2.2.3 Hyperspectral remote sensing ... 18
2.2.4 Proximal sensing ... 19
2.2.5 Basic physics of spectrometry and reflectance ... 20
2.2.6 Spectral reflectance of plants and the influence of phenology ... 21
2.2.7 Remote sensing methods for the non-destructive monitoring of biomass and nitrogen ... 22
2.2.7.1 Published vegetation indices (VIs) ... 22
2.2.7.2 Optimized best two band combinations ... 23
2.2.7.3 Optimum multiple narrow band reflectance (OMNBR) and stepwise multiple linear regression (SMLR) ... 23
2.2.7.4 Derivatives of reflectance ... 24
2.3 Study areas and ground truth in the test sites ... 24
2.3.1 North China Plain (NCP) ... 25
2.3.1.1 Climatic conditions in the NCP ... 26
2.3.1.2 Soils of the NCP ... 27
Table of contents
ix
2.3.1.3 Agricultural ecosystems of the NCP ... 27
2.3.1.4 Huimin test site and experimental design ... 28
2.3.1.5 Field measurements at the Huimin test site ... 28
2.3.2 Sanjiang Plain (SJP) ... 30
2.3.2.1 Climatic conditions in the SJP ... 31
2.3.2.2 Soils of the SJP ... 32
2.3.2.3 Agricultural ecosystems of the SJP ... 32
2.3.2.4 Jiansanjiang test site and experimental design ... 33
2.3.2.5 Field measurements at the Jiansanjiang test site ... 34
3. Estimating N status of winter wheat using a handheld spectrometer in the North China Plain ... 36
3.1 Introduction ... 37
3.2 Materials and methods... 38
3.2.1 Site descriptions ... 38
3.2.2 Description of the experiments ... 39
3.2.2.1 Experiment 1: Nitrogen rate experiment ... 39
3.2.2.2 Experiment 2: Variety-N experiment ... 39
3.2.2.3 Experiment 3: Farmer's fields ... 40
3.2.3 Fields measurements and data collection ... 40
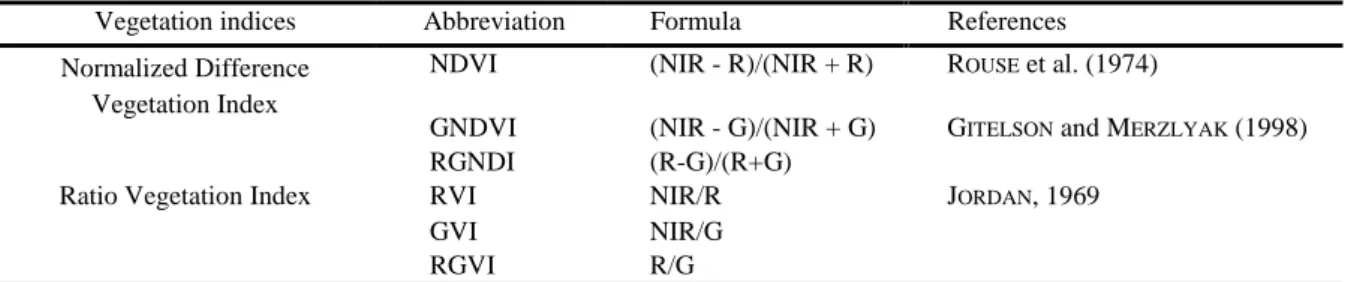
3.2.3.1 Spectral reflectance measurement ... 40
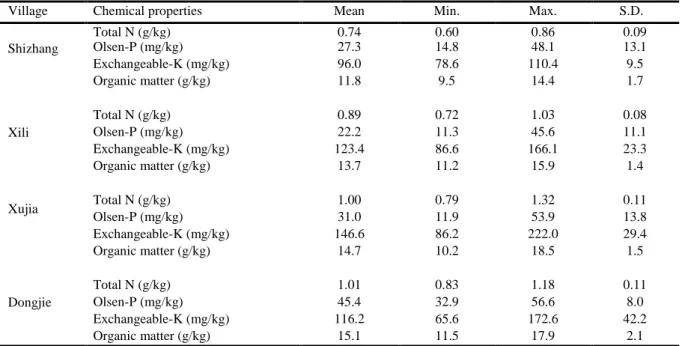
3.2.3.2 Plant and soil measurement ... 41
3.2.4 Statistical analysis ... 42
3.3 Results ... 42
3.3.1 Variation of agronomic variables ... 42
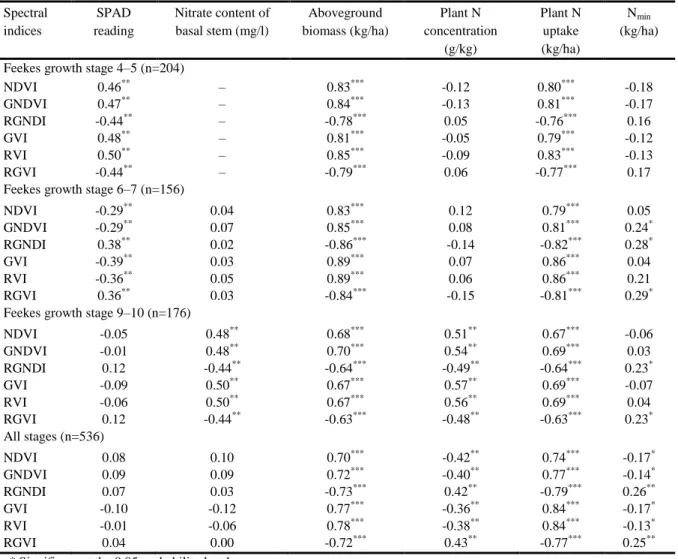
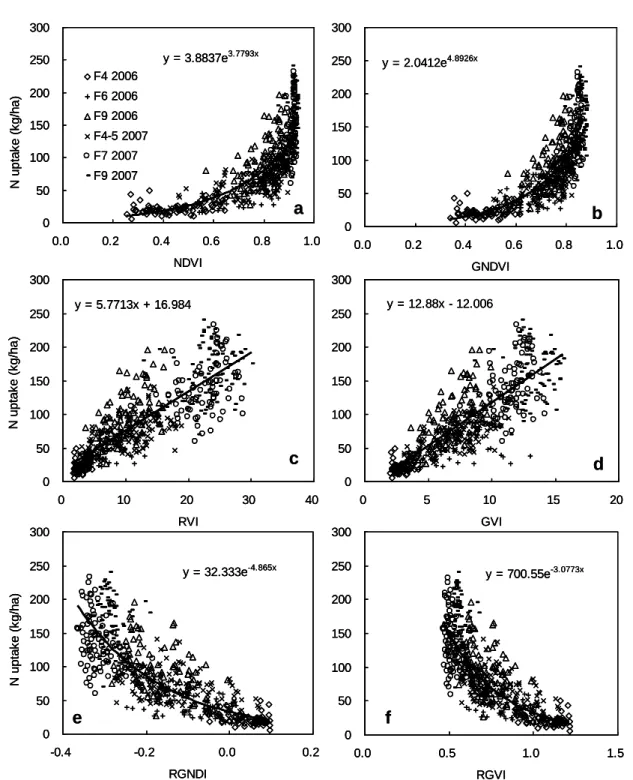
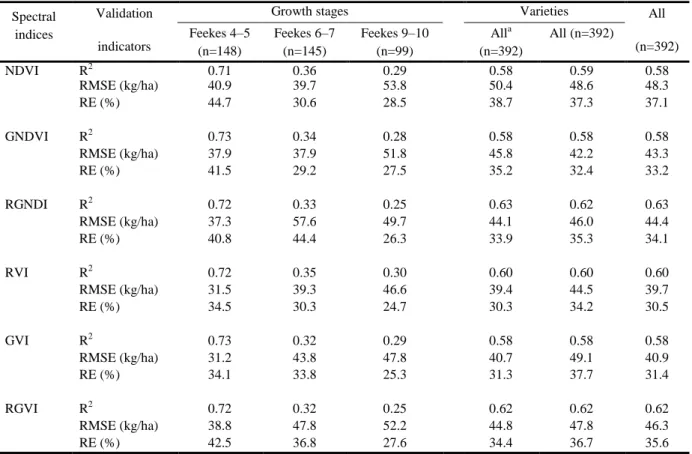
3.3.2 Relationships between spectral indices and agronomic variables ... 43
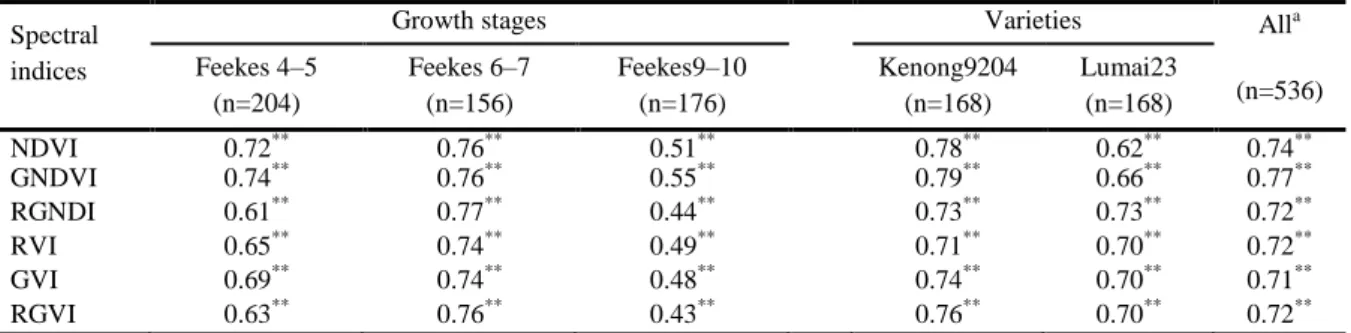
3.3.3 Establishment of the regression model between spectral VI and plant N uptake ... 44
3.3.4 Validation of the established model with data from the farmers' fields (Experiment 3) ... 45
3.4 Discussion ... 46
4. Evaluating multispectral and hyperspectral satellite remote sensing data for estimating winter wheat growth parameters ... 52
4.1 Introduction ... 53
4.2 Material and methods ... 55
4.2.1 Study area ... 55
4.2.2 Hyperion and ALI image data ... 55
4.2.3 Groundtruth measurements ... 55
x
4.2.4 Satellite image pre-processing ... 56
4.2.5 Vegetation index calculation and model development for crop parameter estimation ... 57
4.3 Results ... 58
4.3.1 Variation of crop parameters ... 58
4.3.2 Relationship of standard vegetation indices with crop parameters ... 59
4.3.3 Relationship of narrow band Normalized Ratio Index (NRI) with crop parameters ... 59
4.4 Discussion ... 60
4.4.1 Pre-processing of EO-1 data ... 60
4.4.2 Standard vegetation indices ... 60
4.4.3 Narrow band normalized difference indices ... 61
4.5 Conclusions ... 62
5. Development and implementation of a multiscale biomass model ... 67
5.1 Introduction ... 68
5.2 Study site and data ... 70
5.2.1 Study site description ... 70
5.2.2 Multiscale set-up of the study fields ... 70
5.2.2.1 Level 1 (L1): Small experimental fields ... 70
5.2.2.2 Level 2 (L2): Large experimental fields ... 70
5.2.2.3 Level 3 (L3): Small farm fields ... 70
5.2.2.4 Level 4 (L4): Large farm fields ... 71
5.2.3 Field measurements ... 71
5.2.3.1 Spectral reflectance measurements ... 71
5.2.3.2 Biomass measurements ... 72
5.2.4 EO-1 Hyperion images and pre-processing ... 72
5.3 Methods ... 73
5.3.1 Vegetation indices (VIs) ... 73
5.3.2 New developed VI GnyLi ... 74
5.3.3 Multiscale biomass model development ... 75
5.3.4 Statistical analyses ... 76
5.4 Results ... 76
5.4.1 Selected VIs for biomass model development ... 76
5.4.2 Step (I): Model L1 versus biomass on L2 ... 77
5.4.3 Step (II): Model improvement (L1+L2) versus biomass on L1+L2 ... 78
5.4.4 Step (III): Model L1+L2 versus biomass on L3 ... 78
5.4.5 Step (IV): Model improvement (L1+L2+L3) versus biomass on L1+L2+L3 ... 78
5.4.6 Step (V): Model L1+L2+L3 versus biomass on L4 ... 78
Table of contents
xi
5.4.7 Step (VI): Model improvement (L1+L2+L3+L4) versus biomass on L1+L2+L3+L4 ... 79
5.4.8 Step (VII): Model application on regional level ... 80
5.5 Discussion ... 82
5.6 Conclusions and outlook ... 84
6. Analysis of crop reflectance for estimating biomass in rice canopies at different phenological stages ... 90
6.1 Introduction ... 91
6.2 Material and methods ... 92
6.2.1 Study area and experimental design ... 92
6.2.3 Aboveground biomass (AGB) collection ... 94
6.2.4 Spectral indices (SIs) and stepwise Multiple Linear Regression (MLR) ... 95
6.2.5 Data analysis and statistics ... 96
6.3 Results ... 96
6.3.1 Temporal AGB variation ... 96
6.3.2 Canopy reflectance spectra under different N-rates and at different growth stages ... 97
6.3.3 Relationship between AGB and spectral reflectance ... 98
6.3.4 Model calibration by single Bands, SR and NRI ... 99
6.3.5 MLR model calibration ... 100
6.3.6 Calibration against validation ... 101
6.4 Discussion and conclusion ... 102
7. Hyperspectral canopy sensing of paddy rice aboveground biomass at different growth stages ... 108
7.1 Introduction ... 109
7.2 Materials and methods... 111
7.2.1 Study site ... 111
7.2.2 Nitrogen rate experiments ... 112
7.2.2.1 Experiments 1 and 2 ... 112
7.2.2.2 Experiments 3–6 ... 113
7.2.2.3 Farmers' fields ... 113
7.2.3 Reflectance measurements ... 113
7.2.4 Plant sampling and measurements... 114
7.2.5 Data preprocessing of hyperspectral data ... 115
7.2.6 Vegetation indices ... 115
7.2.7 Optimum multiple narrow band reflectance (OMNBR) models ... 116
7.2.8 Statistics of model calibration and validation ... 116
xii
7.3 Results ... 117
7.3.1 Aboveground biomass variability... 117
7.3.2 Reflectance, first and second derivative spectra of rice canopy ... 117
7.3.3 Estimating AGB with vegetation indices ... 119
7.3.3.1 Fixed band vegetation indices ... 119
7.3.3.2 Soil adjusted vegetation indices ... 119
7.3.3.3 Optimized band combination vegetation indices... 121
7.3.4 The OMNBR models... 121
7.4 Discussion ... 127
7.4.1 Estimating rice AGB using vegetation indices ... 127
7.4.2 Estimating rice AGB with OMNBR models ... 129
7.4.3 Derivative analysis ... 130
7.4.4 Importance of including data from farmers' fields for model calibration ... 131
7.5 Conclusions ... 131
8. Discussion ... 137
8.1 Limits of published vegetation indices ... 137
8.2 Potential of two- to four-band combinations ... 138
8.3 Performance of OMNBR and MLR ... 140
8.4 Potential of derivatives of reflectance ... 141
8.5 Uncertainties by model up-scaling ... 142
8.6 Importance of single growth stages and growing season ... 144
8.7 Effect of sample size and diverse calibration/validation methods ... 146
8.8 Potential errors and disadvantages in statistics and in hyperspectral data collection ... 148
8.9 Unexplained biomass and plant nitrogen in hyperspectral reflectance ... 150
9. Conclusions and future challenges ... 152
9.1 Conclusions ... 152
9.2 Future challenges and outlook ... 153
References* (chapters 1, 2, 8, 9) ... 155
Appendix A: Erklärung ... 168
Appendix B: Curriculum vitae ... 169
Appendix C: Publicationlist ... 169
Appendix D: List of figures and tables ... 169
1. Introduction
1 1. Introduction
1.1 Preface and introduction of the topic
For thousands of years, food security has played and still plays a critical role for humans in every country and society. Food security denotes having physical and economic access to sufficient, safe, and nutritious foods (FAO, 2013). Food security is associated with healthy life, prosperous society, and finally, with a flourishing economy. Food access guarantees for peace and social stability, which is a major concern at a national scale (CHEN et al., 2011). Conversely, food insecurity may result in famines caused by wars or natural disasters, which have haunted states and societies in their histories, exterminating or forcing people to emigrate. At present, food insecurity remains an issue in less developed countries (BUDDE et al., 2010). FAO (2013) estimated that 1 billion of the worldwide population was affected by food insecurity in 1990–92 and 0.842 billion was affected in 2011–2013.
Most affected countries are primarily in the Southern hemisphere, including South Asia, Sub-Saharan Africa, and East Asia (FAO, 2013). In contrast to developing countries, highly developed countries are able to maintain food security because of agricultural mechanization, although less people are employed in the agricultural sector. In the case of China, food security has emerged as a key national task since the great famine in the 1950s (NYBERG, 1998). Food self-sufficiency is a central goal of China's agricultural policy (HUANG, 1998; MIAO et al., 2011). However, maintaining global food security is challenging due to the increasing world population.
The world population is expected to increase rapidly over the next decades. The UN (2012) estimated the world population will reach to 9.5 billion people by 2050, an additional population gain of 2.3 billion. Approximately 60% of the 7.2 billion total population live in Asia. The most populated countries include China, with 1.361 billion people, and India, with 1.236 billion people. China and India together have one third of the world's population. China has 19% of the world's population;
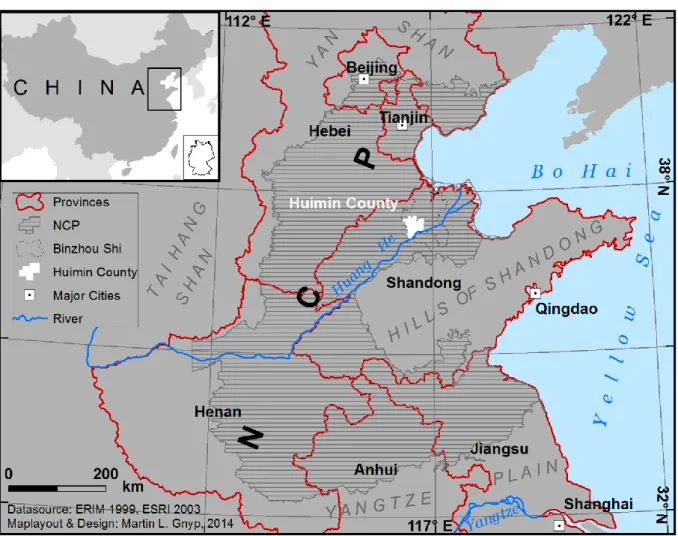
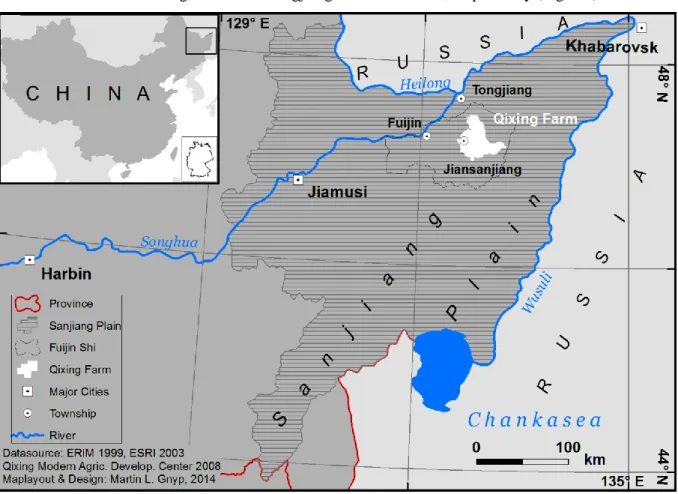
however, China has only 8% of the arable land (HOERING, 2010; FAOSTAT, 2011). China's agricultural land is exceptionally small relative to its population (LELE et al., 1998) and is mainly in the eastern, northeast, and south regions (Fig. 1.1). These regions have the highest cropland density and simultaneously the highest population density (CAI et al., 2013; YOU et al., 2013). In particular, the study areas of this dissertation, the North China Plain and Sanjiang Plain, are two of the main agricultural zones in China (Fig. 1.1).
In these agricultural zones, rural-urban migration and planned urbanization have led to higher food demand from the growing cities (CAI et al., 2013), which, therefore, have put pressure on local agriculture close to metropolitan areas to increase productivity. The rural areas may only satisfy the increased demand for food security by increasing the yield. In addition, Chinese cities and major agricultural firms have begun to acquire agricultural products and arable land from overseas with some financial and political encouragement from the government called "going out" (HOERING, 2010; LANG
and MIAO, 2013). These cities and firms have leased arable land not only in neighboring states but also in Africa for extending rice production and in Australia for sheep farming. The largest deal was
2 made with Russia, where the largest cereal producer of China has established a long-term lease agreement for 430,000 ha of arable land near the northeast border of Heilongjiang Province (HOERING, 2010). Using that strategy, China is attempting to satisfy its resource demands and to avoid increasing import rates.
Fig. 1.1 Cropland density in China with the two main agricultural zones "North China Plain" in the east and "Sanjiang Plain" in the northeast (modified from YOU et al., 2013; ISG, 1991; ERIM, 1999).
A massive increase in agricultural productivity associated with the Green Revolution has facilitated feeding a fast growing world population. In China, agricultural productivity rose 8% yearly in the 1980s, 1990s, and 2000s (SUN and KUNG, 1998; ZHANG et al., 2012a) and the population increased 1.5% yearly in the 1980s and 1990s but 0.6% in the 2000s (UN, 2012). The revolution, which was associated with mechanization in agriculture and intensive fertilizer application, pushed people to move to the cities. This process has been completed in the highly developed countries but not in developing countries that have high fertility rates (UN, 2012), high migration pressure from rural area to the cities, and often unfavorable climate conditions. With limited agricultural land, developing countries have to follow the Green Revolution as well to feed their growing population by providing sufficient food on the market.
Agronomic products are traded on bourses and are dependent on supply and demand in the market. Since the 2007–2008 food crises, food prices have doubled, and recently, these prices have remained at a high level (FAOSTAT, 2012). These high prices have resulted in protests in developing
1. Introduction
3 countries and in the tendency for food scandals (HOERING, 2010). Fig. 1.2 shows the importance of China in the market. Maize, rice, and wheat compose two-thirds of the human food consumption of plant-based foods. China is the largest agricultural market, producing 22% (510 Mio. t) of maize, rice, and wheat on 8% of the global arable land (FAOSTAT, 2011); however, China's large population (19%
of world population) consumes most of this production. In contrast to that, China produced 30% of the global fertilizer but consumed 32% of that fertilizer for only 8% of the global arable land in 2011 (Fig. 1.2).
Fig. 1.2 China's absolute and relative share of world's inputs and outputs in 2011 - The population, arable land, main crops, and fertilizer data were from FAOSTAT (2011).
In addition to food security and to the pressure of a growing population, crops have become a lucrative target for energy production in the world market, particularly in developed economies (CHEN
et al., 2011). Since 2007, China has financially supported its national climate change program to reduce greenhouse gases (HOERING, 2010). Recently, using renewable energy resources has become an important issue in many countries. Agricultural biofuel and biomass energy have become key words. Many countries are searching for independence of their feedstocks from petroleum by investigating renewable resources, given the increased prices of petroleum feedstocks. Expanding energy crops means less arable land for food production, which will result in a lower food supply and higher food prices in the world market. This issue has been hotly debated in the media.
Crops are renewable resources that produce much biomass. Cereal, such as wheat and rice, accumulate approximately 50–70% of their biomass in grains and 30–50% in straws at harvest. Straw serves as animal food or as renewable energy from the remaining biomass. Straw may be pressed into biomass pellets, which has an approximate energy value of 4.44 kWh/kg compared with 11.86 kWh/kg of fuel oil (TFZ, 2013). Recently, pellet heating has become approximately 50% cheaper per energy equivalent than oil heating. Using biomass pellets is a more efficient way for protecting resources, as long these pellets do not compete against food security.
50.8 51.2 117
201 192 108
1,350
110.2 118.8 584
521 693 1,272
5,650
0% 20% 40% 60% 80% 100%
Fertilizer consumption Fertilizer production Wheat production Rice production Maize production Arable land Population
China Others
7,000 Mio. people 1,380 Mio. ha
722 Mio. t 885 Mio. t
701 Mio. t 170 Mio. t 161 Mio. t World
4 Increasing agricultural production and productivity may be attained by new cultivars or better management. Therefore, this dissertation investigates the principles for a better management. To improve the management of farm inputs, precise agriculture was introduced in the middle of the 1980's (MULLA, 2013). Precision agriculture involves better management of farm inputs, such as fertilizers, herbicides, seeds, by performing the right management at the right time and place (BONGIOVANNI and LOWENBERG-DEBOER, 2004; NELLIS et al., 2009; MULLA, 2013). Its technologies combine sensors, information systems, enhanced machinery, and informed management to detect spatial and temporal within-field variability (ZHANG et al., 2002; GEBBERS and ADAMCHUK, 2010; YAO et al., 2011).
Hence, precision agriculture makes use of Global Positioning System (GPS) and a Geographic Information System (GIS) obtaining a precise position of mismanaged locations or zones within the field. Thus, precision agriculture optimizes production outputs by minimizing inputs, e.g., fertilizer (SEELAN et al., 2003; SCHELLBERG et al., 2008) and improves the sustainability of food supply by decision-making (YAO et al., 2011). In contrast, destructive measurements of crop growth/parameters for decision making in agriculture at field, regional, national, or global scales are extremely cost and labor intensive. Timely, precise and comprehensive information on crop production and methods for different spatial scales are required (DUVEILLER et al., 2012).
An important method to monitor crop growth and crop vitality for forecasting, modeling, and simulating yield, biomass, stress and/or nutrient status of crops at diffeent spatial scales is remote sensing (PINTER et al., 2003; NELLIS et al., 2009; YAO et al., 2011). Remote sensing plays a strong role in the agriculture and its remotely provided information are urgently required for decision making (ATZBERGER, 2013). Remote sensing is a non-destructive, cost-effective, and non-contact technique for the indirect monitoring of plant growth quantities (ATZBERGER, 2013; WILSON et al., 2014).
Remote sensing remotely collects the information about a phenomenon or object (LILLESAND et al., 2008) by active or passive aquisition systems. Particularly, remote sensing applications in agriculture are based on the interactions of the electromagnetic radiation with the crop canopy, which contains information about the plant and plant-surranding materials, such as soils or even water. Remote sensing sensors are carried by satellites, aircrafts, unmanned aerial vehicles, tractors, or people in the field offering different spatial resolution, imaging and non-imaging spectral data (MULLA, 2013).
Depanding on the collected number of spectral bands and spectral resolution, remote sensing is classified in multispectral (few broad bands) and hyperspectral (many narrow bands) acquisition systems.
Hyperspectral remote sensing provides a particularly powerful tool for diagnosis and plant monitoring (HANSEN and SCHJOERRING, 2003; JONES and VAUGHAN, 2010). Hyperspectral sensors/spectrometers, such as satellite imaging sensors (e.g., EnMap, Hyperion, or PRISMA), airborne imaging sensors (e.g., AISA EAGLE, CASI, or HyMap), and non-imaging hand-held sensors (e.g., FieldSpec 3 from ASD, HandySpec from tec5), remotely sense many continuous narrow bands and provide a high spectral resolution (THENKABAIL et al., 2011). The last mentioned sensors, such as
1. Introduction
5 hand-held sensors, represent proximal remote sensing or close-range field spectrometers and, currently, offer the highest number of narrow spectral bands (> 2000 bands) in hyperspectral remote sensing. Proximal sensors are the most common remote sensing devices for a precise site-specific management in precision agriculture (JONES and VAUGHAN, 2010). This combined technology offers the real-time monitoring of plant nutrients and plant vitality. Therefore, hyperspectral remote sensing opens a wide field for detailed quantitative analyses of plant characteristics compared with multispectral sensors (KUMAR et al., 2006; MIGDALL et al., 2009; THENKABAIL et al., 2011). These detailed quantitative analyses involve the evaluation of spectral reflectance signatures caused, e.g. by phenology-driven changes in the biophysical and biochemical process in the plants and nutrient inputs, such as of fertilizer.
For the linkage of hyperspectral sensed data/reflectance with plant biophysical and biochemical characteristics, diverse methods and approaches are known, such as vegetation indices, optimized combination of narrow bands, and optimum multiple narrow band reflectance based on stepwise multiple linear regression (THENKABAIL et al., 2000; 2011; XAVIER et al., 2006), or derivatives of reflectance (DEMETRIADES-SHAH et al., 1990). Hyperspectral remote sensing has been widely used in agricultural applications, such as biomass monitoring using non-imaging field spectrometers (CASANOVA et al., 1998; SERRANO et al., 2000; YANG and CHEN, 2004; ROYO and VILLEGAS, 2011; JIN et al., 2013; FU et al., 2014), or imaging spectrometers (HABOUDANE et al., 2004; MUTANGA and SKIDMORE, 2004; PSOMAS et al., 2011; JARMER,2013;MARIOTTO et al., 2013), and plant nitrogen monitoring using non-imaging field spectrometers (OSBORNE et al., 2002; YI et al., 2007; STROPPIANA et al., 2009; RYU et al., 2011;MIPHOKASAP et al., 2012; LI et al., 2014) or imaging spectrometers (TIAN et al., 2011; VIGNEAU et al., 2011; INOUE et al., 2012).
Particularly, in this dissertation, hyperspectral remote sensing data from hand-held field spectrometers and from the EO-1 satellite-carried Hyperion spectrometer are important for non- destructive monitoring of plant vitality or plant nutrient status, e.g. of biomass and plant nitrogen in wheat and rice. In combination with ground-based information about plant characteristics, hyperspectral remote sensing enables to better assess potential impacts to the food supply, and hence, to the food security.
1.2 Problem statement
Food security issues for a growing population, such as China, may be addressed by increasing the input of the international market or by increasing crop yields. The Green Revolution offers not only opportunities but also challenges and problems. China is extremely vulnerable to water shortage, drought, and flooding, which can lead to crop failure. To ensure food security, China is paying a high price for its environment and peoples' health (HOERING, 2010). Many environmental problems occur, such as groundwater contamination and soil degradation due to over-fertilization and nitrate leaching.
6 Mineral fertilizer input, such as nitrogen, may significantly increase the yield; however, nitrogen is a major pollutant. Nitrogen application is relatively ineffective because many crops only absorb 30–75% of nitrogen from the soil (TIVY, 1993), which often leads to suboptimal management practices (CUI et al., 2013) and to low nitrogen use efficiency (RAUN et al., 2002). However, Chinese farmers often apply much fertilizer at a high environmental cost to prevent low yields (CUI et al., 2010). In the past, the Chinese government supported farmers by subsidizing nitrogen fertilizer production. Hence, both fertilizer input and production increased. Generally, higher fertilizer application increases the yield and farmers' income (GAO et al., 2006). In particular, the more developed eastern coastal provinces have demanded a two-fold higher fertilizer application than the economically backward central and western regions (GAO et al., 2006).
The overuse of nitrogen fertilizer means an oversupply of nitrogen to soil, ground water, and to the atmosphere. Plant disease and pest infestation may occur and reduce the potential yield. The mineral is dissolved in water and is finally leached into groundwater. In the 1960s and 1970s, high nitrate concentrations were observed in rivers and ground water in developed countries (TIVY, 1993).
ZHANG et al. (1996) reported that more than half of the 69 locations in the North China Plain exceeded high or critical nitrate rates in drinking water. High fertilizer applications are highly related to high nitrate content in groundwater. Soils may be strongly acidified by nitrification, and their quality for agricultural use may be reduced (BÜNEMANN et al., 2006). Furthermore, the contaminated groundwater affects animal and human health.
Contaminated water can cause childhood and animal diseases. People often consume polluted nutrients without knowing their impacts. Because humans are at the top of food chain, humans pay a heavy price for this pollution. Nitrogen absorption in blood can result in typical symptoms, such as blue baby syndrome, hemoglobin in blood, and decreased functioning of the thyroid gland (SELF and WASKOM, 2013). Babies and children are more sensitive to the health effect of nitrate than adults are.
Protecting children's health has become a high priority for the Chinese government since the last food scandals (HOERING, 2010). Regular nitrate tests are required to test the drinking water. Proper management of nitrogen sources may minimize the contamination of drinking water. Negative impacts of health have often been ignored, whereas nutrition and other benefits of agriculture have not always been optimized (MCDERMOTT and GRACE, 2011).
These negative impacts on health and on the environment threaten human food security and cause socioeconomic problems. A sustainable land use of arable land meets increasing food access, which involves favorable conditions for the environment, economy, and society (LIU et al., 2013).
Precise crop management is essential for sustainable development and for environmental protection.
Effective nitrogen fertilizer management tactics are required to ensure a fertilizer supply with minimum losses to the environment (CHEN et al., 2010). Knowledge regarding crop phenology, weather influence, dynamic soil, and nutrients are important parameters for timely and precise farming.
1. Introduction
7 In order to support decision-making, precision farming requires the precise monitoring of plant growth and fertilizer input (GEBBERS and ADAMCHUK, 2010). Therefore, precision agriculture makes use of diverse remote sensing technologies (satellite, airborne, ground-based). Remote sensing technologies, such as based on imaging data, have their disadvantages due to atmospheric conditions and to inadequate repeat intervals (LILLESAND et al., 2008). Those intervals represent revisit times of two or three weeks, in worst case, between two successive overpasses of a study area and, additionally, have the disadvantage of fixed-time image acquisition (JONES and VAUGHAN, 2010;
MUÑOZ-HUERTA et al., 2013). Moreover, multispectral satellite sensors have less bands, and thus, acquire less information than hyperspectral ones (SCHAEPMAN, 2009; ORTENBERG, 2011). In contrast, hyperspectral proximal sensors, such as spectrometers, measure the observed plant canopy with a high amount of data and high spectral resolution (NELLIS et al., 2009; THENKABAIL et al., 2011), are more flexible and transportable, are more independent of atmospheric corrections (JONES and VAUGHAN, 2010), and have an acquisition window of several hours (MILTON et al., 2009).
1.3 Outline and aims
This dissertation arose within the framework of two Sino-German projects entitled, "Regional N-management in Huimin County, Shandong Province, China (2006–2007)" and "Microwave imaging to derive upland rice characteristics in Jiansanjiang, Heilongjiang Province, China (2007–2009)", which were funded by the International Bureau (IB) and the Federal Ministry of Education and Research (BMBF). Both projects involved the multidisciplinarity of the Institute of Geography at the University of Cologne and of the College of Resources and Environmental Science at the China Agricultural University (CAU) of Beijing in physical geography, geoinformation, remote sensing, agriculture, precision agriculture, and plant nutrition. The study sites - Huimin County and Jiansanjiang - are located in the North China Plain and the Sanjiang Plain, respectively. Huimin was selected because of an existing experimental station and because of cooperation between Prof. Dr.
Bareth, Prof. Dr. Fusuo Zhang, and Prof. Dr. Xinping Chen from CAU since 1999. The collaboration in Jiansanjiang started in 2007, managed by Ass. Prof. Dr. Yuxin Miao, who established another experimental station (Jiansanjiang) for CAU in 2011. The projects aimed to benefit from the multidisciplinary Sino-German cooperations. The main purpose of these projects was to monitor the growth of agricultural parameters, such as biomass and plant nitrogen, using hyperspectral non- imaging and imaging data. In addition, the microwave image data mentioned in the title of the second project were acquired during the field campaigns but were not studied in this dissertation. In fact, microwave data were acquired at both study sites and were used in Wolfgang Koppe's dissertation.
This dissertation aims at answering the following research aims:
How may biomass and plant nitrogen be non-destructively determined by hyperspectral remote sensing?
8
Which non-destructive method is the most promising for the monitoring of biomass or plant nitrogen by hyperspectral remote sensing?
Are the diverse methods transferrable to other fields or sites?
Which role does phenology play in the diverse non-destructive estimation methods derived from hyperspectral remote sensing data?
Does hyperspectral remote sensing explain the higher variability in biomass or plant nitrogen when the diverse methods are improved stepwise?
To address the main research aims, four different approaches were evaluated: vegetation indices (VIs), best band combinations, optimum multiple narrow band reflectance (OMNBR), stepwise multiple linear regression (MLR), and derivatives of reflectance. Extensive destructive measurements of biomass and plant nitrogen and non-destructive hyperspectral measurements were conducted following diverse growth stages at the two selected study sites from 2006–2009. The samples and hyperspectral measurements (Humin test site) were synchronized with the satellite overpass of EO-1 Hyperion. Diverse VIs and best band combinations were investigated for winter wheat at the Huimin test site, and their performance for biomass and plant nitrogen estimations was compared (chapters 3–4). Additionally, multiscale biomass models based on different VIs, which were derived from field hyperspectral measurements, were developed and tested with Hyperion imageries (chapter 5). Because the rice canopy at the Jiansanjiang test site has different influences on its reflectance patterns, additional MLR models were applied to compare the aforementioned methods (chapters 6–7). To address corresponding issues caused by the soil and water background noise in paddies, the methods were further improved by involving more time-intensive pre-processing analyses, such as smoothing and derivatives of reflectance (chapter 7). VIs, band combinations, and OMNBR models were developed, tested, and compared.
In addition, different calibration and validation methods were tested to investigate whether the estimation may be improved: calibration with experimental data and validation with farmers' data (chapter 3–6) and a pooled dataset of experimental and farmers' data, with random division in calibration and validation subsets (chapter 7).
This dissertation is organized into nine chapters. This introduction (chapter 1) is followed by a basic chapter (chapter 2), with the basics of agronomy and the phenology of winter wheat and rice (chapter 2.1), the definitions of biomass and plant nitrogen (chapter 2.1.3), an overview of the basics of remote sensing and proximal remote sensing of vegetation (chapter 2.2), and a geographic overview of the study areas and of the ground truth in the test sites. Then, chapters 3–7 follow with the five research papers corresponding to the briefly summarized research focuses and results:
Chapter 3 (LI et al., 2008): The broad bands of the Quickbird satellite sensor were simulated using hyperspectral field data. Spectral indices were calculated to estimate biomass and plant nitrogen
1. Introduction
9 in winter wheat at different growth stages based on experimental data. The results were validated using farmers' field data. The simulated bands were used to determine the N status at a large observational scale in the next step with the best performing index, RVI.
Chapter 4 (KOPPE et al., 2010): The broad band vegetation indices from EO-1 ALI imagery, and the narrow band vegetation indices and best band combinations from EO-1 Hyperion imagery were calculated for farmers' fields across the winter wheat growing season to estimate the biomass, plant height, and N status at a large scale. The best band combinations for the Normalized Ratio Index (NRI) provided best estimates of biomass and plant nitrogen.
Chapter 5 (GNYP et al., 2014b): A multiscale approach regarding the experimental and farmers' fields was performed to upscale stepwise regression models. The models were based on hyperspectral indices derived from field hyperspectral data for estimating winter wheat biomass across the entire growing season. Finally, the approach was transferred to a larger scale using EO-1 Hyperion data. As shown in chapter 5, the proposed NRI and a newly developed index (GnyLi) have the highest accuracies.
Chapter 6 (GNYP et al., 2013): The best band combinations based on SR and NRI equations and multiple linear regression (MLR) models were derived from field hyperspectral data and were fitted on multiyear experimental data at different growth stages of rice. The established multiyear models were tested at a large scale using data collected from farmers' fields. The best band combinations and MLR bands for biomass estimation were identified.
Chapter 7 (GNYP et al., 2014a): The experimental and farmers' field data were randomly divided into a calibration and validation dataset for each growth stage of rice. Spectral data were smoothed, and derivatives of reflectance were calculated to establish regression models based on the best band combination and optimum multiple narrow band reflectance (OMNBR) for biomass estimation. GreenSeeker broad bands were simulated. The derivatives, along with the raw hyperspectral data, were used for regression models. The OMNBR model, which was coupled with the derivative spectra, slightly improved models' accuracy.
Chapter 8 contains a discussion of the following main topics: four different non-destructive methods for the estimation of biomass and plant nitrogen by remote sensing, uncertainties by model up-scaling, the importance of single growth stages and growing season, the effect of sample size and diverse calibration/validation methods, potential errors and disadvantages in statistics and hyperspectral data collection, and unexplained biomass and plant nitrogen by hyperspectral reflectance.
Chapter 9 summarizes the main conclusions and provides an overview of future challenges and outlooks.
10 2. Basics
2.1 Agronomy of winter wheat and rice and their geographical extent
Maize, rice, and winter wheat are the main crops in both China and in the world. The production of rice and winter wheat amounted to 722 and 701 Mio. t in 2011 (Fig. 1.2), respectively (FAOSTAT, 2011), which correspondently ranked the 2nd and 3rd place in the world production after maize. Wheat is cultivated around the globe where agriculture is possible, whereas rice grows mostly in Asia. China is the main producer of both crops. Winter wheat mainly grows in Central and East China, whereas rice dominates the agricultural area in South China. Wheat represents the basic cereal to make flour for the Chinese steamed bread, named mantao, in North China, and rice is the main food in South China. Winter wheat and rice are basic elements for many staple foods and alcoholic products. In addition, the biomass of shoots serves as animal feed and biofuel. Concerning photosynthesis, wheat and rice belong to C3 plants. As such, these crops thrive in cool environments (ACEVEDO et al., 2002). Temperature, water, and nitrogen mainly regulate the growth of both crops.
2.1.1 Winter wheat
Winter wheat is a cereal grain with a long cultivation history having its origins in Fertile Crescent. Wheat belongs to the family of sweet grasses (Poaceae), subfamily of Pooideae and tribe of Triticeae. Mutations reproduced specific and replicable species of wheat, and breeders bred diverse cultivars for each region and country. The major cultivated species is Triticum aestivum (T. aestivum), which is also known as bread wheat. Additional cultivated species are Triticum spelta (T. spelta) and Triticum durum. Wheat grows as winter or summer cereal. Their differences are in the sowing time and in the growth duration. Winter cereal is sown in autumn, requires a vernalization in winter season, and its main growth is in late autumn and from spring to summer. Summer cereal is sown in spring, is not resistant to cold climate, and grows until autumn. Winter wheat is valued as a cold crop for temperate climates (FRANKE, 1997). Its root system is more extensive than that of summer wheat because of the extra time available for growth (BOWDEN et al., 2007).
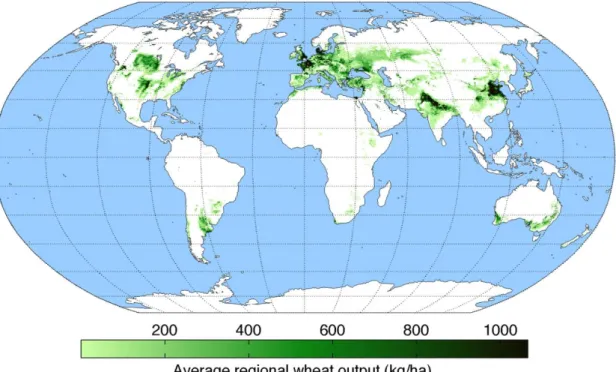
2.1.1.1 Global producing areas of winter wheat
Wheat or winter wheat mainly grows in the northern hemisphere (Fig. 2.1). The largest producer is the European Union (EU), followed by China and India (FAOSTAT, 2012). Climate conditions in the EU enable its cultivation in most of the countries. The geographic extent of wheat covers from 23.5 °N (Tropic Cancer) to 60°N in the northern hemisphere, including India and China.
In particular, the Indian union territories located south of the Himalayas and the North China Plain in China are the main producers in Asia (Fig. 2.1). In the southern hemisphere, wheat is cultivated from 23.5°S to 40°S (Tropic of Capricorn), including the western, southern, and eastern Australian coasts and Argentina. According to FAOSTAT (2011, 2012), China, India, and Australia are the only countries in the top 15 ranking, which significantly increased their annual production and total yield, whereas
2. Basics
11 Germany and Russia reduced their production in favor of other crops. The rapid development of Asia and Australia has led to high food staples demand driven by rising population in those continents. The world's most productive farms with the highest yield for wheat in 2012 were in Netherlands and Belgium, with 8.9 t/ha (FAOSTAT, 2012).
Fig. 2.1 Geographical extent of wheat production in the 2000. The map was compiled by the University of Minnesota Institute on the Environment based on provided data by MONFREDA et al. (2008). Map source:
http://en.wikipedia.org/wiki/Wheat. 2014-01-22.
2.1.1.2 Phenology of winter wheat
The phenology of winter wheat can be described in three main phases or cycles (BOWDEN et al., 2008). Each cycle breaks down into primary and secondary growth stages (Fig. 2.2). The first cycle represents the vegetative cycle, which contains the principle stages of germination, leaf development, and tillering. The first cycle stands for growth of roots, leaves, and tillers. Tillers are connected to the mother plant by internodes in the root system and represent daughter plants having their own main culm with several leaves. The vegetative cycle is interrupted by vernalization in winter, without plant growth (Fig. 2.2). Plants normally reach the leaf development stage before vernalization begins. The second growth cycle is called the reproductive cycle. The principle growth stages of this cycle are stem elongation, booting, heading, and flowering. Plants initiate developing heads, the spikelet, and the flag leaf before heading initiates. Senescence occurs after heading above the middle of the ear and proceeds upwards and downwards (ZADOCKS et al., 1974). Moisture stress, temperature, flowering time, nitrogen, and herbicides influence reproductive development (BOWDEN
et al., 2008). In the third growth cycle, which is called grain development or reproductive post- heading, grains develop from flowering to physiological maturity. Carbohydrates and protein are