NON-DESTRUCTIVE
METHODS FOR DETECTING HEALTH-PROMOTING
COMPOUNDS
COST Action 924
Working Group Meeting
Bornimer Agrartechnische Berichte
Heft 54
Potsdam-Bornim 2005
Bornimer Agrartechnische Berichte
Heft 54
Potsdam-Bornim 2005
NON-DESTRUCTIVE METHODS FOR DETECTING HEALTH- PROMOTING COMPOUNDS
COST ACTION 924
WORKING GROUP MEETING
7-8 December 2005
Leibniz-Institute of Agricultural Engineering Potsdam-Bornim e.V. (ATB)
Max-Eyth-Allee 100 14469 Potsdam-Bornim e.V.
Germany
Published by:
Leibniz-Institut für Agrartechnik Potsdam-Bornim e.V. (ATB) Max-Eyth-Allee 100
14469 Potsdam
0331 5699-0
Fax 0331 5699-849
E-Mail atb@atb-potsdam.de Internet www.atb-potsdam.de
Dezember 2005
Editors:
Dr. habil. Manuela Zude Dr. agr. Martin Geyer
Layout:
Andrea Gabbert
Published by the Leibniz-Institute of Agricultural Engineering Potsdam-Bornim e.V. (ATB) with the support of the Federal Ministry of Consumer Protection, Food and Agriculture as well as of the Ministry of Agriculture, Environment Conservation and Regional Policy of the State Brandenburg.
Contents do not necessarily reflect the publisher or editors views in this area.
No part of the material may be reproduced or utilized in any form or by any means without permission from the publisher Leibniz-Institute of Agricultural Engineering Potsdam-Bornim e.V.
The Working Group Meeting was carried out with financial support from the Commission of the European Communities under the work program COST 924. The project does not necessarily reflect the Commission's views and in no way anticipates its future policy in this area.
ISSN 0947-7314
© Leibniz-Institut für Agrartechnik Potsdam-Bornim e.V., Potsdam-Bornim 2005
Inhaltsverzeichnis
Welcome... 5 Program... 6 Health Promoting Compounds in Fruits and Vegetables – Identification of
Nutrients Grouped According their Chemical and Biological Properties
R. Brigelius-Flohé...9 Analytical Methods Based on Fluorescence Spectrometry
F.J. Schmitt, H.-J. Eckert and H.J. Eichler ...17 Recent Hardware Developments Regarding Optical Technologies
B. Sumpf, A. Klehr, H. Wenzel, G. Erbert and G. Tränkle...27 Fruit Quality Sensing by Means of Time-Resolved Reflectance Spectroscopy
P. Eccher Zerbini and A. Torricelli...37 A Non-Invasive Optical Method for the Determination of the Carotenoids Beta-
Carotene and Lycopene in Foodstuffs
M.E. Darvin, I. Gersonde, H. Albrecht, K. Hesterberg, S. Schanzer, W. Sterry and J.
Lademann ...47 Quality Assurance in Development and Application of New Analytical Methods
T. Hübert ...55 Chlorophyll Fluorescence Analysis in Horticultural Research
W.B. Herppich and M. Zude ...65 Developing a Novel Environmentally Friendly Microbiocidal Formulation from
Peel of Citrus Fruit
S. Ben -Yehoshua and V. Rodov ...68 Chlorophyll Fluorescence as a Tool for Estimation of the Flavonoid Content in
Apples
S.F. Hagen, K.A. Solhaug, G. Bengtsson, G.I. Borge and W. Bilger ...69 Relationship between Non Destructive Firmness Measurements and Texture
Analyzer Measurements in Golden Smoothee Apples
D. Molina, S. Alegre, P. Barreiro, C. Valero, M. Ruiz-Altisent and I. Recasens ...72 Apple Firmness Assessed by Non-Destructive Technology Compared to MT
Firmness and its Consumer Rating
E. Höhn, F. Gasser, H. Schärer, D. Baumgartner ...73 Monitoring the Development and Maturation of Apple Fruit on the Tree
B. Herold, I. Truppel, M. Zude, M. Geyer ...74
COST Action 924 Working Group Meeting
Bornimer Agrartechnische Berichte • Heft 54
ISSN 0947-7314
Leibniz-Institut für Agrartechnik Potsdam-Bornim e.V.
4
Assessment of Health-Related Quality in Broccoli by a Non-Invasive Chlorophyll Fluorescence Method
G.B. Bengtsson, R.A. Schöner, E. Lombardo, J. Schöner, G.I. Borge and W. Bilger ...76 Fluorescence Spectroscopy for Monitoring EVOO Quality during Heating
M. Zude, R. Cheikhousman, I. Birlouez-Aragon and D.N. Rutledge ...77 Phenolics and Other Compounds with Antioxidative effect in stone Fruit –
Preliminary Results
E. Vangdal, R. Slimestad and L. Sekse ...80 An Approach towards Rapid Optical Measurements of Antioxidant Activity in
Cultivated Blueberry Cultivars
S.F. Remberg, A.B. Wold, K. Kvaal, M. Appelgren and K. Haffner ...82 Hesperides: Highly Efficient Sensors for Perishable Fruit Products to Evaluate
the Role and Impact of Technologies on the Nutritional Damage and Elaborate Optimizing Strategies
M. Zude, M. Geyer and D. Treutter ...83 The Potential of Neutron and X-ray Imaging to Observe Water Transport in
Plants
U. Matsushima, Y. Kawabata, N. Kardjilov and W.B. Herppich ...87 Reihe Bornimer Agrartechnische Berichte... 90
Welcome
In the last years a growing interest has appeared in the development and application of non-destructive measuring tools to detect fruit and vegetable quality parameters. These tools have the advantage of being fast and objective and allow repeated measurements on the same fruit. This knowledge can improve the understanding of physiological proc- esses and as well as the modelling of product chains.
The task of this workshop is to inform the participants in detail about innovative optical methods to non-destructively detect health promoting compounds in fruit and vegeta- bles. The main questions which have to be solved are: which compounds are important for human nutrition and how can we detect these substances. The following session is dealing with physical basics of spectrometry and recent hardware developments. The next morning different optical applications are presented followed by a lecture to quality insurance of new analytical methods. In the early afternoon several manufacturers for non destructive measuring devices will present their products.
The workshop offers enough time for discussions which would be extended by a glass of bear or wine in the evening.
Dr. rer. agr. Martin Geyer
Head of Department Horticultural Engineering, Leibniz-Institute of Agricultural Engineer- ing Potsdam-Bornim e.V. (ATB)
COST Action 924 Working Group Meeting
Bornimer Agrartechnische Berichte • Heft 54
ISSN 0947-7314
Leibniz-Institut für Agrartechnik Potsdam-Bornim e.V.
6
PROGRAM
07/12/2005
13:00 – 14:00 REGISTRATION
14:00 WELCOME by Prof. Dr. Reiner Brunsch Leibniz-Institute of Agricultural
Engineering Potsdam-Bornim e.V. (ATB) 14:15–18:30 Session 1: Background
Moderator: Martin Geyer
14:15 OVERVIEW ON HEALTH PROMOTING COMPOUNDS IN FRUIT AND VEGETABLE - IDENTIFICATION OF NUTRIENTS GROUPED ACCORDING TO THEIR CHEMICAL AND PHYSICAL PROPER- TIES
Prof. Dr. Regina Brigelius-Flohé German Institute of Human Nutrition
Rehbrücke (DifE), Department Biochemistry of Micronutrients 15:00 NUTRITIONAL IMPORTANCE OF SECONDARY PLANT INGRE-
DIENTS
Prof. Dr. Florian J. Schweigert
University Potsdam, Department of Nutritional Physiology and Pathophysiology
Coffee break
16:15 ANALYTICAL METHODS BASED ON FLUORESCENCE SPEC- TROMETRY
Franz-Josef Schmitt, Prof. Dr. Ing. Hans Joachim Eichler Technical University Berlin, Institute for Optical Technologies 17:00 RECENT HARDWARE DEVELOPMENTS REGARDING OPTICAL
TECHNOLOGIES Dr. Bernd Sumpf
Ferdinand-Braun-Institut für Höchstfrequenztechnik (FBH)
17:45 HEALTH PROMOTION BY A NEW MICROBIOCIDAL FORMULA- TION COMPRISING ESSSENTIAL OIL FROM CITRUS FRUITS Prof. Dr. Shimshon Ben Yehoshua
Volcani Center, ARO Israel
12/08/2005
8:30 – 12:00 Session 2: Applications Moderator: Manuela Zude
8:30 OPTICAL PROCESS AND QUALITY SENSING (OPQS): APPLIKA- TIONS IN FOOD SCIENCE
Prof. Dr. Hans-Gerd Loehmannsröben, Dr. Michael U. Kumke, N.N.
University of Potsdam, Department of Chemistry
9:15 FRUIT QUALITY SENSING BY MEANS OF TIME-RESOLVED RE- FLECTANCE SPECTROSCOPY
Prof. Dr. Paola Eccher Zerbini
CRA - I.V.T.P.A. (Istituto sperimentale per la Valorizzazione Tecno- logica dei Prodotti Agricoli)
Coffee break
10:30 NON-INVASIVE ONLINE DETERMINATION OF ANTIOXIDANT SUBSTANCES IN FRUIT AND VEGETABLE BY RAMAN SPEC- TROSCOPIC MEASUREMENTS
Prof. Dr. Jürgen Lademann, Dr. M. Darvin, S. Schanzer, H. Richter Charité, Klinik für Dermatologie Berlin
11:15 QUALITY INSURANCE IN DEVELOPMENT AND APPLICATION OF NEW ANALYTICAL METHODS
Dr. habil. Thomas Hübert
Federal Institute for Materials Research and Testing (BAM) Lunch
COST Action 924 Working Group Meeting
Bornimer Agrartechnische Berichte • Heft 54
ISSN 0947-7314
Leibniz-Institut für Agrartechnik Potsdam-Bornim e.V.
8
13:00 – 15:00 Exhibition
COMMERCIAL COMPOUNDS FOR NON-DESTRUCTIVE SENSING Moderator: Bernd Herold
13:00 Michael Rode, Carl Zeiss Jena GmbH http://www.zeiss.com
Karsten Stein, IOM Innovative Optische Meßtechnik GmbH http://www.iom-berlin.de
Klaus Haberstroh, ESE GmbH http://www.ese-gmbh.de
Dr. Andreas Bülter, Pico Quant GmbH http://www.picoquant.com
Jessica Gerhart, ETR Elektronik und Technologie Rump GmbH http://www.etr-gmbh.de
Stefan Rieth-Hoerst, RTE Akustik + Prüftechnik GmbH http://www.rte.de
Dr. Monika Zehlicke, Beckman Coulter Sales http://www.beckman.com
Eberhard Friese, Magnettech GmbH http://www.magnettech.de Philipp Neumann, CP GbR
http://www.cp-info.de
Testing the equipment presented with own samples can be ar- ranged during the session.
Health Promoting Compounds in Fruits and Vegetables – Identification of Nutrients Grouped According their Chemical and Biological Properties
R. Brigelius-Flohé
German Institute of Human Nutrition, Potsdam-Rebruecke Department Biochemistry of Micronutrients
Arthur-Scheunert-Allee 114 – 116, 14558 Nuthetal, Germany
Introduction
Numerous observational studies provide evidence that a diet high in fruit and vegetables can reduce the risk of some diseases, including cardiovascular diseases, neurodegenerative diseases and cancer. Fruits and vegetables contain so many compounds that are putatively protective that the effects are not likely attributed to a single substance. Rather function the compounds by complementary and overlapping mechanisms. Thus we have to look at all bioactive components simultaneously to understand whether and how a certain diet contributes to disease prevention. The more than 500 dietary compounds so far identified as potential modifiers of disease development comprise, e.g. vitamins, polyphenols, glucosinolates, and organic compounds delivering essential trace elements such as selenium. Examples for these categories will be presented in this overview.
Vitamins Vitamin E
Vitamin E has for long been considered as an antioxidant only. For this reason it has been tested for its protective effect in the prevention of diseases connected to oxidative stress, mainly atherosclerosis. Numerous experiments with different animal models did not show a consistent inhibitory effect of vitamin E. Results were contradictory, depending on the model used and the feeding modus. In most of the large clinical trials vitamin E consistently failed to prevent atherosclerosis (reviewed in [1]). In addition, there is little evidence that compounds with antioxidant properties in a test tube also inhibit oxidative reactions in vivo [2]. Future studies with vitamin E should consider novel functions of vitamin E which include regulation of gene activity. Identifying the vitamin E- regulated genes and the biological processes depending thereon will definitely help to understand the real physiological role of vitamin E and to develop strategies how to use the vitamin to keep an organism healthy.
Brigelius-Flohé
Bornimer Agrartechnische Berichte • Heft 54
ISSN 0947-7314
Leibniz-Institut für Agrartechnik Potsdam-Bornim e.V.
10
Vitamin C
Vitamin C is also mainly considered as an antioxidant. It is an electron donor and therefore a reducing agent. Electrons are donated sequentially, i.e. vitamin C is first converted to a radical, the semidehydroascorbic acid or ascorbyl radical. Since the ascorbyl radical is fairly unreactive and relatively stable, ascorbate can react with a more reactive and thus more harmful radical and, therefore, may be considered to be a good free radical scavenger. Loss of a second electron results in dehydroascorbic acid.
Vitamin C is, however, required for the function of a number of enzymes. The most important are prolyl and lysyl hydroxylases which hydroxylate collagen, a process required for the adequate formation of the collagen molecular structure. Vitamin C deficiency prevents proper collagen formation, thus leading to scurvy.
In vitro, vitamin C prevents oxidation of LDL, proteins and DNA. In animal experiments it has been shown to have pro- and antioxidant effects, depending on the experimental design [3]. Beneficial effects of supplemental vitamin C have been noted in small studies, while large, placebo-controlled and prospective studies have failed to show benefit in conditions believed to result from oxidative stress. To increase vitamin C plasma levels to putatively protective concentrations corresponding to in vitro studies is not possible, since the plasma concentrations are tightly controlled and excess vitamin C is excreted. The organism obviously tries to prevent any accumulation of vitamin C.
Oxidation states of ascorbate R1
R2
CH3 O O
H
CH3 C
H3 H H3C H CH3
CH3
d-α-Tocopherol (2R4'R8'R)
+ 2 H + - 2 H +
A s c H 2 H O
O H
O
O H O
H O
- e
A s c H O
O H
O
O O
O
D H A H O
O H
O
O O
O + e
- e
+ e
Polyphenols
Polyphenols are a wide variety of compounds that occur in fruits and vegetables, wine, tea, extra virgin olive oil, chocolate and other cocoa products. The family is composed of flavonoids, phenolic acids, stilbenes and lignanes.
Flavonoids
Flavonoids are divided into several classes according to the degree of oxidation of the chroman heterocycle and the position of the attached benzene ring: flavones, flavonols, isoflavons, flavanones, flavanols, anthocyanins, and proanthocyanidins [4]. They are present in food as glycosides and largely processed to their aglycones before absorption.
From the most prominent flavonoids quercetin, e.g., is a flavonol, catechin a flavanol, genistein an isoflavone, and cyanidin an anthocyanidin.
Stilbenes
Stilbenes are less ubiquitous. One of them, resveratrol present in red wine has recently received great attention. Its anti-inflammatory and chemopreventive properties have first been attributed to antioxidant activity, Recently, however, an inhibition of NFκB activation was described [5]. Depending on the tissue investigated this is achieved by an interference with early events in the signaling cascades mediated by Toll-like
O
OH O O
H
O
OH O O
H
Flavanon
Flavon
OH O
OH O O
H
Flavanol
OH O
OH O O
H
OH O
OH O H
OH O
OH O H
Anthocyanidin O
OH O O
H
Isoflavon
Flavonol Flavan-3-ol
Brigelius-Flohé
Bornimer Agrartechnische Berichte • Heft 54
ISSN 0947-7314
Leibniz-Institut für Agrartechnik Potsdam-Bornim e.V.
12
receptors or by a stimulation of Sirt1 histone deacetylase activity that leads to deacetylation of the p65 submit of NFκB which prevents transcriptional activity.
Although the precise mechanism of resveratrol action is not known yet, the resorcin moiety appears to be essential for the chemopreventive efficacy.
Several polyphenols thus have been demonstrated to exert clear antioxidant properties in vitro. However, the concept that these characteristics constitute their diverse pharmacodynamic profiles now appears to be too simplistic. Evidence is indeed accumulating that polyphenols may provide an indirect protection by activating endogenous defense systems, such as the adaptive response( see below).
Glucosinolates
Glucosinolates are a class of about 100 naturally occurring thioglucosides that are characteristic of the Cruciferae and related families in the order Capparales including broccoli, cauliflower, Brussel sprouts, cabbage, mustard, and watercress. The skeleton
O H
O H
OH
resveratrol glucosinolate
R
S-ßD-Gluc NOSO3
R
SH NOSO3
R-N=C=S R-C N
+ Glucose
R-S-C N isothio-
cyanate
nitrile thiocyanate Structure and metabolism of glucosinolates
S N C S O
C H3
Sulforaphane
of glucosinolates consists of a thioglucosidic link to the carbon of a sulphonated oxime.
Glucosinolates appear to have little biological impact themselves, but release biologically active products such as isothiocyanates or indoles depending on the structure of the side chain. Degradation requires myrosinase, an enzyme provided by the plants themselves and released during the disruption of the plant cells during mastication or chopping. Cooking destroys enzyme activity. Alternatively glucosinolates can be cleaved by gastrointestinal bacteria. Common products of glucosinolate hydrolysis are isothiocyanates, nitriles and thiocyanates.
Sulphoraphane
Sulforaphane is released from glucoraphanin and regarding chemopreventive effects one of the best investigated isothiocyanate. It inhibits phase 1 enzymes such as cytochrome P450 and induces phase 2 enzymes. The latter function makes it a potent activator of the adaptive response which enables an organism to cope with oxidative/xenobiotic challenge (see below). However, as an electrophile it can also form DNA adducts indicating that the beneficial effect is dose-dependent.
The adaptive response
Induction of phase 2 enzymes is a highly effective strategy for the protection against carcinogenesis and other forms of electrophile and oxidant challenge. Induction is regulated via the Nrf2/Keap1 system. Under unstressed conditions Nrf2 is kept in the cytosol by the association to Keap1 anchored to the action cytoskeleton. Dissociation of the complex is initiated by the modification of thiol groups in the Keap1 molecule. The resulting change in configuration releases Nrf2 and allows its translocation into the nucleus where it binds to its responsive element (ARE = antioxidant responsive element, also called electrophile responsive element, EpRE).
Compounds modifying Keap1, e. g. are isothiocyanates, dithiolethiones, oxidizable hydroquinones, Michael-reaction acceptors, hydroperoxides and heavy metals. Even quercetin, has been shown to activate Nrf2. Target genes are: heme oxygenase-1, GSTs, γ-GCS (γ-glutamyl-cysteine synthetase), thioredoxin, thioredoxin reductase, GI- GPx, NADPH quinone oxidoreductase.
Brigelius-Flohé
Bornimer Agrartechnische Berichte • Heft 54
ISSN 0947-7314
Leibniz-Institut für Agrartechnik Potsdam-Bornim e.V.
14
Selenium
In mammals, selenium is incorporated into the peptide chain of selenoproteins as selenocysteine. For this, selenide is required which can be derived from inorganic salts, especially selenites, or from organic selenium compounds. These have to be transformed into selenocysteine from which selenide is released by the β-lyase. The most prominent mammalian selenoprotein families are the glutathione peroxidases, the thioredoxin reductases and the deiodinases. All are involved in redox-regulated cellular processes, however, are not typical antioxidant enzymes.
The chemical nature of the selenium compounds present in food are only scarcely known (for review see [6]). Apart from selenomethionine, mainly methylated seleno amino acids like selenomethylselenocysteine and selenomethylselenomethionine have been identified. Methylated seleno amino acids have been made responsible for the anticarcinogenic effect of selenium. However, it remains to be tested whether they are suitable precursors for selenoprotein biosynthesis.
Nucleus Nrf2
ARE
Maf Transcription of
target genes Activator
Keap1 S S
or Keap1 activator
S S Keap1 Nrf2
SHSH
Actin
The Nrf2/Keap-1 System
Conclusions
Most of the 'antioxidant' components of a healthy fruit and vegetable-based diet proved not to exert their putative health benefits by means of their antioxidant potential. The biological role of 'antioxidant' vitamins has rather to be seen in specific functions as cofactors or regulators of enzymes. Quite a number of polyphenolic compounds and the glucosinolate-derived isothiocyanates such as sulforaphane activate the Nrf2/Keap1 system thus triggering an adaptive response to cope with greater challenge by xenobiotics or oxidants. In part at least, this adaptive response depends on selenoproteins and thus on the intake of adequate bioavailable selenium.
References
[1] STOCKER R., KEANEY J.F. (2004): Role of oxidative modifications in atherosclerosis.
Physiol Rev 84, 1381-1478
[2] HEINECKE JW.(2001): Is the emperor wearing clothes? Clinical trials of vitamin E and the LDL oxidation hypothesis. Arterioscler Thromb Vasc Biol 21, 1261-1264
[3] DUARTE T.L., LUNEC J. (2005): Review: When is an antioxidant not an antioxidant? A review of novel actions and reactions of vitamin C. Free Radic Res 39, 671-686
[4] SCALBERT A.,WILLIAMSON G. (2000): Dietary intake and bioavailability of polyphenols. J Nutr 130, 2073S-2085S
[5] YOUN H.S., LEE J.Y., FITZGERALD K.A., YOUNG H.A., AKIRA S., HWANG D.H. (2005):
Specific inhibition of MyD88-independent signaling pathways of TLR3 and TLR4 by resveratrol: molecular targets are TBK1 and RIP1 in TRIF complex. J Immunol 175, 3339- 3346
[6] BIRRINGER M., PILAWA S., FLOHÉ L. (2002): Trends in selenium biochemistry. Nat Prod Rep 19, 693-718
NH2
HO2C Se
Me
Se-Methylselenocysteine
Se methionine NH2
Se
HO2C Me
Analytical Methods Based on Fluorescence Spectrometry
F.J. Schmitt1, H.-J. Eckert2 and H.J. Eichler1
1 Optisches Institut der Technischen Universität Berlin, Straße des 17. Juni 135, 10623 Berlin Germany
2 Max-Volmer-Laboratorium für Biophysikalische Chemie, Straße des 17. Juni 135, 10623 Berlin, Germany
Introduction
The spectrometry of light is a powerful tool for non-invasive analysis of material proper- ties. It is a sensitive method of investigation, because the visible photons which carry an energy of about 2 eV interact with the electrons of molecules without destroying chemi- cal bonds. The chemical structure of different substances influences the specific quality of the absorption and emission spectra of the investigated matter.
This contribution deals with the spectrometry of light emitted from electronically excited states which is called fluorescence spectrometry.
While many chemical substances present in plants or fruits like carbohydrates, proteins and lipids absorb visible light only weakly or convert the absorbed energy to heat, some others, like most pigment molecules, NADPH or aflatoxin show fluorescence. During the past 20 years there has been a remarkable growth in the use of fluorescence in biologi- cal sciences. Environmental monitoring, clinical chemistry and DNA sequencing are just a few areas of application.
Because of the sensitivity of fluorescence spectrometry the wavelength and also the time dependency of the emitted light helps to identify and quantify fluorescent sub- stances with high accuracy. So this method is a tool for the investigation of fruit and plant quality parameters represented by the existence of toxic substances or health promoting components. Fluorescence also delivers information about the interaction between different pigments which is an important aspect in photosynthesis research.
For that reason the spectrometry of fluorescence is adequate for analysing the living plant including fundamental research of the basic principles of photosynthetic energy conversion.
Basic principles of spectrometry
The interaction of light and matter can be interpreted macroscopic or microscopic. On the macroscopic level surface interactions and interactions inside a medium are distin- guished.
Schmitt, Eckert, Eichler
Bornimer Agrartechnische Berichte • Heft 54
ISSN 0947-7314
Leibniz-Institut für Agrartechnik Potsdam-Bornim e.V.
18
In this interpretation which leads to geometric optics the optical properties are described by the complex refraction index n~=n+iα. The real part n describes the refraction, the reflection and the transmission from surfaces between different materials. The complex part α
( )
λ which strongly depends on the wavelength λ of the light denotes the absorp- tion inside a medium. Absorption along the axis x is described by Lambert Beer´s Law( ) x I e
( ) x: I e
xI
λ κπ λ
α −
−
=
=
04
0 , where I
( )
x describes the intensity of the light inside the medium after propagation of a distance x, I0 is the initial intensity and κis the absorp- tion coefficient.The microscopic interpretation has to assume direct interactions between two quantum objects, the photon and the electron (the optical properties of matter are mostly deter- mined by the electrons). In microscopic interpretation the transmission inside the matter is caused by elastic scattering of light from all different atoms.
The absorption inside the matter is an inelastic scattering of the photons from the elec- trons. In Bohr´s atom model the electron can only stay in certain energy levels called eigenstates of the atom. Only photons with the energy of the difference between two eigenstates can be absorbed with high efficiency. Absorption spectrometry is measuring the typical absorption energies which appear as dark “lines” in the spectrum represent- ing a “fingerprint” of the observed matter.
Excited states of molecules and average lifetimes of excited states
After light absorption an atom or molecule is “excited”. The lifetime of the excited states strongly depends on the electronic structure of the molecule. For pigments showing high fluorescence a typical lifetime of the first excited state is some ns (i.e. 10−9s).
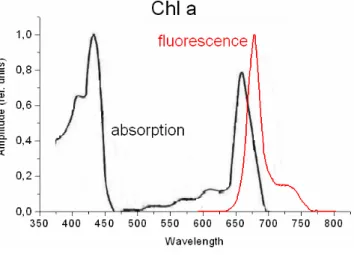
Figure 1: absorption and fluorescence of Chl a in solution.
In molecules the fluorescence light has not the same wavelength as the absorbed light.
It is normally red shifted to the absorbed light and the spectral properties of the fluores- cence also depend on the electronic states in the molecule and the possible transitions between these states.
When we look at chlorophyll then there is a big delocalised Pi-electron system. The first excited state of this system has a lifetime of about 5 ns for isolated chlorophyll mole- cules. The energy is partially converted to heat and mainly emitted as fluorescence and phosphorescence light with a maximum at 680 nm (Figure 1). For that reason green leaves emit red fluorescence.
Fluorescence spectrometry: a tool for molecule identification
Fluorescence spectrometry helps to understand the electronic properties and the transi- tion processes in molecules but it is also a useful tool for the identification of molecules by their typical fluorescence spectrum.
When matter which is composed by several substances is exited by a light source the emission of all fluorescent substances will mix with the light of the source. To avoid an unspecific excitation of several molecules, fluorescence spectrometry is often done with a laser system or another monochromatic light source, which helps to excite molecules specifically.
At room temperature the electrons are not localised in a certain state but they are tem- perature dependent distributed to several states. For that reason the fluorescing mole- cules do not emit a sharp frequency but a fluorescence emission band with a certain bandwidth.
Low temperature measurements can help to avoid this temperature induced fluores- cence line broadening. But in this case a biological sample is destroyed by the freezing process. Another tool for specific pigment identification is the variation of excitation wavelength. If there are no energy transfer processes between different fluorescing pigments only the fluorescence of the pigments that can absorb the excitation light will be observed. If the absorption spectra of the possible molecules in the sample are known, a variation of excitation wavelength can also help to identify a specific fluoresc- ing pigment without line narrowing just by observation of the intensity of fluorescence signals in a certain spectral bandwidth after excitation.
Schmitt, Eckert, Eichler
Bornimer Agrartechnische Berichte • Heft 54
ISSN 0947-7314
Leibniz-Institut für Agrartechnik Potsdam-Bornim e.V.
20
In some cases, when the distance between different fluorophore molecules is in the nm area, there occur energy transfer processes. The excited state of one fluorophore can be transferred to another one and induce a fluorescence signal in a spectral range of the latter fluorophore which was not directly excited. These energy transfer processes play an important role nature where these processes are important in biological terms.
Especially in photosynthesis the transfer of excitation energy from antenna pigments to a reaction center where charge separation is possible is important for the plant physiol- ogy (Figure 2). So the kinetic of the fluorescence decay of a donor pigment or temporal fluorescence rise of a molecule that gets energy from the donor (acceptor pigment) is an evidence for energy transfer. These processes can be analysed by time resolved fluorescence spectrometry.
Mathematical aspects of fluorescence dynamics
The fluorescence of a single molecule without energy transfer processes is decaying in time with a certain rate constant kFluor if no other relaxation processes are possible.
Fluor
k is the hypothetical fraction of excited electrons falling to the ground state per time interval and emitting fluorescence light that would be observed if relaxation could only occur as fluorescence. If other energy dissipation processes (for an example also pho- tochemical quenching in photosynthetic organisms) are possible with a rate constant
kDiss, the time constant of the fluorescence decay depends on all possible energy dissi- Figure 2: pathway of light in pigment protein complexes
of an antenna system in a photosynthetic organism.
pation processes. Then the change of excited states on time dt
N d 1
is given by the product of the sum of all rate constants of the possible relaxation processes and the concentration of excited states N1 :
( )
11
k k N
dt N d
Diss Fluor
+
−
=
(1)The integration of eq. (1) delivers the time dependency of the excited states N1
( )
t :( ) t N ( ) e
(k k )tN ( ) e
τtN
1=
10 ⋅
− Fluor+ Diss⋅=
10 ⋅
− (2)( )
0N1 denotes the initial concentration at t=0.
The inverse sum of all rate constants is the fluorescence decay time
Diss Fluor k
k +
= 1
τ .
The fluorescence intensity decays exponentially in time, because it follows proportional to the concentration of excited states by
( ) t k N ( ) t
F =
Fluor⋅
1 (3)while the non fluorescent energy relaxation is competing with the rate constant kDiss. For that reason the fraction of the energy relaxation by fluorescence and the total en- ergy relaxation, which is called “fluorescence quantum yield” denotes as
Diss Fluor
Fluor
F
k k
k
= +
Φ
(4)At room temperature energy transfer between two coupled pigments occurs from the donor molecule to the acceptor with a rate constant
k
12 but also backwards from the acceptor to the donor with a rate constantk
21. In that case the fluorescence decay has to be calculated from the solution of a system of coupled linear differential equations 1st order (one equation for each pigment in an energy transfer chain of an arbitrary number of coupled molecules ):(
( ))
(
( )2 21)
2 12 12
2 21 1
12 1 1
N k N k dt k
N d
N k N k dt k
N d
Fluor Fluor
+ +
−
=
+ +
−
=
(5)
Schmitt, Eckert, Eichler
Bornimer Agrartechnische Berichte • Heft 54
ISSN 0947-7314
Leibniz-Institut für Agrartechnik Potsdam-Bornim e.V.
22
This system is solved by a sum of two exponential functions with different time con- stants. The decay of the fluorescence is no longer monoexponential or monophasic but it is biphasic:
( )
1 1 2 2 2( )
1 1 2 21
τ τ
τ τ
t t
t t
e B e
B t
N e
A e
A t
N
−
−
−
−
+ = +
=
(6)So the time dependency of the fluorescence from both pigments is given by putting the solution (6) in eq. (3). The measured fluorescence signal can be analysed by matching two exponential functions to the measured data and the best fit delivers the time con- stants τ1 and τ2. If more than two pigments are coupled the system becomes more complex (multiphasic decays) [1].
Time resolved fluorescence spectrometry
Time resolved fluorescence spectrometry can be carried out by direct monitoring of the fluorescence signal with a fast photodiode and an oscilloscope. In that case a strong signal is necessary to reach a high signal to noise ratio.
Modern techniques use single photon counting for time resolved spectrometry. In that case averaged only one photon during 100 excitation processes is detected. Comparing the time difference between the excitation pulse and this first incoming photon the fluo- rescence decay can be resolved with high resolution if enough (at least several hundred thousands) photons are collected. This technique needs pulsed laser systems with high excitation repetition rates in the MHz area to reach the final number of detected photons in an accurate time (of several minutes or hours). Using time- and wavelength-resolved
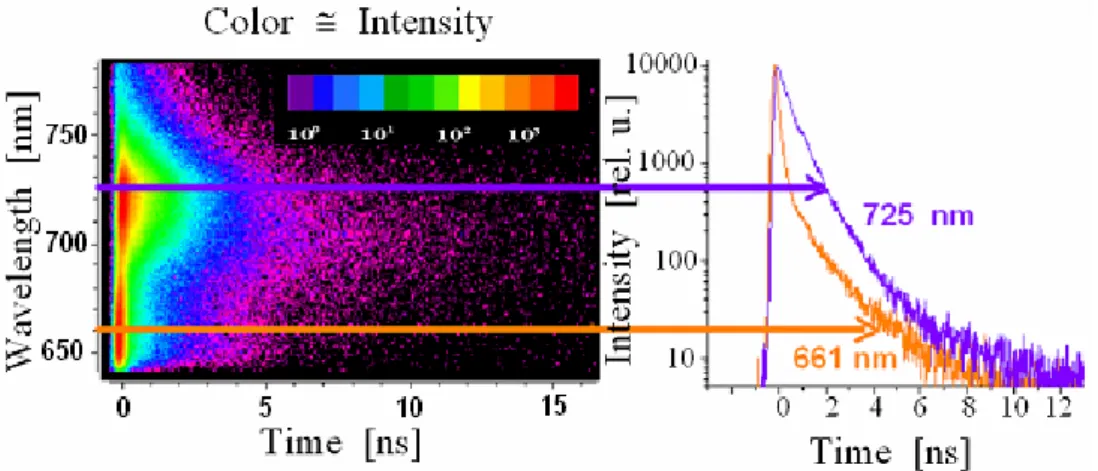
Figure 3: Colour intensity plot of a time- and wavelength resolved fluores- cence measurement and the decay of fluorescence at 661 nm and 725 nm.
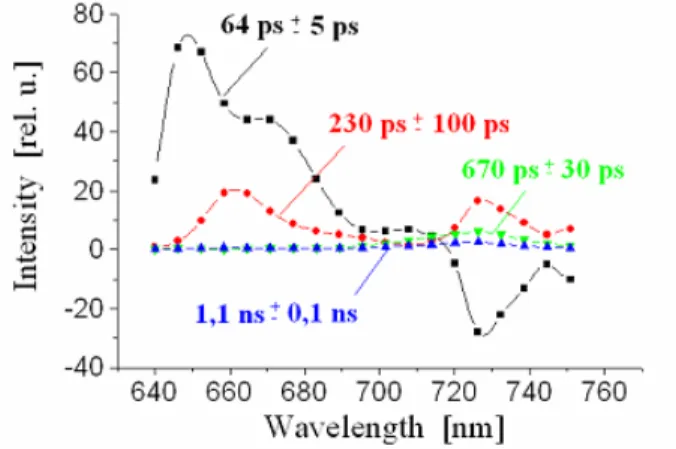
fluorescence spectrometry one gets the time dependency of the whole fluorescence spectrum. Figure 3 shows the original data which is collected in a 2-dim plot of the in- tensity (pictured by the colour) in dependency of wavelength and time. The analysis of this data shows the time constants and the wavelength dependent initial amplitudes of the resolved four exponential components which are shown in the form of “Decay asso- ciated spectra” by Figure 4.
Non-invasive investigation of photosynthesis: Acaryochloris marina (A.marina) The time resolved fluorescence spectrometry is widely used for monitoring the energy transfer processes in photosynthesis. In Optical Institute of TU Berlin actually an inter- esting cyanobacterium called A.marina is investigated that rose strong attention of the scientific community after the discovery in 1996 [2]. A.marina is the only known organ- ism containing chlorophyll d as the mayor pigment in the membrane intrinsic antenna system. The energetic state of excited Chl d is lower than Chl a or Chl b which are mostly found in green plants. So A.marina absorbs light in the near infrared region which is not useful for other organisms. The mechanism of water oxidation process with the lower energy of Chl d remains still unclear. The data of Figure 3 and Figure 4 are measurements performed on A.marina.
The described method of time resolved fluorescence spectrometry showed, that the en- ergy which is absorbed by additional pigments called phycobiliproteins (PBP) is trans- ferred to Chl d with a time constant of about 60 ps (denoted as 64 ps component in Fig- ure 4), much faster than the energy transfer from PBP to Chl a in other Cyanobacteria like Synechococcus [3].
In Figure 4 the energy transfer appears as a fast fluorescence decay component in the emission band of PBP (640 – 680 nm) and a corresponding rise-term (i.e. a fluores- cence component with a negative amplitude) at the wavelength of Chl d emission (725 nm) [4].
Figure 4: Decay associated spectra of the data shown in Figure 3.
Schmitt, Eckert, Eichler
Bornimer Agrartechnische Berichte • Heft 54
ISSN 0947-7314
Leibniz-Institut für Agrartechnik Potsdam-Bornim e.V.
24
Non-invasive detection of Aflatoxin fluorescence
The detection of fluorescence signals without the need of a high time resolution is more easy in general. For an example aflatoxin pigments show high autofluorescence sug- gesting the use of such fluorescence signals for non-invasive aflatoxin detection.
If several laser systems can be used for excitation the wavelength dependency of the broad fluorescence signal itself, the dependency of the excitation wavelength and also the time constant of the fluorescence decay can be used for specific detection, for an example of aflatoxins, in contamination control processes.
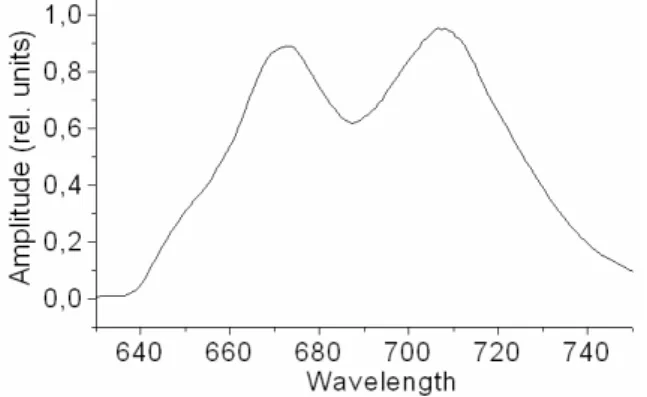
Figure 5 shows the colour intensity plot of a measurement on mould cells. Mould shows strong fluorescence signals around 670 nm and 720 nm (Figure 6) which are easy to detect also in low concentrations. These two emission maxima indicate the presence of two different fluorophores.
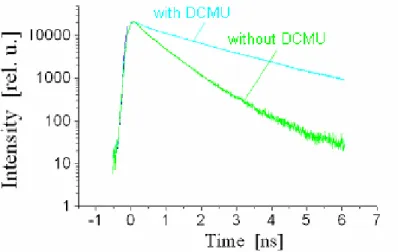
Effect of toxic substances on photosynthesis
While the detection of aflatoxin fluorescence is performed by measuring the spectral dependency of fluorescence intensity, the time resolved fluorescence spectrometry can be used to study the effect of toxic substances on photosynthesis like the effect of the inhibitor 3-(3',4'-Dichlorphenyl)-1,1 -Dimethylharnstoff (DCMU). DCMU blocks the reoxi dation of reduced plastoquinone (QA−), which is the secondary electron acceptor in the reaction center of photosynthetic organisms.
Figure 5: Colour intensity plot of a measurement on mould.
Figure 6: time integrated fluorescence spectrum of Figure 5.
For that reason the energy transfer chain is blocked and the rate constant for photo- chemical energy conversion vanishes (the reaction centers are “closed”) According to eq. (4) this will result in a rise of the fluorescence quantum yield when charge accumu- lates on QA during illumination of the inhibited organism.
The time resolved spectrometry (Figure 7) shows a much longer decay time of the chlo- rophyll fluorescence if the reaction centers are closed.
References
[1] LAKOWICZ J.R.(1999): Principles of Fluorescence spectroscopy, New York,
[2] MIYASHITA H.,IKEMOTO H.,KURANO N.,ADACHI K.,CHIHARA M.,MIYACHI S.(1996): Chlo- rophyll d as a major pigment, Nature 383: 402
[3] MULLINEAUX C.W., HOLZWARTH A.R. (1991): Kinetics of excitation energy transfer in the cyanobacterial phycobilisome-Photosystem II complex, Biochim Biophys. Acta 1098: 68- 78
[4] PETRÁŠEK Z., SCHMITT F.-J.,THEISS CH., HUYER J., CHEN M., LARKUM A., EICHLER H.J., KEMNITZ K.,ECKERT H.-J. (2005): Excitation energy transfer from phycobiliprotein to chlo- rophyll d in intact cells of Acaryochloris marina studied by time- and wavelength resolved fluorescence spectroscopy, Photochemical & Photobiological Sciences, in press
Figure 7: Effect of DCMU on the fluorescence dynamics of A.marina at 725 nm.
Recent Hardware Developments Regarding Optical Technologies
B. Sumpf, A. Klehr, H. Wenzel, G. Erbert and G. Tränkle Ferdinand-Braun-Institut für Höchstfrequenztechnik
Gustav-Kirchhoff-Straße 4, 12489 Berlin-Adlershof, Germany
Introduction
Diode lasers are widely used compact and robust light sources for different purposes.
Beside high-power applications in material processing (welding, soldering, etc.) and as pump sources for other lasers, they are also used in medical and sensor applications.
The latter includes the direct application of these devices as well as the use of diode lasers as pump sources for other more complex laser systems.
Different semiconductor materials allow to manufacture laser devices from the ultravio- let spectral range [1] up to the mid-infrared [2]. The devices are based on compound semiconductors of the type AIIIBV (GaN, AlN, GaAs, GaP, InP, etc.) for the short wave- length range or AVIBVI (PbS, PbSe, PbTe, SnTe, etc.) for the mid-infrared. The use of ternary mixtures, e.g. In1-xGaxP, GaAs1-xPx, PbS1-xSex, allows to adjust the wavelength of the devices to requested values.
Gaps in spectral coverage can be filled by applying non-linear processes, like second harmonic generation (SHG), sum frequency generation (SFG) or difference frequency generation (DFG).
Diode lasers can be ideally used as narrow-linewidth fixed frequency light sources for the excitation of fluorescence or Raman scattering. Due to their tuneability over a range of more than 10 nm simply by changing temperature and current, they can ideally be used in absorption or photo-acoustic spectroscopy.
In this paper, a short overview of diode lasers for spectroscopic applications in the VIS- and NIR-range will be given. This includes the presentation of the properties of narrow linewidth DFB-light sources at an output power up to 500 mW, hybrid narrow linewidth high-power devices with a maximum output power of 7 W, and light sources using non- linear frequency conversion with diode lasers as pump sources.
Sumpf, Klehr, Wenzel, Erbert, Tränkle
Bornimer Agrartechnische Berichte • Heft 54
ISSN 0947-7314
Leibniz-Institut für Agrartechnik Potsdam-Bornim e.V.
28
Narrow-linewidth light sources – RW-DFB lasers
In our institute, monolithic narrow-linewidth light sources are manufactured in the spec- tral range between 760 nm and 1100 nm. Wavelengths of special interest are:
• 760 nm – 765 nm: absorption spectroscopy of oxygen
• 780 nm: atomic clocks 87Rb
• 785 nm: excitation sources for Raman spectroscopy
• 852 nm: atomic clocks 133Cs
• 860 nm: SHG for digital film exposure at 430 nm
• 920 nm: SHG for laser display technology at 460 nm (blue)
• 935 – 945 nm: absorption spectroscopy, remote sensing of H2O vapour
• 976 nm: SHG for replacement of Ar+-Laser at 488 nm
• 1060 nm: SHG for laser display technology at 530 nm (green)
0 200 400 600 800
0 100 200 300 400
500 T = 20°C
Power P / mW
Current I / mA
Figure 1: Schematic view of a high power DFB laser.
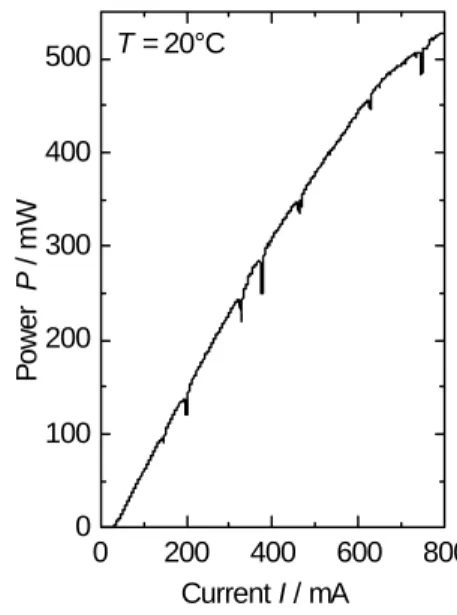
Figure 2: Power-current characteristic of a 940 nm DFB-laser at T = 20°C. The dips in the curve are originated by absorption lines of water vapour.
L
RF
RR
W
938 940 942 944 0.0
0.1 0.2 0.3 0.4 0.5 0.6
Laser at 50°C
Laser at 20°C
HITRAN
relative intensity / arb. units
Wavelength λ / nm
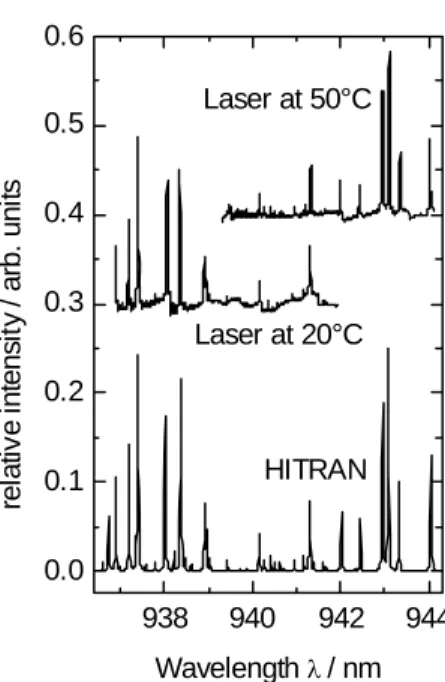
Figure 3: Water vapour spectra measured with the 940 nm DFB-laser in comparison to the well-known spectroscopic data from the HITRAN-database.
The frequency selective element in these structures is an internal grating. To obtain high power fundamental lateral mode operation the grating has to be integrated into the epitaxial layer structure, which requires a two-step epitaxy.
A schematic view of a DFB diode laser is presented in Figure 1. The layer structure was fabricated with metal organic vapour phase epitaxy (MOVPE). The internal grating was manufactured by holographic lithography and wet-chemical etching [3]. The laser length L is typically 1.5 mm. The reflectivity of the front facet is RF ≈ 10-3, the rear facet reflectivity RR ≈ 0.95.
In Figure 2 a power current characteristics of a 940 nm DFB-laser at T = 20°C is shown. The threshold current Ith is about 35 mA, the slope efficiency S = 0.9 W/A. The maximum output power is 500 mW. In the curve pronounced dips are observable.
These dips are due to water vapour absorption in the measurement path.
The same measurements were performed at 20°C and 50°C. From the data with and without absorption the water vapour spectrum can be calculated using Lambert-Beers- law. In Figure 3, the obtained spectra were compared with the data from the HITRAN database [4]. The agreement between the database and the measured spectra is excel- lent. It illustrates that at one selected temperature a continuous current tuning over 5 nm is possible.
DFB-lasers suitable for absorption spectroscopy were also manufactured for 780 nm (Pmax = 300 mW) [5], 850 nm [6], 860 nm (Pmax = 400 mW) [7], and 980 nm (Pmax = 900 mW) [8].
Sumpf, Klehr, Wenzel, Erbert, Tränkle
Bornimer Agrartechnische Berichte • Heft 54
ISSN 0947-7314
Leibniz-Institut für Agrartechnik Potsdam-Bornim e.V.
30
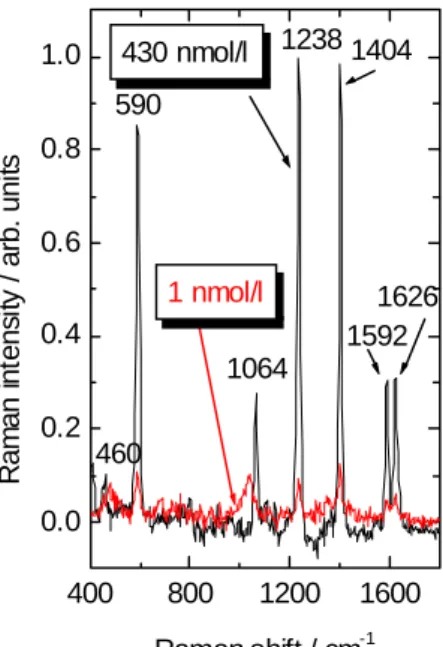
High-power narrow-linewidth diode lasers with an output power larger than 150 mW at λ = 785 nm [9] meet the requirements for Raman spectroscopy. A typical power current characteristic for such a diode is shown in Figure 4. This laser was used for in situ sur- face enhanced Raman spectroscopy (SERS) of polycyclic aromatic hydrocarbons [10].
Typical SER- spectra for pyrene are shown in Figure 5. With a field operable NIR- Raman setup, it was possible to detect 1 nmol/l of this substance in artificial seawater.
0 50 100 150 200 250 300 0
20 40 60 80 100 120 140 160 180 200
Current I / mA
Optical power P / mW
400 800 1200 1600 0.0
0.2 0.4 0.6 0.8 1.0
1626 1592 12381404
1064 590
460
1 nmol/l 430 nmol/l
Raman intensity / arb. units
Raman shift / cm-1
Figure 4: Power-current characteristic of a 785 nm DFB-laser at T = 35°C. The wavelength at 150 mW is 785 nm as necessary for common Raman-set-ups.
Figure 5: SER spectra of pyrene in sea- water measured with the DFB laser emit- ting at 785 nm with 25 mW at sample and an integration time of 10 s.
The maximal output powers of the investigated RW-DFB-laser in the spectral range from 750 nm up to 1080 nm fulfil the demands for the different spectroscopic applica- tions.
High-power light sources
Some applications require not only narrow spectral linewidth but also higher output powers in the Watt-range. One interesting medical application is for example the lung diagnostics using polarized helium. This requires laser sources emitting at about 1083 nm with a spectral linewidth matched to the Doppler-width of the low pressure He- gas, i.e. 0.01 nm, a good beam quality, and an output power of 4 W. DFB-laser are lim- ited to about 500 mW output power. Therefore a hybrid master-oscillator power- amplifier (MOPA) system was developed. The master oscillator, e.g. a DBR-laser was tuned to the desired seed wavelength by varying temperature or current. As master os-
cillator a highly anti-reflection coated tapered devices was used. A scheme of the set-up is shown in Figure 6.
MO: DBR-laser L1 FI L2 PA: Tapered amplifier
Figure 6: Scheme of the experimental set-up of the MOPA system;
L1, L2 – lenses; FI – Faraday isolator.
The master-oscillator was a DBR laser with a total length of 2 mm. The lengths of the individual sections are 1000 µm, 500 µm, and 500 µm (gain, phase, DBR). The front- and back facets are coated to 10% and 0% reflectivity, respectively. The wavelength of λ = 1083 nm was obtained at T = 40°C. The threshold current is Ith = 42 mA and the slope efficiency is S = 0.5 W/A. The beam of the DBR-laser was focussed via two lenses into the power amplifier (PA). To prevent back-reflections, a 60 db Faraday isola- tor was inserted between the two lenses. A seed power of 36 mW was used in the MOPA experiment.
The power amplifier (PA) was a 4 mm long anti-reflection coated tapered laser. The power-amplifier-current characteristic was measured at T = 20°C. The result is shown in Figure 7 a maximum output power of 7.3 W was measured.
0 2 4 6 8 10 12
0 1 2 3 4 5 6 7 8
T = 20°C
optical power P / W
power amplifier current I / A
1040 1060 1080 1100
-80 -70 -60 -50 -40 -30 -20
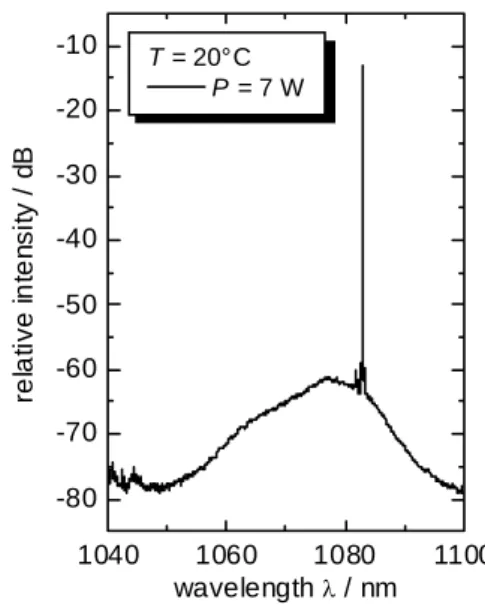
-10 T = 20°C P = 7 W
relative intensity / dB
wavelength λ / nm
Figure 7: Power-current characteris- tic of the 1083 nm MOPA system.
Pseed = 36 mW, T = 20°C.
Figure 8: Spectrum at T = 20°C and P = 7 W.
At P = 7 W the side-mode suppression rate is about 42 dB and herewith comparable to the features of the DBR-laser. The beam quality was measured up to an output power
Sumpf, Klehr, Wenzel, Erbert, Tränkle
Bornimer Agrartechnische Berichte • Heft 54
ISSN 0947-7314
Leibniz-Institut für Agrartechnik Potsdam-Bornim e.V.
32
of about 4 W [11]. The output beam of the MOPA was nearly diffraction-limited with a beam propagation ratio M2 = 2. Together with the reached output power the spectral features and the beam quality fulfil the demands of the requested application.
Beside this rather large system developments towards a compact micro-bench design are carried out. In a first experiment the two lenses and the Faraday isolator were re- placed by a single GRIN-lens. In this compact set-up an output power of 3.1 W was reached [12]. Such a MOPA will be placed on a compact holder with the dimensions 25 x 25 mm2.
Light sources based on non-linear optics
0 1 2 3 4
0 100 200 300 400 500 600
488 nm output power Pout / mW
976 nm power PMOPA / W
Figure 10: Optical output power Pout at 488 nm ver- sus PMOPA at 976 nm.
Beside the direct application, diode lasers are also interesting as pump sources for non- linear processes. Using RW-DFB lasers as light sources the SHG in bulk material [13]
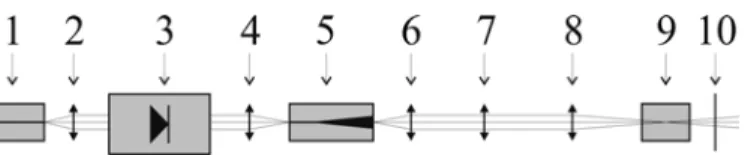
or wave-guide crystals [14] is known. The output power in these applications is limited Figure 9: Setup of the SHG-experiment:
1) 976 nm DFB-RW laser, Pseed = 40 mW; 2) Lens L1;
3) Optical isolator; 4) Lens L2; 5) Tapered amplifier – 4 mm long; 6) Lens L3; 7) Lens L4;
8) Lens L5; 9) PPMgLN bulk crystal;10) Short pass filter.
to about 100 mW. Higher output power can be reached by using high power MOPA- systems for the excitation and of periodically poled material (e.g. lithium niobate) for the frequency conversion.
The single-path-set-up used in our experiment is shown in Figure 9. At a temperature of 10°C the 976 nm MOPA reached output power of about 3.6 W. This light was focussed into the periodically poled MgO:LiNbO3 (PPMgLN) crystal. The dependence of the 488 nm output power from the 976 nm pump power is shown in Figure 10. At a pump power of 4 W a maximum output power of 600 mW at 488 nm was achieved with a con- version efficiency of 15 % and an overall wall-plug efficiency of 4 %. This is to the best of our knowledge the highest output power obtained with a single path SHG in a bulk material using a diode laser as excitation source [15]. The reached output power would allow to replace an Argon-ion laser by this laser.
Beside the spectroscopic application in the VIS- and NIR-range, also measurements in the mid-infrared region, where the majority of substances have characteristic spectro- scopic features are interesting. Unfortunately, semiconductor lasers (lead salt lasers, quantum cascade lasers) often require cryogenic cooling. Therefore the use of differ- ence frequency generation using VIS- or NIR-diode lasers as pump sources is also a promising approach.
The setup of an all diode laser pumped DFG-system for the monitoring of carbon mon- oxide at 4.7 µm is shown in Figure 11. An 810 nm diode laser with 150 mW output power and a 690 nm diode laser with 30 mW was combined by a dichroitic beam com- biner and focussed into a 4 cm long AgGaS2 crystal [16]. This system was used for the detection of carbon monoxide at ppb-level [17]. A result for such a measurement is given in Figure 12.