RECENT DEVELOPMENTS AT THE DELTA THz BEAMLINE
∗P. Ungelenk
†,
M. Bakr, M. H¨oner, H. Huck, S. Khan, R. Molo, A. Nowaczyk, A. Schick, M. Zeinalzadeh Center for Synchrotron Radiation (DELTA), TU Dortmund University, 44227 Dortmund, Germany
Abstract
During 2011, a dedicated THz beamline has been con- structed and commissioned at DELTA, a 1.5-GeV syn- chrotron light source operated by the TU Dortmund Uni- versity. This beamline enables extracting and detecting co- herent THz pulses caused by a laser-induced density mod- ulation of the electron bunches. Apart from using THz radiation as a diagnostics tool, ongoing experiments aim at characterizing the radiation as well as investigating the evolution of the density modulation over subsequent revo- lutions following the initial laser-electron interaction in an undulator.
INTRODUCTION
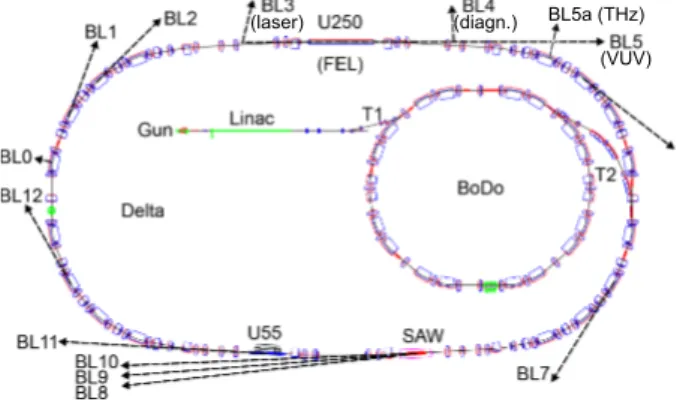
The 1.5-GeV synchrotron light source DELTA (Fig. 1) operated by the TU Dortmund University provides a beam current of up to 130 mA in multibunch mode or typically 15 mA in single-bunch mode at a revolution frequency of 2.6 MHz.
(laser) (diagn.) BL5a (THz)
(VUV)
Figure 1: Sketch of the DELTA facility including the laser beamline (BL3), diagnostics beamline (BL4), VUV beam- line (BL5), and THz beamline (BL5a).
The New Short Pulse Facility
A source for ultrashort VUV and THz pulses based on the Coherent Harmonic Generation (CHG) principle has been commissioned during 2011 [1, 2, 3]. Pulses with a duration of 40 fs from a Ti:sapphire laser (BL3, Fig. 1) co- propagate with the electron bunches in the modulator (first part of the undulator U250), which leads to an energy mod- ulation in a short slice of the bunches. A dispersive section
∗Work supported by DFG (212/236-1 FUGG), BMBF (05K10PEB), and by the Federal State NRW
†peter.ungelenk@tu-dortmund.de
(center part of the U250) transforms the energy modula- tion into a sequence of microbunches, which emit coherent radiation at harmonics of the original laser wavelength in the radiator (last part of the U250). The CHG radiation is extracted by the diagnostics beamline (BL4) or the VUV beamline (BL5). Due to path length differences in the fol- lowing dipole magnets, a sub-picosecond dip in the longi- tudinal electron density is formed. Based on previous expe- rience at BESSY [4], a THz beamline (BL5a) has been con- structed in order to extract and detect coherent THz pulses caused by this density modulation [5].
The THz Beamline
After a total longitudinal dispersion ofR56 = 5.75mm downstream of the U250 section, a modified dipole cham- ber allows the extraction of a circular THz beam profile with an opening angle of 33 mrad.
The THz radiation is first reflected by a water-cooled and gold-coated plane copper mirror and then guided and fo- cused by six toroidal aluminium mirrors (M1 - M6). Each pair of focusing mirrors forms a Gaussian telescope (sum of focal lengths equals the distance between the mirrors), providing wavelength-independent focusing. Near the fo- cal point between M1 and M2, a z-cut quartz window sep- arates the beamline vacuum from the ultrahigh vacuum in- side the storage ring. The beamline tubing is coated with aluminium foam to suppress pulse lengthening due to mul- tiple reflections.
The detector is a liquid-helium-cooled hot-electron bolometer comprising an indium antimonide detector chip with a response time of 0.3 µs and a spectral responsiv- ity reaching from 60 to 500 GHz (2 to 15 cm−1). The preamplifier provides an intensity-proportional voltage and a bandwidth of 1 MHz. The signal is recorded by a 1-GHz oscilloscope and can be fed into the EPICS control system.
EXPERIMENTAL RESULTS Longitudinal Electron Bunch Profiles
The coherent THz radiation intensity is proportional to the number of laser-affected electrons squared. As the laser pulses are short in comparison to the bunch length of about 100 ps, the THz signal can be used to record longitudi- nal bunch profiles by shifting the timing between storage ring RF and laser trigger. Measurements performed with a longitudinal bunch-by-bunch feedback system [6] show no significant jitter of the bunch timing, indicating that such profiles provide the real bunch length.
MOPPP091 Proceedings of IPAC2012, New Orleans, Louisiana, USA
ISBN 978-3-95450-115-1 768
Copyrightc○2012byIEEE–ccCreativeCommonsAttribution3.0(CCBY3.0)—ccCreativeCommonsAttribution3.0(CCBY3.0)
02 Synchrotron Light Sources and FELs T26 Photon Beam Lines and Components
(a)
(b)
(d) 0.0 (c)
0.2 0.4 0.6
THz signal [a.u.] measured
double Gaussian fit
0.0 0.2 0.4 0.6
−150 −100 −50 0 50 100
THz signal [a.u.]
delay [ps]
measured Gaussian fit
100 120 140
bunch length [ps]
measured x−1/4fit
0 25 50 75 100
12 15 18 21 24 27
delay [ps]
cavity power [kW]
measured
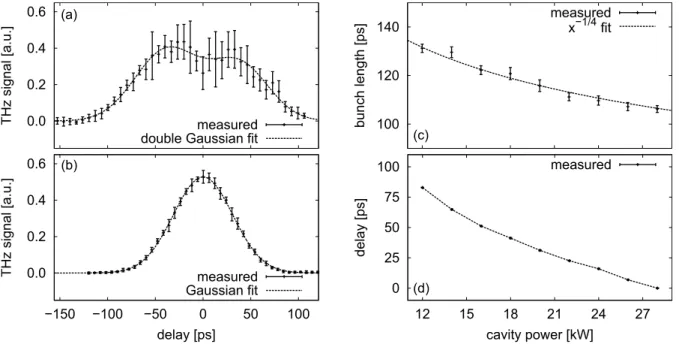
Figure 2: THz signal versus delay between the laser pulses and the electron bunch (a) with and (b) without an RF phase modulation. The square root of the THz signal is directly proportional to the longitudinal electron density. The dependence of the bunch length (c) and the synchronous phase (d), here in time units, on the RF power is studied using such profile measurements.
During standard user operation with multiple bunches, a phase modulation is applied to the RF generator in order to reduce multibunch instabilities and to increase the beam lifetime. This leads to the time-averaged bunch profile shown in Fig. 2 (a) with a total half-width of(221.9±19.8) ps. During CHG operation (single bunch), the RF phase modulation is switched off to maximize the peak current, resulting in a Gaussian beam profile (b) with a total bunch length of(103.6±0.7)ps (FWHM).
Using bunch parameters gained from such longitudinal profiles, the dependence of the bunch length on the RF powerPRFwas studied. In accordance with expectations, a decrease∝1/√4
PRFwas observed (Fig. 2 c). As the elec- trons’ energy loss per revolution stays constant, the syn- chronous phase angle changes under variation of the RF power (d).
Similar measurements at different single-bunch currents up to 15 mA and constant RF power (standard setting of 25 kW) have revealed that the bunch length stays slightly above 100 ps (FWHM); bunch lengthening due to potential-well distortion or turbulent bunch lengthening does not occur. This is consistent with the absence of a microbunching instability leading to spontaneous coherent THz bursts, which has been observed elsewhere [7].
Transverse Electron Bunch Profiles
By transversely displacing the laser pulses using a mirror in BL3, the transverse electron distribution can be studied.
As laser pulses and electron bunches both have a width of several hundred micrometers, the THz signal corresponds to the squared convolution of both profiles.
0 2 4 6 8 10
-80 -40 0 40 80
THz signal [mV/mA2 ]
mirror angle [µrad]
measured Gaussian fit
Figure 3: THz signal versus horizontal angle of a mirror in the laser beamline (BL3). The square root of the THz signal is proportional to the convolution of the horizontal electron bunch and laser pulse profiles.
Such a measurement is shown in Fig. 3, leading to a con- volution width of(899±13)µm (FWHM). The deviation from a calculated width of2√
2 ln 2p
β+w2L= 1015µm (FWHM) may be explained by inaccuracies in mirror cal- ibration and measurement of the laser waistwLas well as uncertainties in the knowledge of the beam emittanceand the assumed beta functionβat the modulator.
Other Measurements
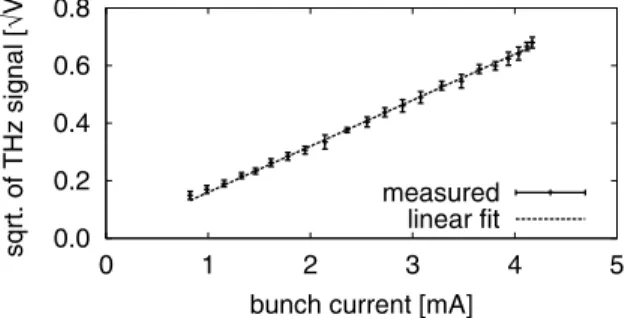
Figure 4 shows the linear dependence of the square root of the THz signal on the bunch current, which is expected for a coherent radiation mechanism. The current was re- duced using a horizontal scraper. For bunch currents well below 1 mA, the THz signal cannot be distinguished from the detector noise.
Proceedings of IPAC2012, New Orleans, Louisiana, USA MOPPP091
02 Synchrotron Light Sources and FELs T26 Photon Beam Lines and Components
ISBN 978-3-95450-115-1 769 Copyrightc○2012byIEEE–ccCreativeCommonsAttribution3.0(CCBY3.0)—ccCreativeCommonsAttribution3.0(CCBY3.0)
0.0 0.2 0.4 0.6 0.8
0 1 2 3 4 5
sqrt. of THz signal [√V]
bunch current [mA]
measured linear fit
Figure 4: Square root of the THz signal versus single- bunch current.
By rotating the laser polarization axis using a half-wave plate, the electrical field component which causes the en- ergy modulation in a planar undulator can be reduced. A linear dependence of the THz signal on the effective laser pulse energy has been observed (Fig. 5).
0.0 1.0 2.0 3.0
0.0 1.0 2.0 3.0
THz signal [mV/mA2 ]
pulse energy [mJ]
measured linear fit
Figure 5: THz signal versus laser pulse energy.
When the laser pulse length was increased by changing the settings of the compressor following the laser amplifier, an increase of the THz signal was observed. This can be explained by an increase in the number of laser-affected electrons in combination with a shift of the THz spectrum (about 0.2 to 8 THz at 40 fs) to lower frequencies, at which the bolometer is more sensitive.
Bolometer Saturation Effects
Figure 6 (a) shows typical oscilloscope traces of laser- induced THz signals from the bolometer’s preamplifier for different signal intensities. The shape is determined by the 1-MHz bandwidth of the preamplifier and the decreasing THz signal intensity from subsequent storage ring revolu- tions (384 ns revolution time) after the initial laser interac- tion.
At higher signal intensities (e.g. at higher beam currents or more laser power) this behavior changes (Fig. 6 b). The different traces have a constant rising edge steepness, while the maximum is shifted to later times. At even higher in- tensities, the signal is cut off by preamplifier saturation (not shown).
Due to the limited temporal resolution of the bolome- ter, more detailed conclusions on the signal evolution over subsequent storage ring revolutions have to be postponed.
(a)
(b) 0.00 0.10 0.20
THz signal [V]
0.00 1.00 2.00
0.0 0.5 1.0 1.5 2.0 2.5
THz signal [V]
time [µs]
Figure 6: Oscilloscope traces of laser-induced THz signals with moderate amplitude (a). The different traces were recorded by reducing the spacial overlap between laser pulses and electron bunch. At THz signals with higher am- plitude, a saturation effect in terms of a constant rising edge steepness is visible (b).
OUTLOOK
An FT-IR spectrometer for spectral characterization of the THz radiation and pulse shape investigations has been ordered and will be installed later in 2012. It is planned to establish a user facility for time-resolved FT-IR spec- troscopy by sending a fraction of the seed laser pulse di- rectly to the experiment (pump pulse) and probing the sam- ple with a delayed THz pulse (pump-probe experiments).
More detailed theoretical and experimental analyses of the THz radiation mechanism are intended, especially re- garding the evolution of the electron density modulation over several revolutions in the storage ring, using a faster hot-electron bolometer, e.g. [8].
ACKNOWLEDGMENT
It is a pleasure to thank our colleagues at DELTA and the Faculty of Physics for their continuous support. The advice from Karsten Holldack at BESSY/HZB regarding the design, construction, and commissioning of the THz beamline is gratefully acknowledged. Furthermore, the project has profited from the expertise of our colleagues at MLS/PTB, DESY, ANKA/KIT, and SLS/PSI.
REFERENCES
[1] H. Huck et al., Proc. FEL’11, Shanghai, MOOA5 (2011).
[2] S. Khan et al., Sync. Rad. News 24, No. 5, 18-23 (2011).
[3] A. Schick et al., this conference (TUPPP008).
[4] K. Holldack et al., Phys. Rev. Lett. 96, 054801 (2006).
[5] M. H¨oner et al., Proc. IPAC’11, San Sebasti´an (2011), 2939.
[6] M. H¨oner et al., this conference (MOPPR015).
[7] J. M. Byrd et al., Phys. Rev. Lett. 89, 224801 (2002).
[8] A. D. Semenov et al., Proc. IRMMW-THz 2009, 5324688.
MOPPP091 Proceedings of IPAC2012, New Orleans, Louisiana, USA
ISBN 978-3-95450-115-1 770
Copyrightc○2012byIEEE–ccCreativeCommonsAttribution3.0(CCBY3.0)—ccCreativeCommonsAttribution3.0(CCBY3.0)
02 Synchrotron Light Sources and FELs T26 Photon Beam Lines and Components