Long-term management effects on soil organic matter in two cold, high-elevation grasslands: clues from
fractionation and radiocarbon dating
J. L EIFELD & J. F UHRER
Agroscope Reckenholz-Ta¨nikon ART, Air Pollution/Climate Group, Reckenholzstrasse 191, 8046 Zu¨rich, Switzerland
Summary
Grassland covers large areas at the treeline of the Alps, but management effects on the amount, distribu- tion and turnover of soil organic matter (SOM) in this region are largely unknown. Our aim was to elucidate such effects for two management types using soil fractionation in combination with radiocarbon dating. Two Swiss grasslands sites at approximately 2020 m elevation (MAT þ2.2°C, MAP 1050 mm) were used, which were hay meadows until 60 years ago when one was changed to grazed pasture. The sites are located in close vicinity to each other and have similar climate and parent material. Soils at each site were shallow (maximum 20 cm) and had high stone contents and thus a limited carbon (C) storage capacity. Total soil organic carbon (SOC) stocks in the two soils were similar (6.11 0.69 and 6.07 0.91 kg C m
2, respectively), as were proportions of readily available SOC and Q
10values mea- sured by means of respiration in the laboratory. Grazing caused lower soil nutrient contents and slight soil compaction. Carbon in labile fractions and its radiocarbon age were particularly useful to distin- guish management effects. Significantly more SOC was located in the pasture topsoil (0–4 cm) with a higher share of particulate organic C. Particulate and microaggregate-associated C was slightly youn- ger under pasture, indicating incorporation of recent plant tissue by cattle. At both sites,
14C-derived mean residence times of SOC increased in the order particulate < micro-aggregate < silt and clay-associated matter and were greater below 4 cm than in the topsoil. Age differences in old silt and clay C could not be attributed entirely to management effects. We discuss pitfalls for turnover estimates of bulk soils introduced by choosing non-unique fractions. Together, the data suggest that a change from haying to cattle grazing may cause a strong decoupling of microbial processes within the soil’s architecture and that in such ecosystems SOM under pastures may be more vulnerable to environmental disturbances.
Introduction
Grassland soils are among the most important terrestrial organic carbon (OC) pools, contributing approximately 20%
to the total terrestrial soil organic carbon (SOC) stock (Jobbagy & Jackson, 2000). Because of climatic and topographic constraints, grassland is the preferred and often only operable form of agriculture at high elevations and low mean annual temperatures. SOC contents under grasslands increase with elevation in tropical to subtropical regions (Townsend et al., 1995), in cold to warm temperate regions (Tate, 1992) and in the Alps (Jacot et al., 2000). At the same time, net primary production is typically much smaller in the Alps than in temperate grasslands (Walther et al., 2001),
suggesting that SOC turnover rates must be retarded at high elevations. Changes in the composition and allocation of the input material and unfavourable conditions for plant residue decomposition because of low temperatures or nutrient limitation are most likely to be the cause of this pattern. For example, rates of turnover and vertical movement of soil nitrogen (N) have been shown to be small in alpine grasslands and after 27 years, 45% of applied fertilizer N was still observed over the whole soil profile (Gerzabek et al., 2004). Hitz et al. (2001) reported an increasing contribution of roots to the total carbon (C) and N input into alpine soils and decreasing root turnover times with elevation, the latter reaching values of up to 12 years at 2.2°C mean annual temperature. Together, these data lend support to the hypo- thesis that turnover times of both C and N in high-elevation grasslands are similarly affected by site conditions and those Correspondence: J. Leifeld. E-mail: jens.leifeld@art.admin.ch
Received 20 November 2007; revised version accepted 23 October 2008
European Journal of Soil Science, April 2009, 60, 230–239 doi: 10.1111/j.1365-2389.2008.01111.x
European Journal of Soil Science
grasslands below (i.e. sub-alpine) or above (i.e. alpine) the timberline are typically characterized by slow process rates and element fluxes. Because of their high SOC concen- trations, which may be depleted through environmental disturbance such as warming, mountain grassland and cold region soils are alleged to be particularly important sources for CO
2emissions to the atmosphere (Baritz et al., 2004). To test this hypothesis, however, a better understanding of the controls over SOC dynamics such as management is needed for mountain grasslands. For example, available soil volume may limit SOC storage at high altitudes (Leifeld et al., 2005), thereby potentially challenging the role of these soils as high priority C stores.
Management is a major driver for soil organic matter (SOM) dynamics in mountainous grasslands (Sebastia` et al., 2008), but its effect on both storage and turnover of SOC has been scarcely addressed for sites at higher elevations.
For the European Alps, grassland management is of particu- lar interest, because it concerns large areas. In Switzerland, around 540 000 ha agricultural areas are located in the Swiss Jura mountains and in the Alps and are used as meadows and pastures. More than 80% of this area is extensively grazed, and the remainder is traditionally used for hay.
Grazing has been shown to affect the amount of soil C. In the central Alps, heavy grazing caused an increase in SOC content relative to light grazing and haying (Seeber &
Seeber, 2005). A higher SOC content in the topsoil of grazed compared with ungrazed grasslands has been shown for other climatic regions before (Franzluebbers et al., 2000), and soil incorporation of plant materials has been suggested as one possible mechanism (Manley et al., 1995; Schuman et al., 2001). Also in hayed mountainous grasslands, man- agement intensity (i.e. cutting frequency and fertilization) affects the SOC although no univocal relationship between management intensity and SOC storage could be shown (Zeller et al., 1997, 2000).
For any management, a better mechanistic understanding of processes requires the calculation not only of C stocks but of process rates; to our knowledge no study compares long-term effects of haying vs. grazing on the distribution and turnover of SOM in mountain grasslands. Because of the large time scales of adaptation of SOM to management in sub-alpine and alpine regions because of unfavourable environmental conditions and small reaction rates, understanding of management effects depends on long-term experiments. Here, we report results for soil C content, its distribution among soil fractions and its mean residence times for two sub-alpine grasslands. These grasslands are close to the treeline and were both used as a hay meadow until 60 years ago and have been managed since then either as a hay meadow or a cattle pasture. The fields were selected to represent a classical paired plot design where two sites with similar starting conditions developed in different ways over time with one representing the control experiment and any difference between sites could then be attributed to a single factor,
management in our case. Our goal was to test this assumption and to use these treatments to improve our understanding of soil management as a driver for changes in SOC stocks and turnover in high elevation grasslands.
Material and methods Sites and sampling
The two grasslands are located at Alp Flix (46°30¢60²N, 9°39¢56²E), canton of Grisons, Switzerland, at elevations of 2020 and 2045 m, aspect 250° and 225° and slopes of 35–40%
for the meadow and pasture site, respectively, with a distance of approximately 2 km from each other. Soils at both sites are Lep- tosols developed on serpentine rock with loamy to clayey-loamy texture. Mean annual temperature is þ2.2°C, and mean annual rainfall 1050 mm. Deforestation at Alp Flix occurred after 1350, and the timberline at that time was at approximately 2300 m above sea level (asl). The hay meadow is cut once per year in autumn. The cattle manure off-site derived from this material, c. 0.05 t C ha
1a
1, is returned to the same field. After the cut, the meadow is regularly grazed in autumn for short periods by sheep and occasionally by cattle. This type of land-use at this site has been practised for at least 100 years. At the other site, dairy cows graze the pasture daily from mid June to mid September. Cows are milked two times per day in the nearby valley and are kept in the barn overnight. Manure produced off-site is not returned to the pasture but applied elsewhere. The current management was established around 60 years ago, and the site was used as a hay meadow with regular manure applica- tion and autumn grazing by sheep prior to that. Mineral fertilisers are not applied to either of the two grasslands.
Eight replicated soil samples were taken in October 2004 along the contour line (2020 and 2045 m above sea level, respec- tively, see above) at each site, at a spacing of approximately 10 m. Intact soil cores (40 mm height, 100 cm
3volume) were incrementally taken down to the maximum soil depth of 16 cm under pasture and 16–20 cm under meadow. For both sites, the depth below 4 cm is hereafter referred to as > 4 cm. Basic soil attributes (texture, pH, extractable nutrients) were mea- sured in additional samples (0–10 cm) taken separately at each site (n ¼ 8).
Analytical methods
Roots were removed by hand from all samples prior to further chemical analysis. From the cored samples, elemental C and N were analysed in ground, air-dried material by dry combustion in an elemental analyser (Hekatech, Wegberg, Germany). Sam- ples were free of carbonate and total C equals OC. SOC stocks per unit soil volume were calculated after subtracting the stone volume of each sample assuming a stone density of 2.65 g cm
3and calculating the bulk density of the fine earth < 2 mm.
From the 0–10 cm samples, nutrients (P, K, Mg, Ca) were
measured after extraction with 1:10 soil to NH
4þ-acetate mix- ture (FAL, 1998), and pH in soil suspensions after shaking in 0.01 M CaCl
2. From the same samples, soil texture was deter- mined by the pipette method after OC removal by H
2O
2. Soil respiration of intact soil cores was measured in a temperature- controlled incubation chamber at 25 and 15°C for samples 0–4 and 4–8 cm after adjusting them for 7 days to a water tension of 100 hPa. Details of the incubation technique are given in Leifeld & Fuhrer (2005). The volume of macropores were calculated as the difference in water volume between saturated and drained soil cores.
Prior to fractionation, cored samples were air dried, sieved
< 2 mm and the material of 16 (n ¼ 2 8) samples from 0–4 and 16 (2 8) samples > 4 cm was suspended in water and physically fractionated following the method of Zimmermann et al. (2007a). Weak ultrasonic treatment with 22 J ml
1was used with subsequent density separation in Na-polytungstate at d ¼ 1.8 g cm
3. With this procedure, we obtained (i) a light particulate organic carbon fraction (POC) 63–2000 mm, (ii) a sand-sized microaggregate fraction consisting of particulate C occluded in micro-aggregates and primary silt and clay par- ticles (MA-C) 63–2000 mm, and (iii) silt þ clay-sized material smaller than 63 mm (s þ c). The latter material was treated with NaOCl according to Zimmermann et al. (2007b) to iso- late (iv) a chemically stable and old fraction, which is assumed to be independent of management.
Radiocarbon measurements and calculation of mean residence times
The
14C content of bulk soils and of the two sand-sized physi- cal fractions each from two depths (0–4 cm and the composite increment > 4 cm) was measured at the AMS facility of the Institute for Particle Physics of the Swiss Federal Institute of Technology, Zurich. All
14C measurements refer to composite samples of each site from bulk soils and fractions. Radiocar- bon activity of the clay þ silt fraction was calculated by differ- ence. Spiking the atmosphere with
14C from testing nuclear weapons during the late 1950s and early 1960s (‘bomb
14C’) has introduced an artificial radiocarbon label to the biosphere that can be used to calculate SOC turnover (e.g. Harkness et al., 1986; Trumbore, 2000). The advantage of using bomb
14
C is its ubiquity, which makes turnover calculations largely independent of directed labelling experiments or studies rely- ing on changes of vegetation with different photosynthetic pathways and thus isotopic signatures of the plant residues (C3-C4). Bomb
14C turnover calculations are relatively straightforward under steady-state assumptions (i.e. when car- bon inputs equal outputs of the soil system over the long-term and when annually fixed carbon has the same signature as the atmosphere of the same year). The bomb
14C model from Harkness et al. (1986) was used to calculate mean residence times (MRTs) of the respective fractions. Based on that approach, the
14C activity of the SOC can be expressed as
A t ¼ A ðt1Þ e k þ ð1 e k ÞA i A ðt1Þ l; ð1Þ
where A
(t)is the
14C activity of SOC at time t, A
(t1)the
14C activity of the previous year, A
ithe input
14C activity of the plant residue, k the exchange rate constant of the SOC pool and l the
14C decay constant (1/8268 a
1). The atmospheric
14
C activity, expressed as per cent modern carbon (pMC), was compiled using records from Stuiver et al. (1998) for the period 1511 to 1954, from Levin et al. (1994) for 1959 to 1983 (site
‘Vermunt’), and from Levin & Kromer (1997) for 1977 to 1997 (site ‘Schauinsland’). The period between 1954 and 1959 was linearly interpolated. The exponential decrease in
14C activity at ‘Schauinsland’ was used to extrapolate the declining trend from ‘Vermunt’ to the year 2010. The ‘Vermunt’ site was located at 1800 m elevation at 60 km distance from our sam- pling site. Because the
14C activities in the northern hemi- sphere vary considerably from site to site and because the shape of the bomb peak is of uppermost importance for reli- able turnover estimates (Bruun et al., 2005), the ‘Vermunt’
record was taken as the base for the atmospheric record used here.
SOC mean residence times were calculated according to Equa- tion (1) by iteratively varying the MRT until it matched the measured
14C activity of the sample. This was done separately for each of the three soil fractions (POC, MA-C, s þ c) at both depths. The flux F
fof carbon through POC, MA-C and s þ c fractions at each depth [t C ha
1a
1] was calculated as
F f ¼ 1=MRT fraction poolsize fraction ; ð2Þ yielding the total flux F
tthrough the whole soil
F t ¼ +F fi ; ð3Þ
and the corresponding MRT [a] for SOC 0–20 (pasture: 0–16) cm MRT SOC ¼ SOC 020 =F t : ð4Þ
Hitz et al. (2001) described MRTs of leaves and roots of c. 5 years for subalpine and alpine grasslands in Grisons, Swit- zerland. Thus, residues entering the soil have a radiocarbon signature corresponding to those of the atmosphere 5 years before. We used this period of 5 years as a standard time-lag for the
14C label of the material entering all SOC-fractions.
Though a longer time-lag is likely for the s þ c-fraction, pre- vious sensitivity analysis indicated that the calculated MRT of this fraction was hardly affected by choosing different time-lags because this fraction contains only traces of bomb-derived C.
It has been recognized before that radiocarbon turnover models based on the bomb peak often do not allow assignment of a single turnover time but of two different values (e.g.
Bruun et al., 2004). We therefore explicitly assumed MRTs to
decrease in the order POM < S þ A < s þ c, and 0–4 < 4–16
for every single fraction. This assumption seems justified given
the younger age of (i) light versus dense material and (ii) surface
versus deeper horizons reported by others (Gaudinski et al., 2000; Trumbore, 2000; Baisden et al., 2002).
The physical fractionation used here is based on previous experience of functionally and chemically different fractions (Zimmermann et al., 2007a,c). We compared this estimate with computations where MRTs of bulk soils were not derived from all six radiocarbon data available per site, but from other possible combinations of our dated fractions and bulk soils under consideration of the C and
14C mass balance. For exam- ple, the MRT of a bulk soil can be calculated by using Equa- tion (1) when only the radiocarbon content of one bulk soil sample is available or for a combination of values from POC fractions and a combined S þ A and s þ c fraction. For any possible combination, the resulting apparent MRT of the bulk SOC will be different. It has been shown that MRT calcu- lations based only on bulk soil measurements are very biased relative to those relying on a combination of sub-fractions (Trumbore, 2000); however, there is no consensus on how many or which particular fractions are most feasible to obtain a reliable estimate of MRT.
Statistics
Groups were distinguished by management and depth and tested for normality and homogeneity of variances. Because the latter was not fulfilled for all of the observed variables, differences between management types were analysed for the particular depth by the Mann–Whitney U-test. Any indication of statisti- cal significance in the text refers to the results of that test and values following the sign in the text are 95% confidence intervals of the mean.
Results
The two grassland soils revealed some differences in soil physical and chemical attributes (Table 1). Soil under pasture contained more silt and less sand than the meadow soil. For most chemical soil attributes, differences between land-use types were signifi- cant (P < 0.05) apart from pH and Mg contents. However, the nutrient supply for each element was in the same class of the
five-step nutrient classification scheme applied in Swiss agri- culture (Walther et al., 2001). According to this agronomic evaluation, the supply was marginal for P, but sufficient to high for K and Mg.
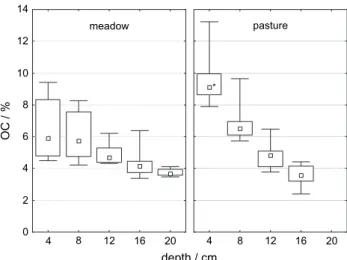
Concentrations and total contents of SOC were greater under pasture than under meadow in the upper layers (Figures 1, 2).
Below 8 cm, SOC was not significantly different between sites.
The pattern for total N was similar (not shown). Cumulated over the upper 16 cm, SOC contents were not significantly different between pasture (6.11 0.69) and meadow (5.51 0.80 kg C m
2; 6.07 0.91 kg C m
2at 0–20 cm depth). Mean SOC contents over the whole profiles were 6.3% (pasture) and 5.2%
(meadow). SOC concentrations and stocks under pasture decreased with depth at a greater rate than under meadow.
Stone contents were significantly greater in 0–4 cm and signifi- cantly smaller in 12–16 cm under meadow and reached a maxi- mum value of 26% for one single pasture sample. Bulk soil density of the fine earth (0.65 0.03 g cm
3) and C:N ratios (11.2 0.2) were not significantly affected by management.
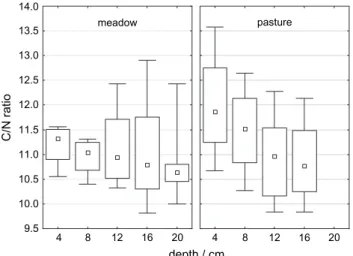
The latter decreased steadily under pasture while they were almost constant under meadow (Figure 3).
The proportions of C stored as POC in the sand fractions, or associated with micro-aggregates, MA-C, was in general greater under pasture (Table 2). Together, c. 50–60% of SOC was located in these two fractions. Below 4 cm, the fraction of POC was significantly smaller while MA-C slightly increased with depth at both sites. Particulate organic matter (POM) had significantly wider C:N ratios in the pasture subsoil.
Corresponding ratios for micro-aggregates were smaller than those of POM and were not affected by management.
Oxidative treatment of the s þ c fractions with NaOCl left
Table 1 Mean selected physical and chemical soil attributes of two sub- alpine sites (hay meadow and pasture) for the upper 10 cm (1 SD)
Meadow Pasture
pH (CaCl
2) 4.8 (0.6) 4.8 (0.3)
Clay/g g
10.26 (0.03) 0.29 (0.05)
Silt/g g
10.31 (0.01) 0.36 (0.04)
Sand/g g
10.43 (0.04) 0.35 (0.08)
P/mg kg
134 (12) 13 (10)
K/mg kg
1180 (86) 142 (81)
Mg/mg kg
1391 (194) 352 (209)
Ca/mg kg
13192 (1094) 1262 (642)
depth / cm
OC / %
4 8 12 16 20
0 2 4 6 8 10 12 14
4 8 12 16 20
pasture meadow
*
Figure 1 SOC concentrations at meadow (left) and pasture (right) sites for different depth increments. Box-whisker plots show medians, 25th and 75th quartile, and minimum and maximum values (bars).
Stars alongside box-whisker plots indicate significant differences
between land-use for the particular soil depth. Maximum soil depth is
20 and 16 cm for meadow and pasture sites, respectively.
a resistant fraction with a much wider C:N ratio than in the untreated fraction. This material accounted for approximately 1–2% in the top 4 cm and 6% below 4 cm depth of soil C.
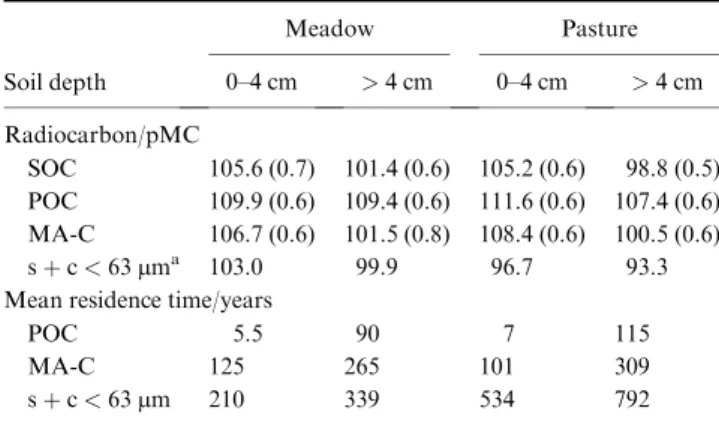
The radiocarbon activity increased in the order POC > MA- C > s þ c in both grasslands (Table 3). Carbon in sand-sized fractions in the topsoil of the pasture had a greater
14C activity than under meadow, while activities of bulk SOC were similar.
Organic C in the fraction < 63 mm under pasture contained less
14C than under meadow. Mean residence times of the three fractions increased in inverse order to radiocarbon
activities (Table 3) and ranged from c. 10 years (POC topsoil) to several centuries (s þ c). Under steady-state conditions, the combined turnover estimate of all fractions translates into a MRT of 92 and 66 years for meadow and pasture, respec- tively, assuming steady-state conditions. The corresponding C inputs necessary to maintain the current SOC level are 0.66 and 0.92 t C ha
1a
1for meadow and pasture, respectively.
Mean residence times were not only computed from all six dates per site, but also for combinations of radiocarbon data from fractions and bulk soils. For each site, 10 different MRTs as derived from these combinations (i.e. No. 1 to No. 10) are displayed in Figure 4. At both sites, the estimates can roughly be split into two groups with short (No. 1–6) and long (No. 7–10) MRTs. Short MRTs are always associated with POC 0–4 cm plus some other fractions in different combinations while long MRTs never include fractions of the upper 4 cm but only those of the bulk soil 0–4 cm. Point No. 1 refers to the estimate using all six (3 fractions 2 depths) radiocarbon data per site as described above.
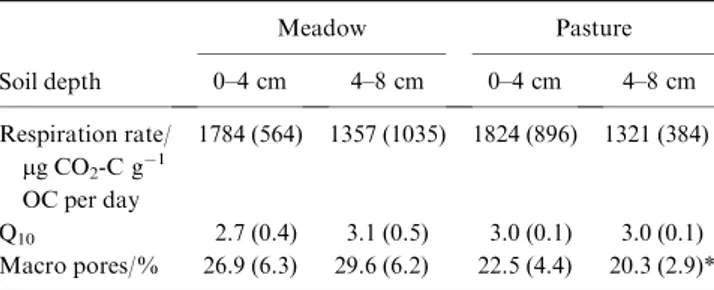
Specific respiration rates, corresponding Q
10values and macro pore volume of intact soil cores incubated at 25°C are shown in Table 4. Replicates of respiration measurement were highly vari- able and were neither significantly affected by site nor by depth.
For both sites, soils from 4–8 cm respired on average less CO
2per unit SOC than those from 0–4 cm. The temperature sensitivity, expressed as Q
10values of this incubation, was not significantly different between site or depth, but was negatively correlated to the specific respiration rate at 25°C (r ¼ 0.81, P < 0.05;
depth / cm
SOC / kg m
-24 8 12 16 20
0.4 0.6 0.8 1.0 1.2 1.4 1.6 1.8 2.0 2.2 2.4 2.6
4 8 12 16 20
pasture meadow
*
*
Figure 2 SOC stocks at meadow (left) and pasture (right) sites for different depth increments. Box-whisker plots show medians, 25th and 75th quartile, and minimum and maximum values (bars). Stars alongside box-whisker plots indicate significant differences between land-use for the particular soil depth. Maximum soil depth is 20 and 16 cm for meadow and pasture sites, respectively.
depth / cm
C/N ratio
4 8 12 16 20
9.5 10.0 10.5 11.0 11.5 12.0 12.5 13.0 13.5 14.0
4 8 12 16 20
pasture meadow
Figure 3 C-to-N ratios under meadow (left) and pasture (right) sites for different depth increments. Box-whisker plots show medians, 25th and 75th quartile, and minimum and maximum values (bars). Maxi- mum soil depth is 20 and 16 cm for meadow and pasture sites, respectively.
Table 2 Proportions of particulate organic carbon (POC), microaggre- gate-associated carbon (MA-C), silt þ clay associated carbon and cor- responding C:N ratios of particulate organic matter (POM), microaggregates (MA) and silt þ clay (s þ c) carbon in the soils under hay meadow and pasture. Values in parentheses are 95% confidence intervals of the mean. Asterisks indicate significant differences (U-test) between management for depth increments
Soil depth
Meadow Pasture
0–4 cm > 4 cm 0–4 cm > 4 cm POC/% of SOC 15.4 (4.0) 8.0 (2.2) 23.7 (8.8)* 11.8 (2.6)*
MA-C/% of SOC 41.3 (8.6) 44.3 (16.0) 42.4 (7.3) 53.2 (12.6) s þ c < 63 mm/%
of SOC
43.3 (6.6) 47.7 (10.2) 33.9 (5.1) 35.0 (7.1)
NaOCl residue from fraction s þ c < 63 mm
(a)/%
of SOC
a1.9 5.6 0.7 6.1
C:N ratio POM 17.7 (1.5) 19.5 (1.1) 17.0 (1.6) 22.0 (1.7)*
C:N ratio MA 9.9 (0.3) 10.2 (0.8) 10.5 (0.5) 10.5 (0.6) C:N ratio s þ c < 63 mm 10.5 (1.1) 11.0 (3.7) 10.7 (1.1) 9.4 (2.8) C:N ratio NaOCl
residue from fraction s þ c < 63 mm
a22.2 19.8 17.5 20.4
a
Composite sample only.
Pearson’). Macro pore volume was smaller under pasture than under meadow and this difference was significant at 4–8 cm.
Discussion
The two grasslands developed on the same parent material and were exposed to similar environmental conditions regarding land-use, elevation, aspect and slope. However, they differ in some physical and chemical soil attributes. Soils at both sites contain large amounts of Mg and Ca because of the high con- centration of these metals in the parent material. There is also a good supply of K and we therefore exclude nutrient limitation of these elements as a possible cause for the accumulation of SOC in both grasslands. In contrast, the contents of extractable P were small, in particular at the pasture site. Smaller contents of P, Mg and Ca under pasture may be ascribed to a net element export because cattle are often kept in the barn overnight and the manure is not returned to the grazed site. Sundriyal & Joshi (1992) reported similar observations for nutrient budgets in alpine pastures of Tibet.
The two grasslands that were under continuous different man- agement for over 60 years but similarly managed previously revealed systematic differences in the partitioning and stability of SOM although the total C content was similar. However, assigning these differences to management effects only may be ambiguous. In a previous study, we calculated C stocks in Swiss agricultural soils and analysed important factors that determine their size (Leifeld et al., 2005). We found a significant increase in SOC contents with elevation for permanent grasslands, but could not distinguish between hay and grazed treatments and did not include any data from Alp Flix. With that approach, we predicted SOC (0–20 cm) at Alp Flix of 6.4 (0.5) % or 4.7 ( 0.65) kg m
2. Measured SOC values for pasture and meadow at Alp Flix were 6.3 and 5.2% or 6.1 and 5.5 kg m
2,
showing that SOC stocks at these two grasslands are slightly above the statistical distribution obtained from other moun- tainous regions in the Swiss Alps. The stone content at Alp Flix was smaller than typically found at this elevation and the higher available soil volume is likely to be one important cause of the higher C stock. Because clay and silt contents were greater in the pasture topsoil and affect SOC contents via physical and chemical stabilization mechanisms (e.g. Sollins et al., 1996; Hassink & Whitmore, 1997; Von Lu¨tzow et al., 2006), the observed higher pasture SOC content might be caused by direct binding onto mineral surfaces or enhanced micro-aggregation.
For both sites, cumulated amounts of SOC over the profile were similar, but contents and stocks were significantly greater in the top 4 cm of the pasture, and consequently, we found a more pronounced SOC gradient with depth for that system.
Because of two findings, we suggest that incorporation of plant materials by treading (Manley et al., 1995; Franzluebbers et al., 2000; Schuman et al., 2001) results in this pattern in the pas- ture. First, the proportion of POC was significantly greater in Table 3
14C activity (pMC) of SOC of bulk soils, particulate organic
carbon (POC), microaggregate-associated carbon (MA-C), and silt þ clay (s þ c) and calculated mean residence times for three soil frac- tions from the hay meadow and pasture site. Values in parenthesis indicate the AMS measurement error (1 SD)
Soil depth
Meadow Pasture
0–4 cm > 4 cm 0–4 cm > 4 cm Radiocarbon/pMC
SOC 105.6 (0.7) 101.4 (0.6) 105.2 (0.6) 98.8 (0.5) POC 109.9 (0.6) 109.4 (0.6) 111.6 (0.6) 107.4 (0.6) MA-C 106.7 (0.6) 101.5 (0.8) 108.4 (0.6) 100.5 (0.6) s þ c < 63 mm
a103.0 99.9 96.7 93.3 Mean residence time/years
POC 5.5 90 7 115
MA-C 125 265 101 309
s þ c < 63 mm 210 339 534 792
a