A P P L I E D E C O L O G Y
Spatial heterogeneity and environmental predictors of permafrost region soil organic carbon stocks
Umakant Mishra1*†, Gustaf Hugelius2, Eitan Shelef3, Yuanhe Yang4, Jens Strauss5,
Alexey Lupachev6, Jennifer W. Harden7,8, Julie D. Jastrow1, Chien-Lu Ping9, William J. Riley10, Edward A. G. Schuur11, Roser Matamala1, Matthias Siewert12, Lucas E. Nave13, Charles D. Koven10, Matthias Fuchs5, Juri Palmtag14, Peter Kuhry2, Claire C. Treat5, Sebastian Zubrzycki15,
Forrest M. Hoffman16,17, Bo Elberling18, Philip Camill19, Alexandra Veremeeva6, Andrew Orr1 Large stocks of soil organic carbon (SOC) have accumulated in the Northern Hemisphere permafrost region, but their current amounts and future fate remain uncertain. By analyzing dataset combining >2700 soil profiles with environmental variables in a geospatial framework, we generated spatially explicit estimates of permafrost-region SOC stocks, quantified spatial heterogeneity, and identified key environmental predictors. We estimated that Pg C are stored in the top 3 m of permafrost region soils. The greatest uncertainties occurred in circumpolar toe-slope positions and in flat areas of the Tibetan region. We found that soil wetness index and elevation are the dominant topographic controllers and surface air temperature (circumpolar region) and precipitation (Tibetan region) are significant climatic controllers of SOC stocks. Our results provide first high-resolution geospatial assessment of permafrost region SOC stocks and their relationships with environmental factors, which are crucial for modeling the response of permafrost affected soils to changing climate.
INTRODUCTION
Permafrost (where ground temperature is at or below 0°C for two or more consecutive years)–affected soils store large quantities of or- ganic carbon because of cold temperatures and multiple pedogenic processes, such as peat accumulation, cryoturbation, and accumu- lation of eolian, alluvial, colluvial, and lacustrine sediments (1–4).
Perennially frozen conditions, water-saturated environments, and low temperatures have reduced decomposition rates and preserved soil organic carbon (SOC) stocks in these ecosystems over long time periods. High-latitude areas, where most permafrost-affected soils are located, are projected to experience climate extremes causing greater temperature increases compared to other parts of the world (5). Similarly, large decreases in permafrost areas (22 to 64%) are projected in the Tibetan permafrost region under future climate warming scenarios (6). Because of these anticipated temperature increases and permafrost degradation, increased mineralization of SOC in permafrost-affected soils could release substantial amounts of greenhouse gases to the atmosphere over long periods of time (7).
Therefore, these soils are a key component of the global carbon cy- cle and play an important role in moderating global climate. Large uncertainty exists regarding potential modes (e.g., CH4 or CO2) and release rate of greenhouse gases from warming permafrost-affected soils, as well as their feedback on climate (7, 8).
Earlier studies have assessed the SOC stocks of permafrost-affected soils by using a variety of approaches. Ping et al. (9) estimated that 98 Pg C are stored in the top 1 m of soils in the North American Arctic region by upscaling soil profile observations with a circumpolar Arctic vegetation map. In the Northern Circumpolar Soil Carbon Database, Tarnocai et al. (10) linked soil profile data with regional maps of soil orders and estimated that 1024 Pg C exist to a depth of 3 m across the northern circumpolar permafrost region. Hugelius et al. (11) up- dated the circumpolar SOC stock estimate to 1035 ± 150 Pg C (95%
confidence interval) by incorporating data from additional pedons sampled to deeper depths. Their study reported substantial uncer- tainty in permafrost region SOC stock estimates and identified more SOC observations and improved upscaling methodology as critical needs for reducing that uncertainty. All these studies used the dis- crete model of spatial variation to represent the geographical distri- bution of SOC stocks. This approach relies on identifying geographic polygons based on thematic maps of vegetation or soil type distribu- tions, where SOC stocks are assumed homogenous in a given polygon but can differ among polygons (12). However, the spatial heteroge- neity of soil properties can be better represented by models that incor- porate multiple landscape and microclimatic variables to represent the spatial variation of soil properties. Recent advances in geo- spatial science and environmental data collection have increased the
1Environmental Science Division, Argonne National Laboratory, 9700 South Cass Avenue, Argonne, IL, USA. 2Department of Physical Geography and Quaternary Geology, Stockholm University, Stockholm, Sweden. 3Department of Geology and Environmental Science, University of Pittsburgh, Pittsburgh, PA, USA. 4State Key Laboratory of Vegetation and Environmental Change, Institute of Botany, Chinese Academy of Sciences, 100093 Beijing, China. 5Permafrost Research Section, Alfred Wegener Institute Helmholtz Centre for Polar and Marine Research, Potsdam, Germany. 6Institute of Physico-Chemical and Biological Problems in Soil Science, Russian Academy of Sciences, Puschchino, Russia. 7School of Earth, Energy and Environmental Sciences, Stanford University, Stanford, CA, USA. 8Institute of Arctic Biology, University of Alaska Fairbanks, P.O. Box 757000, Fairbanks, AK, USA. 9Palmer Research Center, University of Alaska Fairbanks, Palmer, AK, USA. 10Earth and Environmental Sciences, Lawrence Berkeley National Laboratory, Berkeley, CA, USA. 11Center for Ecosystem Science and Society, Northern Arizona University, Flagstaff, AZ, USA. 12Department of Ecology and Envi- ronmental Sciences, Umea University, Sweden. 13Biological Station, University of Michigan, Pellston, MI, USA. 14Department of Geography and Environment, Northumbria University, Newcastle upon Tyne, UK. 15Institute of Soil Science, Center for Earth System Research and Sustainability (CEN), Universität Hamburg, Hamburg, Germany.
16Climate Change Institute, Oak Ridge National Laboratory, Oak Ridge, TN, USA. 17Department of Civil and Environmental Engineering, University of Tennessee, 325 John D. Tickle Building, 851 Neyland Drive, Knoxville, TN, USA. 18CENPERM (Center for Permafrost), Department of Geosciences and Natural Resource Management, University of Copenhagen, Copenhagen, Denmark. 19Earth and Oceanographic Science Department and Environmental Studies Program, Bowdoin College, Brunswick, ME, USA.
*Present address: Computational Biology & Biophysics, Sandia National Laboratories, Livermore, CA, USA.
†Corresponding author. Email: umishra@sandia.gov
Copyright © 2021 The Authors, some rights reserved;
exclusive licensee American Association for the Advancement of Science. No claim to original U.S. Government Works. Distributed under a Creative Commons Attribution NonCommercial License 4.0 (CC BY-NC).
on February 24, 2021http://advances.sciencemag.org/Downloaded from
availability of high-resolution environmental datasets that can be related to soil-forming factors (13). These advances allow for more quantitative approaches to predicting the spatial heterogeneity of soil properties, including SOC stocks. These approaches can also quantify the relationships between soil properties and their envi- ronmental controllers, information that is critical for projecting soil responses to climate change and other perturbations. Furthermore, these approaches can be used to estimate the spatial variation of pre- diction uncertainties (14) and to identify and prioritize locations where additional observations are needed (15).
Several geospatial approaches have been used to evaluate the spatial heterogeneity of SOC stocks depending on the availability of SOC data and information regarding soil-forming factors (16).
These approaches can be categorized into techniques that capitalize on (i) environmental correlation between SOC and environmental factors, (ii) spatial autocorrelation among SOC observations, and (iii) hybrid approaches that combine environmental correlation and spatial autocorrelation. More recently, machine learning–based spatial modeling techniques such as random forest (17), neural net- works (18), and rule-based models (19) have sought to capture nonlinear relationships between SOC and environmental factors.
Among the approaches used to predict the spatial heterogeneity of SOC stocks, multiple linear regressions and ordinary kriging are the most commonly used techniques, primarily due to their simplicity in interpretation and ease of use. However, the most accurate pre- dictions have been achieved through the hybrid approaches that combine both environmental correlation and spatial autocorrela- tion (16).
Permafrost-affected soils have large horizontal (hereafter “spatial”) and vertical (i.e., depth-distributed) heterogeneity of soil properties (3). Therefore, areal estimates of soil properties including SOC stocks could benefit from spatial modeling approaches. However, applica- tion of these approaches in the permafrost region has been limited because of low sample density and limited availability of spatially resolved environmental data. Recently, digital soil-mapping tech- niques using geospatial and remote sensing information have been applied at local to regional scales to account for and better represent the spatial heterogeneity of permafrost-affected soils (17, 20). These high-resolution mapping efforts have produced promising results with a variety of geospatial techniques.
Here, we present a new estimate of permafrost SOC stock on the basis of a continuous model of spatial variation by combining soil profile observations with spatially referenced data representing some of the major soil-forming factors (topographic attributes, land cover types, climate, and bedrock geology). We used a regression kriging approach to predict the spatial variability in SOC stocks at three depth intervals across the permafrost region soils of the Northern Hemi- sphere (excluding mid-latitude mountain ranges). Our approach coupled the correlation between SOC stocks and environmental fac- tors with the spatial autocorrelation in SOC observations to sepa- rately estimate SOC stocks and their spatial uncertainties in 0- to 1-m, 1- to 2-m, and 2- to 3-m depth intervals at 250-m spatial reso- lution. We identified soil-forming factors that were significant con- trollers of SOC stocks across the permafrost domain. Subsequently, we analyzed the spatial and vertical distributions of SOC stocks under different land cover types, topographic positions, permafrost types, and climatic conditions to provide the first high-resolution assess- ment of SOC stocks in the Northern Hemisphere permafrost region and quantified their relations with environmental factors, which is
critical to constrain the uncertainty that exists in predicting carbon climate feedbacks.
RESULTS
We estimated that Northern Hemisphere permafrost region soils contain 1014 −175+194 Pg C (hereafter, uncertainties are reported as lower and upper prediction intervals at 95% confidence level) to a depth of 3 m. Of the total estimate, 1000 −170+186 Pg C are in the northern cir- cumpolar region and 14 −5+8 Pg C are in the Tibetan permafrost region (Table 1). In the northern circumpolar region, the depth distribu- tion of SOC stocks was 23, 51, 31.5, and 17.5% in the 0- to 0.3-m, 0 to 1-m, 1 to 2-m, and 2 to 3-m depth intervals, respectively. In the Tibetan region, a greater proportion of predicted SOC stocks were found in the 0- to 1-m depth interval (64%), with 18% in both the 1- to 2-m and 2- to 3-m depth intervals. The spatial heterogeneity in predicted SOC stocks (as indicated by the coefficient of varia- tion) differed among depth intervals and regions (Table 1). The uncertainty in predicted SOC stock increased by 9% at 1- to 2-m and 19% at 2- to 3-m depth relative to the surface 0 to 1 m in the northern circumpolar region. By comparison, uncertainty in pre- dicted SOC stocks was much higher at 1- to 2-m depth interval in the Tibetan permafrost region. The predicted spatial distributions of SOC stocks and associated uncertainty estimates for the North- ern circumpolar and Tibetan permafrost regions are illustrated in Figs. 1 and 2.
Across both permafrost regions, we found an inverse relationship between the estimated magnitude and uncertainty of SOC stocks. The spatial distribution of uncertainty in SOC stocks varied at different depth intervals. For example, Southern Alaska and Eastern Canada had greater uncertainty at depth intervals of 0 to 1 and 2 to 3 m, but these regions had lower uncertainty in the 1- to 2-m depth intervals (Fig. 1). The fractional uncertainty in SOC stocks was overall much greater in the Tibetan permafrost region, especially below a depth of 1 m (Fig. 2). However, because Tibetan SOC stocks were much lower than in the circumpolar region, the actual variation in predicted stocks was much less (Table 1). The spatial heterogeneity (coefficient of variation; Table 1) of predicted SOC stock estimates decreased with depth in the Tibetan permafrost region. In contrast, spatial hetero- geneity increased with depth in the northern circumpolar perma- frost region. The average error of prediction indicated as the root mean square error (RMSE) increased with depth in both permafrost regions. In northern circumpolar region, the RMSE increased about three times in deeper depth intervals in comparison to surface soils (Table 1). The RMSE increased two times in deeper depths in the Tibetan permafrost region soils. The ratio of performance to devia- tion (RPD) value (>1.4) indicates moderate predictive ability of SOC stock estimates of 0- to 0.3-m and 0- to 1-m depth intervals in both permafrost regions. However, the predictive ability of predicted SOC stocks was lower (RPD, <1.4) in deeper depth intervals in both north- ern circumpolar and Tibetan permafrost regions.
We analyzed the spatial distribution of predicted area average and predicted total SOC stocks across a transect of permafrost zones within the northern circumpolar region (Table 2). Overall, large spa- tial heterogeneity in SOC stocks was predicted for all permafrost zones. The greatest spatial heterogeneity was found in the continu- ous and isolated permafrost zones (90 and 91% average coefficient of variation to 3-m depth, respectively). The discontinuous and spo- radic permafrost zones had somewhat lower spatial heterogeneity
on February 24, 2021http://advances.sciencemag.org/Downloaded from
(75 and 82% average coefficient of variation to 3-m depth, respec- tively). In general, spatial heterogeneity increased with depth across different permafrost zones. However, under continuous permafrost zone, spatial heterogeneity was largest (108% coefficient of varia- tion) within the 1- to 2-m depth interval. Of the 1000 Pg C predicted to be stored in the top 3 m of soils across the northern circumpolar region, about half (52%) occurred within the continuous permafrost zone. The remaining 477 Pg C were distributed similarly among the discontinuous, sporadic, and isolated permafrost zones (17, 15, and 16%, respectively). Across permafrost zones, both average SOC stocks and predicted total SOC stocks were consistently greater at 0 to 1 m than in the other depth intervals. About half of the SOC stocks (51%) were predicted in the surface 0- to 1-m depth interval, whereas 1- to 2-m and 2- to 3-m depth intervals across permafrost zones stored 32 and 17% of the SOC stocks, respectively.
Different environmental factors predicted the magnitude and spa- tial heterogeneity of SOC stocks in different permafrost regions and depth intervals. Environmental factors predicted 5 to 57% variation of permafrost region SOC stocks depending on the permafrost re- gion and depth interval. In general, the number of significant environ- mental factors decreased with depth (table S1). The highest variation (57%) in SOC stock was explained in surface (0 to 0.3 m) soils, and the lowest variation (5%) in SOC stock was explained at 2- to 3-m depth interval, both in the Tibetan permafrost region. Among dif- ferent topographic attributes, elevation and soil wetness index were consistently significant controllers of SOC stocks in both the circum- polar and Tibetan permafrost regions. Like other environmental factors, a larger number of topographic attributes were significant predictors of surface SOC stocks, and the number of significant topo- graphic predictors decreased with depth. Surface air temperature was a significant control of permafrost SOC stocks in the northern cir- cumpolar region. However, precipitation was a significant control in the Tibetan region. Bedrock geology type was a significant predic- tor of SOC stocks in the circumpolar region but not in the Tibetan region. Among all the environmental factors that we used, precipi- tation alone explained 47 and 24% of the variation in SOC stocks at 0- to 0.3-m and 0- to 1-m depth interval of the Tibetan perma- frost region. In the northern circumpolar region, slope angle was a
dominant environmental predictor of SOC stocks and explained 23%
of the variation in SOC stocks of 1- to 2-m depth interval. Tempera- ture alone explained 2 to 15% of the variation in SOC stocks of the northern circumpolar region (table S1).
Topographic attributes had a large influence on the spatial dis- tribution of permafrost region SOC stocks. The magnitudes of SOC stocks in different topographic settings were not consistent across the permafrost regions. In the 0- to 3-m depth interval of the northern circumpolar region (Fig. 3A), flat areas (5.2 million km2) had the highest and hilltop positions (1.4 million km2) had the lowest SOC stocks. The largest uncertainties in 0- to 3-m depth interval SOC stocks were found in toe-slope (3.2 million km2) and hilltop positions (49%) in the circumpolar region. Flat areas were least uncertain (36%) and mid-slope (3.8 million km2) positions had intermediate uncertainty (44%). In the 0- to 3-m depth interval of the Tibetan permafrost re- gion (Fig. 3B), toe-slope positions (0.5 million km2) stored the largest and flat areas (0.34 million km2) stored the lowest SOC stocks. The largest uncertainty (104%) in Tibetan region SOC stocks was found in flat areas. Toe-slope and mid-slope (0.51 million km2) positions had the least uncertainty (83 and 85%, respectively), while hilltop positions (0.27 million km2) had intermediate uncertainty (87%).
Our results suggest that land cover types were important environ- mental controllers of SOC stocks. In the circumpolar permafrost region (fig. S1A), tundra and needleleaf mixed forest land cover types stored the largest SOC stocks ( 381 −76+65 and 332 −79+62 Pg C, respectively).
Mosaics of different land cover type accounted for the next largest SOC stocks. The mosaic of grassland and shrubland stored 80 −21+15 Pg C, the mosaic of forest and shrubland stored 65 −20+14 Pg C, and the mosaic of broadleaved and needleleaf forest stored 36 −11+8 Pg C. Sizeable SOC stocks were also associated with grasslands ( 35 −13+7 Pg C), the flooded shrub or herbaceous land cover type ( 25 −3+2 Pg C), and needleleaf evergreen forest ( 7.5 −4+3 Pg C). Area-average SOC stock was highest in shrub wetlands and lowest in the needleleaf evergreen forest. We found the largest uncertainty in SOC stocks (96%) under the needle- leaf evergreen forest land cover type and the lowest uncertainty un- der the flooded shrub or herbaceous land cover type (21%). Among other land cover types, the uncertainty in SOC stocks ranged between 37 and 58%. In the Tibetan permafrost region (fig. S1B), grasslands
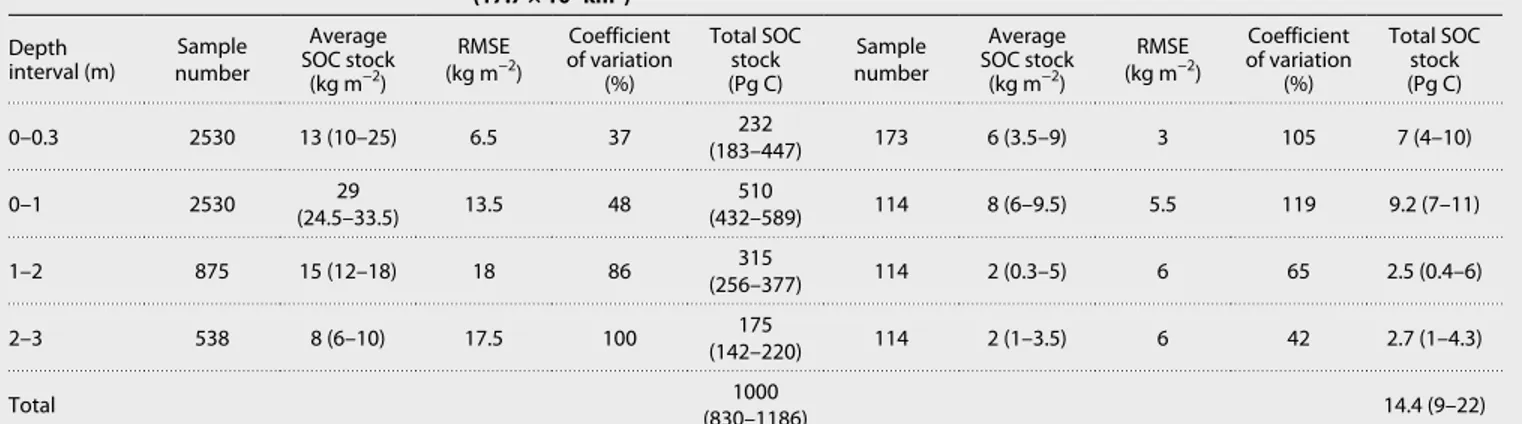
Table 1. Average SOC stocks, prediction error, and total predicted SOC stocks for different depth intervals and permafrost regions. Values in parentheses are the 95% confidence interval of predictions. RMSE, root mean square error.
Northern circumpolar permafrost region
(17.7 × 10⁶ km2) Tibetan permafrost region (1.1 x 10⁶ km2) Depth
interval (m) Sample number
Average SOC stock
(kg m−2)
RMSE (kg m−2)
Coefficient of variation
(%)
Total SOC stock (Pg C)
Sample number
Average SOC stock
(kg m−2)
RMSE (kg m−2)
Coefficient of variation
(%)
Total SOC stock (Pg C)
0–0.3 2530 13 (10–25) 6.5 37 232
(183–447) 173 6 (3.5–9) 3 105 7 (4–10)
0–1 2530 29
(24.5–33.5) 13.5 48 510
(432–589) 114 8 (6–9.5) 5.5 119 9.2 (7–11)
1–2 875 15 (12–18) 18 86 315
(256–377) 114 2 (0.3–5) 6 65 2.5 (0.4–6)
2–3 538 8 (6–10) 17.5 100 175
(142–220) 114 2 (1–3.5) 6 42 2.7 (1–4.3)
Total 1000
(830–1186) 14.4 (9–22)
on February 24, 2021http://advances.sciencemag.org/Downloaded from
had the largest SOC stocks ( 5.0 −2.6+3.7 Pg C). Needleleaf forest and the mosaic of natural vegetation stored 2.0 −0.39+0.42 and 2.2 −1.0+1.3 Pg C, respec- tively. Among the land cover types covering more than 1% land area, the mosaic of grasslands and shrublands stored the lowest SOC stocks ( 0.30 −0.09+0.15 Pg C). The average SOC stock was highest in the mixed forest land cover type and lowest in the grassland. The highest un- certainty (127%) in SOC stocks occurred under grassland land cover and the lowest occurred under mixed forests (~28%). Other land cover types had intermediate uncertainties ranging from 42 to 104%.
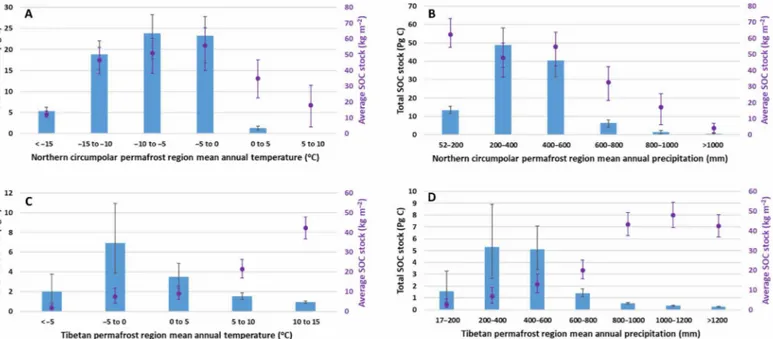
Climatic factors such as mean annual temperature (MAT) and mean annual precipitation (MAP) were differently related to SOC
stocks in the two permafrost regions. In the northern circumpolar region, predicted SOC stocks at 0- to 3-m depth were nonlinearly related to temperature (Fig. 4A). The lowest SOC stocks were as- sociated with the −29° to −25°C and −25° to −20°C MAT ranges (combined into the <−15°C MAT range; Fig. 4A). Predicted SOC stocks increased as MAT increased from −29° to −5°C and then de- creased as the MAT increased from −5° to 10°C. The largest SOC stocks were associated with the −10° to −5°C MAT range. The lowest SOC stocks were found in areas with MAT between −29° and −25°C. The area-average SOC stocks increased with temperature up to –5°C and then decreased at higher temperatures. The largest uncertainty in
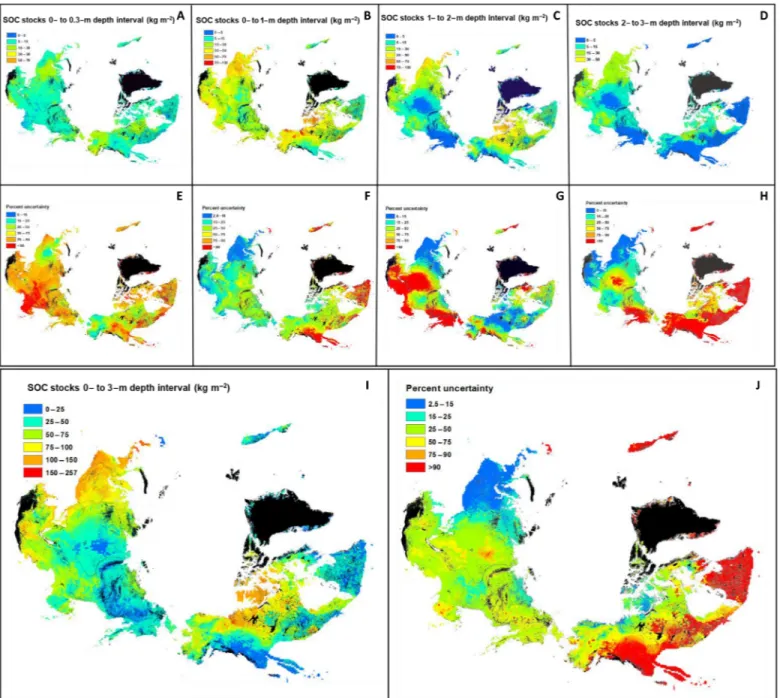
Fig. 1. Predicted spatial distribution of the SOC stocks of the northern circumpolar permafrost region. SOC stocks of the 0- to 0.3-m (A), 0- to 1-m (B), 1- to 2-m (C), and 2- to 3-m (D) depth intervals with their associated uncertainty estimates for 0 to 0.3 m (E), 0 to 1 m (F), 1 to 2 m (G), and 2 to 3 m (H). (I and J) SOC stocks for the 0- to 3-m depth interval and their spatial uncertainty estimate, respectively. Areas in black show water surface or perennial ice, urban, and barren land with consolidated materials.
on February 24, 2021http://advances.sciencemag.org/Downloaded from
average SOC stocks (146%) was found for areas with MAT in the 5° to 10°C range. Predicted SOC stocks increased as precipitation increased from MAP of 52 to 400 mm year−1 but decreased as MAP increased from 400 to >1000 mm year−1 (Fig. 4B). The largest SOC stocks were found in areas receiving MAPs of 200 to 400 mm year−1 and 400 to 600 mm year−1, respectively. Area-average SOC stocks decreased lin- early as MAP increased, while uncertainties in SOC stocks increased
with MAP. In the Tibetan permafrost region, predicted SOC stocks also exhibited nonlinear relationships with both MAT and MAP, although the maxima were associated with warmer MAT and wetter MAP ranges than in the northern circumpolar region. The largest Tibetan region SOC stocks were found in areas with −5° to 0°C MAT range (Fig. 4C) and in areas with 200- to 400-mm MAP (Fig. 4D).
Area-average SOC stocks increased as both MAT and MAP increased,
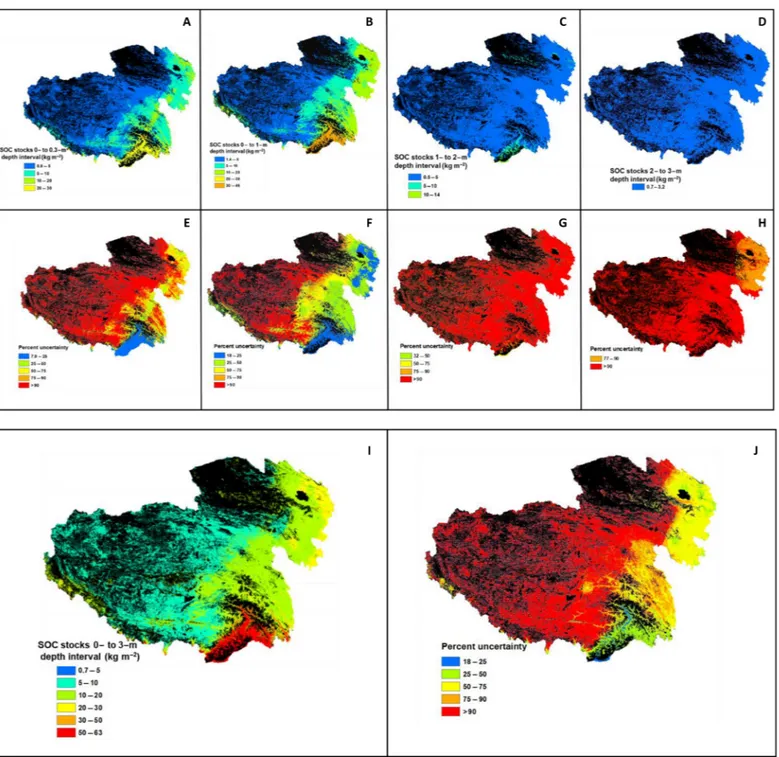
Fig. 2. Predicted spatial distribution of the SOC stocks of the Tibetan permafrost region. SOC stocks of the 0- to 0.3-m (A), 0- to 1-m (B), 1- to 2-m (C), and 2- to 3-m (D) depth intervals with their associated spatial uncertainty estimates for 0- to 0.3-m (E), 0- to 1-m (F), 1- to 2-m (G), and 2- to 3-m (H) depth intervals. (I and J) SOC stocks in the 0- to 3-m depth interval and their spatial uncertainty estimate, respectively. Areas in black show water surface or perennial ice, urban, and barren land with consol- idated materials.
on February 24, 2021http://advances.sciencemag.org/Downloaded from
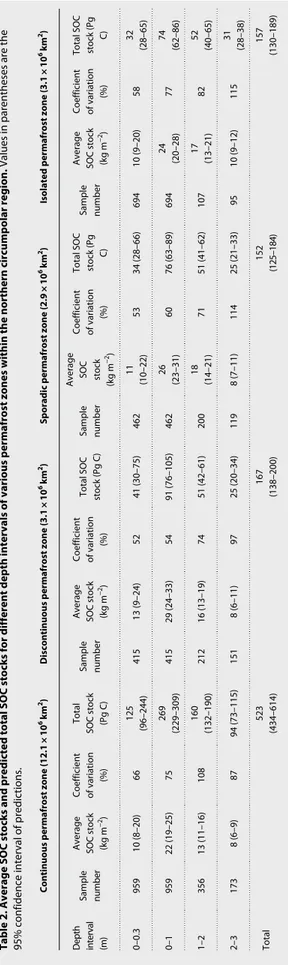
Table 2. Average SOC stocks and predicted total SOC stocks for different depth intervals of various permafrost zones within the northern circumpolar region. Values in parentheses are the 95% confidence interval of predictions. Continuous permafrost zone (12.1 × 10⁶ km2)Discontinuous permafrost zone (3.1 × 10⁶ km2)Sporadic permafrost zone (2.9 × 10⁶ km2)Isolated permafrost zone (3.1 × 10⁶ km2) Depth interval (m) Sample number
Average SOC stock −2(kg m)
Coefficient of variation
(%)
Total SOC stock (Pg C)
Sample number Average SOC stock (kg m
−2) Coefficient of variation
(%)
Total SOC stock (Pg C) Sample number
Average SOC stock (kg m−2)
Coefficient of variation
(%)
Total SOC stock (Pg
C)
Sample number
Average SOC stock −2(kg m)
Coefficient of variation
(%)
Total SOC stock (Pg
C) 0–0.395910 (8–20)66125 (96–244)41513 (9–24)5241 (30–75)46211 (10–22)5334 (28–66)69410 (9–20)5832 (28–65) 0–195922 (19–25)75269 (229–309)41529 (24–33)5491 (76–105)46226 (23–31)6076 (63–89)69424 (20–28)7774 (62–86) 1–235613 (11–16)108160 (132–190)21216 (13–19)7451 (42–61)20018 (14–21)7151 (41–62)10717 (13–21)8252 (40–65) 2–31738 (6–9)8794 (73–115)1518 (6–11)9725 (20–34)1198 (7–11)11425 (21–33)9510 (9–12)11531 (28–38) Total523 (434–614)167 (138–200)152 (125–184)157 (130–189) on February 24, 2021http://advances.sciencemag.org/Downloaded from
although stocks stabilized above MAP of 800 mm year−1. In con- trast, the magnitude of uncertainty in SOC stocks decreased with increases in MAT and MAP. Lowest prediction uncertainties (~26%)
were found for SOC stocks in areas with >800-mm MAP and
>10°C MAT.
DISCUSSION
We generated spatially explicit estimates of SOC stocks at 250-m resolution for permafrost-affected soils of the Northern Hemisphere by combining the northern circumpolar region with the Tibetan permafrost region. Using a new database, we quantified the spatial distribution of uncertainties in permafrost region SOC stocks and identified geographic regions with higher and lower uncertainties.
We identified land cover types, topographic positions, and climatic zones where the predicted SOC stocks and associated uncertainties are highest and lowest. We identified high-resolution, significant environmental predictors of SOC stocks of different permafrost re- gions and depth intervals. Using a detailed topographic analysis, we also predicted the spatial distribution of SOC stocks in different landscape positions across the Northern Hemisphere permafrost region soils.
Existing global SOC studies underestimate permafrost region SOC stocks mainly due to insufficient inclusion of permafrost region soil samples in the global SOC estimates (10, 11). We compared our estimates with two northern circumpolar estimates (10, 11) and one Tibetan region SOC stock estimate (21). These earlier studies used different approaches for upscaling SOC stock estimates. Nonetheless, our total SOC stock estimate (0- to 3-m depth interval) for the northern circumpolar region is similar to earlier studies [3 and 2%
lower than the estimates of Hugelius et al. (11) and Tarnocai et al.
(10), respectively]. Similarly, our Tibetan permafrost region SOC stock estimate is 6% lower than the Ding et al. (21) estimate. In con- trast, our estimates showed larger spatial heterogeneity and uncer- tainty ranges in comparison to those reported by earlier studies.
Fig. 3. Heterogeneous topographic controls on permafrost region soil organic carbon stocks. Total SOC stocks and average SOC stocks across different topo- graphic positions in the northern circumpolar (A) and Tibetan (B) permafrost regions.
Bars are total predicted SOC stocks and circles are average SOC stocks in the 0–3 m depth interval. Error bars indicate the 95% confidence interval of the predictions.
Fig. 4. Heterogeneous climatic controls on permafrost region soil organic carbon stocks. Total SOC stocks and average SOC stocks across different ranges of mean annual temperature and mean annual precipitation in the northern circumpolar (A, B) and Tibetan (C, D) permafrost regions. Bars are total predicted SOC stocks and cir- cles are average SOC stocks in the 0–3 m depth interval. Error bars indicate the 95% confidence interval of the predictions. Note: The < –15°C temperature bin includes analyzed temperature ranges of –29° to –25°C and –25° to –20°C, which were associated with SOC stocks too small to illustrate individually.
on February 24, 2021http://advances.sciencemag.org/Downloaded from
Differences between our estimates and the previous northern cir- cumpolar studies allude to the importance of increased sample size and of associations between SOC and geospatial soil-forming fac- tors. For example, we were able to use 42, 69, and 53% more samples at the 0- to 1-m, 1- to 2-m, and 2- to 3-m depth intervals, respective- ly, than were available to Hugelius et al. (11) (table S2). Although Tarnocai et al. (10) and Hugelius et al. (11) used a similar spatial prediction approach (thematic upscaling), Hugelius et al. (11) in- corporated more samples and a different geographic subdivision than Tarnocai et al. (10). Although the differences in total 0- to 3-m SOC stock estimates are relatively small compared to these former circumpolar estimates, large differences were found in the SOC stock estimates and their spatial patterns for different depth intervals. In the 0- to 1-m depth interval, our estimate is 3 and 8% greater than those of Tarnocai et al. (10) and Hugelius et al. (11), respectively.
However, our estimates are 11 and 15% lower at depth intervals of 1 to 2 m at 2 to 3 m, respectively, compared to those reported by Hugelius et al. (11). This divergence of predicted depth distributions may have important consequences for the vulnerability of perma- frost SOC to top-down warming if SOC stocks are more superficially distributed (7,8). Our analysis also contrasts from these prior cir- cumpolar studies in critical methodological ways. Whereas both prior studies used a thematic upscaling approach in which the aver- age value of observed SOC stocks was used as the predicted value for specific thematic classes, such as soil types (11), our geospatial approach uses both the (i) correlation between SOC stock observa- tions and environmental data representing soil-forming factors and (ii) spatial autocorrelation in SOC observations to predict SOC stocks. The small difference between our Tibetan permafrost region SOC stock estimate (14 Pg C) and the estimate of Ding et al. (21) (15 Pg C) was due to the different spatial prediction approaches used.
The machine learning approach used by Ding et al. (21) uses non- linear relationships between SOC stocks and environmental factors to predict spatial heterogeneity of SOC stocks.
Climatic factors including temperature and precipitation regulate SOC stocks, particularly in soils of cold temperature regimes or subject to prolonged saturation. In the permafrost region, consist- ently low temperatures drive pedogenic processes such as cryotur- bation and reduce rates of biological activity associated with organic C decomposition, hence preserving large stocks of SOC. Precipita- tion affects SOC in permafrost soils through direct effects on soil moisture content and its interactions with topography and vegeta- tion, which influence redox potential and the quantity and qualities of organic matter inputs, respectively. We found temperature to be a significant environmental controller of SOC stocks in the northern circumpolar region, consistent with findings of earlier studies (10, 22) that reported higher SOC stocks in areas with lower temperatures.
Our predictions of lower SOC stocks in the areas of the high arctic region with lowest MAT and MAP (polar desert) are consistent with the results of Hugelius et al. (11) who also reported lower SOC stocks in the high arctic regions. These areas have thin sedimentary parent materials with very limited soil development and vegetation growth due to harsh environmental conditions. In this region, SOC stock does not increase with increase in precipitation (Fig. 4B) and related vegetation growth, and as a result, the net primary produc- tivity is not a predictor of SOC stocks. Instead, the large quantities of SOC in the northern circumpolar permafrost region result from cold temperatures, peat formation, cryoturbation, and accumulation of eolian and alluvial sediments (1–4). In the Tibetan permafrost
region, however, precipitation was a significant controller, and we found no significant correlation of SOC stocks with MAT. Our find- ings are consistent with the findings of Yang et al. (23), who reported soil moisture as the dominant environmental factor regulating the spatial distribution of Tibetan permafrost region SOC stocks. Simi- larly, consistent with our observation, Wu et al. (24) observed no significant correlation between SOC stocks and MAT in the Tibetan permafrost region.
Vegetation type determines net carbon input into the soil system, quality and vulnerability of soil organic matter, and influence C and nutrient turnover and distribution. Predicted large SOC stocks under tundra vegetation are consistent with earlier estimates of perma- frost region SOC stocks. Tundra vegetation areas have been reported to store high SOC stocks due to cryoturbation and extensive peat- land formation (2, 9). During cryoturbation, surface SOC is sub- ducted into the deeper soil until it reaches the top of the permafrost table where it is protected from mineralization due to cold tempera- tures (2, 10). The needleleaf forest land cover type in our dataset represents land areas with black spruce (North America), spruce (Europe), or larch (Asia) forest. This land cover type represents thicker surface organic horizons that have higher carbon concentrations (less labile C and more acidic soils) and also thermally insulate the soil, reducing active-layer thickness and preserving the permafrost layers (24, 25). However, the needleleaf vegetation was not a separate land cover category in the dataset that we used, but it was distributed under three different land cover categories (fig. S1A). As a result, the needle- leaved evergreen land cover type shows comparatively lower SOC stocks. In the Tibetan permafrost region, grasslands stored the larg- est amount of SOC stocks, due primarily to high biomass C inputs in grasslands compared to other land cover types, and lower soil de- composition rates due to lower temperatures in the alpine regions where most Tibetan grasslands are located (26). Our results are con- sistent with the findings of earlier studies of the Tibetan permafrost region, which also reported higher SOC stocks under grasslands (23, 24).
Topographic landscape attributes are important factors controlling soil carbon storage in both arctic and boreal landscapes because they influence not only the soil erosional and depositional processes but also soil texture and thickness through temperature (i.e., eleva- tion), precipitation type, solar radiation (i.e., aspect), and surface and subsurface hydrology. Topography also regulates soil moisture move- ment in landscapes and formation of wetlands (27). Among topo- graphic attributes, elevation and soil wetness index were consistently significant predictors of permafrost SOC stocks in both study regions.
Soil wetness index, which is a proxy for land surface drainage and accumulation, has been reported to be an important controller of permafrost SOC stocks (14, 25). Other topographic attributes such as slope, aspect, and stream power index were significant control- lers in the northern circumpolar region but not in the Tibetan re- gion. Our findings of higher uncertainty ranges in predicted SOC stocks of the toe-slope landscape position are consistent with the findings of earlier studies. For example, using a robust topographic analysis, Shelef et al. (27) reported a lower number of permafrost SOC observations and greater uncertainty in toe-slope positions in the northern circumpolar region. However, the reported uncertain- ty also accounts for that caused by deep soil deposits (>3 m). In the Tibetan region, we found the highest uncertainty (104%) in flat areas.
We harmonized and updated the existing estimate of SOC stocks of permafrost-affected soils using a larger number of SOC profile observations and secondary information of soil-forming factors.
on February 24, 2021http://advances.sciencemag.org/Downloaded from
Although we were able to increase the number of SOC profile ob- servations substantially through international collaborations, our estimates are still constrained by limited sample density, lack of spe- cific soil information such as parent material age and organic soil accumulation rates, and relatively high uncertainty (95% confidence interval). Our estimates do not include SOC stocks from deeper soil layers, such as those found in deep peat, yedoma (polygenetic loess- like deposits), deltaic (alluvial deposits), and hill-toe soil deposits below 3-m depth (28). Therefore, the reported SOC quantities like- ly underestimate the total SOC stocks of permafrost-affected soils.
We envision that more SOC profile observations will become avail- able in the future because of the increased attention that permafrost and cold region soils are receiving from multiple research agencies and investigators. We expect that better international collaboration, within the International Soil Carbon Network (29) or the Interna- tional Permafrost Association Permafrost and Carbon Budgets Interest Group, for example, will further improve estimates of per- mafrost SOC stocks. Moreover, peatland SOC stocks were not scaled separately, as the land cover map that we used was prepared for global applications and the stocks do not represent a separate land cover type for peatlands. Future effort to conduct separate analyses for peat and no-peat lands could decrease the uncertainties in SOC stock estimates such as demonstrated by Siewert (17), who used nonlinear approaches in predicting SOC stocks in peat-dominated permafrost landscape.
This study builds upon and updates a database of observed SOC profiles to generate high-resolution (250 m) estimates of SOC stocks for permafrost region soils of the Northern Hemisphere. We used the updated estimate and its spatial uncertainties to analyze the control of environmental factors on predicted SOC stocks. Our re- sults suggest 1014 −175+194 Pg C in the 0- to 3-m depth interval in Northern Hemisphere permafrost-affected soils. Our SOC stock estimates captured large spatial heterogeneity (coefficient of variation: 37 to 119% among subregions) and showed greater uncertainty ranges in comparison to earlier estimates. We found that soil wetness index and elevation are the dominant topographic controllers of SOC stocks of permafrost-affected soils. Mean annual surface air temperature was a significant controller of SOC stocks in the circumpolar re- gion, whereas MAP was a significant controller in the Tibetan re- gion. In the circumpolar region, the greatest uncertainty in predicted SOC stocks (49%) was in hill toe-slope positions. In the Tibetan region, however, the uncertainty was highest (104%) in flat areas.
Our spatially explicit estimates of SOC stocks will be crucial for ini- tializing and benchmarking the representation of SOC stocks in re- gional and global land surface models for quantifying the permafrost carbon feedback. Moreover, our data help in prioritizing sampling strategies that aim to reduce uncertainty in permafrost SOC stocks.
MATERIALS AND METHODS
SOC profile observations and their distribution across environmental factors
We compiled and updated the existing SOC data for permafrost- affected soils from various sources. In addition to the SOC data used by previous studies (11, 15, 17, 21, 30, 31), we collected additional georeferenced SOC profile observations from individual investiga- tors working in Canada, Russia, South Korea, and Sweden. We strat- ified all the SOC profile observations by depth intervals into 0 to 1 m (2530 profiles), 1 to 2 m (875 profiles), and 2 to 3 m (538 profiles)
to calculate SOC stocks (kg m−2) at each depth interval for the northern circumpolar region. Similarly, we acquired 173 soil profile observations with depth intervals ranging from 0 to 3 m for the Tibetan permafrost region. The spatial distribution of SOC profile observations across both study areas is shown in fig. S2.
Although the sample density is not yet comparable with that of other regions, the collected pedons are broadly representative of the diverse environmental conditions associated with permafrost- affected soils. In the northern circumpolar region, the SOC profile observations represented 13 different land cover types. The largest number of samples were from the needleleaf forest land cover type (34.3%), followed by sparse vegetation (25.5%) (described as tundra vegetation in permafrost literature), and mosaic forest shrubland vegetation (10.5%). The smallest number of samples were from broad- leaf deciduous forest (0.12%), followed by broadleaf evergreen forest (0.17%), and shrublands (0.21%). Soil observations covered 11 of 14 bedrock geology types in the circumpolar region. The largest numbers of samples were from siliciclastic sedimentary rocks (34.5%), mixed sedimentary rocks (25.3%), and unconsolidated sediments (8.7%). The smallest numbers of samples were from basic plutonic rocks (0.25%), intermediate plutonic rocks (0.3%), and acid volca- nic rocks (1%). In the Tibetan region, soil observations were taken from seven different land cover types. The largest numbers of sam- ples were from the mosaic of natural vegetation (32.4%), followed by bare unconsolidated areas (23.7%), grasslands (19%), and crop- lands (11%). The smallest numbers of samples were from sparse vegetation (0.6%) and irrigated croplands (4%). Samples spanned eight bedrock geology types; the largest number of samples were from mixed sedimentary rocks (36%), followed by siliciclastic sedi- mentary rocks (21.4%), and unconsolidated sediments (19%). The smallest numbers of samples were from acid volcanic rocks (2.3%) and acid plutonic rocks (2.9%).
Spatial heterogeneity in environmental factors of the permafrost region
To represent topography across both permafrost regions, we used a digital elevation model (DEM) with 250-m spatial resolution obtained from the U.S. Geological Survey (32). Elevations ranged from sea level to 6130 m in the northern circumpolar region and from 82 to 8639 m in the Tibetan region. The DEM was used to calculate 16 topographic attributes [elevation, slope, aspect, curvature (vertical, horizontal, and mean), flow length, flow direction, flow accumula- tion, specific catchment area, soil wetness index, sediment transport index, stream power index, terrain characterization index, slope aspect index, and relative relief], which were evaluated for their util- ity in predicting the spatial heterogeneity of SOC stocks. Among these 16 topographic attributes, elevation, aspect, soil wetness in- dex, stream power index, and flow accumulation were significant predictors of SOC stocks at different depth intervals and for dif- ferent geographic areas. Average annual (1960–1990) precipitation and temperature data at 1-km spatial resolution were obtained from the global climate data of Hijmans et al. (33). In the northern circumpolar region, average annual precipitation ranged from 52 mm in the Russian Arctic Desert to 2956 mm in southeast Green- land. Average annual temperatures were lowest in northern Canada and Greenland (−29° to −20°C) and highest in southern Canada (3° to 10°C). In the Tibetan region, average annual precipitation and precipitation ranged from 17 to 4070 mm and −19° to 24°C, respectively.
on February 24, 2021http://advances.sciencemag.org/Downloaded from
Global land cover data at 250-m spatial resolution were obtained from the European Space Agency (34). Of the total land area in the northern circumpolar region, needleleaf mixed forest covered 31%, sparse vegetation (described as tundra vegetation in permafrost lit- erature) covered 27%, permanent snow and ice covered 11%, and shrub land covered 7%. In the Tibetan region, bare areas and grass- lands covered roughly equal land area, 31.6 and 31%, respectively, followed by mosaic vegetation (11.2%), croplands (6%), and mosaic of cropland and vegetation (4.3%). The bedrock geology data were obtained from the global lithological map produced by Hartmann and Moosdorf (35). In the northern circumpolar region, the largest proportions of land area had mixed sedimentary rocks (24.7%), fol- lowed by siliciclastic sedimentary rocks (19%), metamorphic rocks (12.4%), and ice and glaciers (12.1%). The smallest proportions of land area were underlain by evaporates (0.05%), pyroclastics (0.37%), and acid volcanic rocks (0.73%). In the Tibetan region, the largest proportions of land area had mixed sedimentary rocks (27.4%), fol- lowed by siliciclastic sedimentary rocks (22%), unconsolidated sed- imentary rocks (13%), and acid plutonic rocks (10%). The smallest proportions of land area were under basic plutonic rocks (0.4%), intermediate plutonic rocks (0.5%), and ice and glaciers (0.75%).
For this study, we resampled all the environmental data into a com- mon spatial resolution of 250 m. All analyses were performed in the Albers Equal Area Conic projection. Continuous environmental vari- ables were resampled using bilinear interpolation, and categorical variables were resampled using the nearest-neighbor resampling technique by using the resample function of ArcGIS (ArcGIS ver- sion 10.4, Environmental Systems Research Institute Inc., Redlands, CA, USA).
Spatial prediction and uncertainty quantification of SOC stocks
Using a stratified regression-kriging approach (36, 37), we made spatial predictions of SOC stocks for three separate regions: (i) the North American and Atlantic permafrost region (Alaska, Canada, Greenland, Iceland, and Svalbard), (ii) the Eurasian permafrost re- gion (Scandinavia, Russia, Kazakhstan, and Mongolia), and (iii) the Tibetan permafrost region. In this approach, stepwise multiple lin- ear regression was applied separately to each depth interval within each region to select significant environmental predictors of SOC stocks. Selected models for each region and depth interval were test- ed for multicollinearity of selected independent variables, unequal error variance, normality, and randomness of the residuals. Satis- factory models were then applied to the 250-m spatial resolution environmental datasets to generate spatially explicit predictions of SOC stocks. Residuals were calculated at the model calibration sites and tested for spatial autocorrelation. Spatially autocorrelated re- siduals were interpolated using ordinary kriging at 250-m spatial resolution and added to the regression predictions to generate regression-kriging predictions of SOC stocks. The adopted spatial modeling approach can be summarized by the following equation
C RK ( u i , v i ) = C R ( u i , v i ) + ε OK ( u i , v i )
where CRK(ui, vi) are the predicted SOC stocks using regression kriging, CR(ui, vi) are the predicted SOC stocks using multiple linear regression, OK(ui, vi) are the interpolated values of the spatially auto- correlated residuals at 250-m regular grid cells across the study area using ordinary kriging, and ui, vi are the geographical coordinates.
In northern circumpolar region, of 2530 total samples, only 875 samples reached down to 1.5- to 2-m depth interval, and only 538 samples reached down to 2.5- to 3-m depth interval. Therefore, we used 2530, 875, and 538 samples to estimate the SOC stocks of 0- to 1-m, 1- to 2-m, and 2- to 3-m depth intervals in the northern circumpolar region. In Tibetan permafrost region, we used 173 sam- ples for 0- to 0.3-m depth interval and 114 samples to estimate SOC stocks of the remaining three depth intervals (Table 1). To define the permafrost region extent in both of our study areas, we used previously published permafrost region maps of northern circum- polar (38) and Tibetan (39) region. In our analysis, while estimating SOC stocks, we excluded the land area covered by water surface or perennial ice, urban, and barren land with consolidated materials by using the land cover data (34).
Three major sources of uncertainty exist in our estimates: (i) un- certainty emerging from SOC observations because the SOC obser- vations come from several sources that used a variety of analytical techniques to determine the organic carbon content of soils, (ii) uncertainty from environmental factors, as the environmental data representing soil-forming factors come with their own uncertainties, and (iii) uncertainty from spatial model structures. Several approach- es can be used to account for these uncertainties and estimate the spatial distribution of prediction intervals across a study area (40).
These three sources of uncertainties are represented in the model residuals (the difference between the observed and the modeled SOC stock values). Therefore, the residuals between the modeled outputs and corresponding observed values at model calibration sites were used to generate 95% prediction intervals (14, 40). We calcu- lated prediction SEs at each 250-m grid cell across the study area from the kriging variance of the model residuals using the “leave- one-out” cross-validation approach of the Geostatistical Analyst func- tion of ArcGIS 10.6. Because the residuals were normally distributed, we generated confidence interval maps by multiplying the SE maps by a Z value (1.96) that corresponds to a 95% probability. The re- sulting confidence interval maps of SOC stocks were then added and subtracted from the regression-kriging predictions to estimate the 95% prediction interval of SOC stocks for each depth interval.
The adopted uncertainty quantification approach can be summa- rized in the equations below
PL iL = Pr i − 1.96 * PSE
PL iU = Pr i + 1.96 * PSE
where PL iL and PL iU are the lower and upper prediction limits of SOC stocks for the selected depth interval at the i-th observation, respec- tively, Pri is the model prediction of SOC stocks at the i-th observa- tion, 1.96 is the Z value at 95% probability, and PSE is the prediction SE of the residuals.
We used a K-fold validation approach to calculate validation in- dices such as RMSE and RPD (ratio of the SD of the observed SOC stock values to the RMSE of the predictions) of predicted SOC maps.
The RMSE shows the average error of prediction, and the RPD demonstrates the predictive ability of generated SOC maps. The lower RMSE and higher RPD values shows more accurate SOC stock predictions. In this approach, we divided the soil samples into four different spatially balanced calibration and validation datasets (70/30, 75/25, 85/15, and 90/10) using the “create subset” function
on February 24, 2021http://advances.sciencemag.org/Downloaded from
of ArcGIS (ArcGIS version 10, Environmental Systems Research Institute Inc., Redlands, CA, USA). We used the calibration datasets to predict the SOC stocks, and the predicted SOC stock values were extracted at the validation data sites, and the RMSE and the RPD were calculated for each data split. We reported the average RMSE and RPD values for each depth interval in the revised manuscript.
Environmental predictors of SOC stocks
To evaluate the influence of hillslope positions on SOC stocks, we divided the landscape into four primary topographic units: hilltops, mid-slope, toe-slope, and flat areas, through a multistep topograph- ic analysis of the DEM. We first removed the high-frequency noise from the DEM by filtering the DEM with a Gaussian filter of 5 × 5 pix- els with an SD of 1 pixel. We then computed the topographic curva- ture with a Laplacian operator, filled sinks in the DEM, and computed upstream drainage area for each pixel. Fluvial channels were de- fined as pixels with a drainage area that exceeds 4 km2, a relatively high drainage area that accounts for the long hillslopes that charac- terize high-altitude areas (27). We computed the height above the nearest river by interpolating between channels using the nearest- neighbor interpolation technique and subtracting the interpolated surface from the DEM. The representative hillslope relief at each location was attained by computing the local relief of the elevation above the nearest river over a radius of 2000 m such that the local relief is computed over a length scale that is longer than a typical hillslope (0.5 to 2 km2) (27), and hilly terrain was defined as areas with a local relief of >40 m (i.e., <2% regional slope). We then used the local relief, topographic curvature, and height above the nearest drainage to partition the landscape to hilltops [locations of convex topography (curvature, <0) in the upper portion of hillslopes (i.e., where elevation above the nearest river is higher than half of the local relief)] and hill-toes [locations of concave topography (curva- ture, >0) at the lower portion of hillslopes (i.e., where elevation above the nearest river is lower than half of the local relief)]. To address the transition between these categories, we also defined mid-slope positions as areas that do not comply with the aforementioned con- straints (e.g., areas where elevation is higher than half of the local relief but curvature is positive or vice versa). Floodplains and valleys were defined as areas where the height above the nearest river is <10 m.
To evaluate the importance of potential environmental control- lers on SOC distributions, we compared the predicted SOC stocks under different topographic positions, land cover types, and climat- ic zone. We calculated several descriptive statistics for SOC stocks and their lower and upper prediction intervals at the 0- to 3-m depth interval under each topographic position, land cover type, and cli- matic zone.
SUPPLEMENTARY MATERIALS
Supplementary material for this article is available at http://advances.sciencemag.org/cgi/
content/full/7/9/eaaz5236/DC1
View/request a protocol for this paper from Bio-protocol.
REFERENCES AND NOTES
1. E. Gorham, Northern peatlands: Role in the carbon cycle and probable responses to climatic warming. Ecol. Appl. 1, 182–195 (1991).
2. J. G. Bockheim, Importance of cryoturbation in redistributing organic carbon in permafrost-affected soils. Soil Sci. Soc. Am. J. 71, 1335–1342 (2007).
3. C. L. Ping, G. J. Michaelson, J. M. Kimble, V. E. Romanovsky, Y. L. Shur, D. K. Swanson, D. A. Walker, Cryogenesis and soil formation along a bioclimate gradient in Arctic North America. J. Geophys. Res. 113, G03S12 (2008).
4. G. Grosse, J. Harden, M. R. Turetsky, A. D. McGuire, P. Camill, C. Tarnocai, S. Frolking, E. A. G. Schuur, T. Jorgenson, S. Marchenko, V. Romanovsky, K. P. Wickland, N. French, M. Waldrop, L. Bourgeau-Chavez, R. G. Striegl, Vulnerability of high-latitude soil organic carbon in North America to disturbance. J. Geophys. Res. 116, G00K06 (2011).
5. L. Landrum, M. M. Holland, Extremes become routine in an emerging new Arctic. Nat.
Clim. Chang. 10, 1108–1115 (2020).
6. Q. Lu, D. Zhao, S. Wu, Simulated responses of permafrost distribution to climate change on the Qinghai-Tibet Plateau. Sci. Rep. 7, 3845 (2017).
7. E. A. G. Schuur, A. D. McGuire, C. Schadel, G. Grosse, J. W. Harden, D. J. Hayes, G. Hugelius, C. D. Koven, P. Kuhry, D. M. Lawrence, S. M. Natali, D. Olefeldt, V. E. Romanovsky, K. Schaefer, M. R. Turetsky, C. C. Treat, J. E. Vonk, Climate change and the permafrost carbon feedback. Nature 520, 171–179 (2015).
8. C. D. Koven, D. M. Lawrence, W. J. Riley, Permafrost carbon−climate feedback is sensitive to deep soil carbon decomposability but not deep soil nitrogen dynamics. Proc. Natl.
Acad. Sci. U.S.A. 112, 3752–3757 (2015).
9. C.-L. Ping, G. J. Michaelson, M. T. Jorgenson, J. M. Kimble, H. Epstein, V. E. Romanovsky, D. A. Walker, High stocks of soil organic carbon in the North American arctic region. Nat.
Geosci. 1, 615–619 (2008).
10. C. Tarnocai, J. P. Canadell, E. A. G. Schuur, P. Kuhry, G. Mazhitova, S. Zimov, Soil organic carbon pools in the north circumpolar permafrost region. Global Biogeochem. Cycles 23, GB203 (2009).
11. G. Hugelius, J. Strauss, S. Zubrzycki, J. W. Harden, E. A. G. Schuur, C.-L. Ping, L. Schirrmeister, G. Grosse, G. J. Michaelson, C. D. Koven, J. A. O’Donnell, B. Elberling, U. Mishra, P. Camill, Z. Yu, J. Palmatag, P. Kuhry, Estimated stocks of circumpolar permafrost carbon with quantified uncertainty ranges and identified data gaps.
Biogeosciences 11, 6573–6593 (2014).
12. G. Hugelius, Spatial upscaling using thematic maps: An analysis of uncertainties in permafrost soil carbon estimates. Global Biogeochem. Cycles 26, GB2026 (2012).
13. H. Jenny, Factors of Soil Formation (McGraw-Hill, 1941), p. 281.
14. U. Mishra, B. Drewniak, J. D. Jastrow, R. M. Matamala, U. W. A. Vitharana, Spatial representation of organic carbon and active-layer thickness of high latitude soils in CMIP5 earth system models. Geoderma 300, 55–63 (2017).
15. U. W. A. Vitharana, U. Mishra, J. D. Jastrow, R. Matamala, Z. Fan, Observational needs for estimating Alaskan soil carbon stocks under current and future climate. Eur. J. Vasc.
Endovasc. Surg. 122, 415–429 (2017).
16. B. Minasny, A. B. McBratney, B. P. Malone, I. Wheeler, Digital mapping of soil carbon. Adv.
Agron. 118, 1–47 (2013).
17. M. B. Siewert, High-resolution digital mapping of soil organic carbon in permafrost terrain using machine-learning: A case study in a sub-Arctic peatland environment.
Biogeosciences 15, 1663–1682 (2018).
18. B. P. Malone, A. B. McBratney, B. Minasny, G. M. Laslett, Mapping continuous depth functions of soil carbon storage and available water capacity. Geoderma 154, 138–152 (2009).
19. M. Lacoste, B. Minasny, A. B. McBratney, D. Michot, V. Viaud, V. C. Walter, High resolution 3D mapping of soil organic carbon in a heterogeneous agricultural landscape. Geoderma 213, 296–311 (2014).
20. N. J. Pastick, M. Rigge, B. K. Wylie, M. T. Jorgenson, J. R. Rose, K. D. Johnson, J. Lei, Distribution and landscape controls of organic layer thickness and carbon within the Alaskan Yukon River Basin. Geoderma 230–231, 79–94 (2014).
21. J. Ding, F. Li, G. Yang, L. Chen, B. Zhang, L. Liu, K. Fang, S. Qin, Y. Chen, Y. Peng, C. Ji, H. He, P. Smith, Y. Yang, The permafrost carbon inventory on the Tibetan Plateau: A new evaluation using deep sediment cores. Glob. Chang. Biol. 22, 2688–2701 (2016).
22. K. D. Johnson, J. Harden, A. D. McGuire, N. B. Bliss, J. G. Bockheim, M. Clark, T. Nettleton- Hollingsworth, M. T. Jorgenson, E. S. Kane, M. Mack, J. O'Donnell, C.-L. Ping, E. A. G. Schuur, M. R. Turetsky, D. W. Valentine, Soil carbon distribution in Alaska in relation to soil-forming factors. Geoderma 167–168, 71–84 (2011).
23. Y. Yang, J. Fang, Y. Tang, C. Ji, C. Zheng, J. He, B. Zhu, Storage, patterns and controls of soil organic carbon in the Tibetan grasslands. Glob. Chang. Biol. 14, 1592–1599 (2008).
24. X. Wu, L. Zhao, H. Fang, Y. Zhao, J. M. Smoak, Q. Pang, Y. Ding, Environmental controls on soil organic carbon and nitrogen stocks in the high-altitude arid western Qinghai- Tibetan Plateau permafrost region. Eur. J. Vasc. Endovasc. Surg. 121, 176–187 (2016).
25. J. W. Harden, K. L. Manies, M. R. Turetsky, J. C. Neff, Effects of wildfire and permafrost on soil organic matter and soil climate in interior Alaska. Glob. Chang. Biol. 12, 2391–2403 (2006).
26. E. G. Jobbagy, R. B. Jackson, The vertical distribution of soil organic carbon and its relation to climate and vegetation. Ecol. Appl. 10, 423–436 (2000).
27. E. Shelef, J. C. Rowland, C. J. Willson, G. E. Hilley, U. Mishra, G. L. Alttman, C.-L. Ping, Large uncertainty in permafrost carbon stocks due to hillslope soil deposits. Geophys. Res. Lett.
44, 6134–6144 (2017).
28. J. Strauss, L. Schirrmeister, G. Grosse, D. Fortier, G. Hugelius, C. Knoblauch, V. Romanovsky, C. Schädel, T. Schneider von Deimling, E. A. G. Schuur, D. Shmelev,
on February 24, 2021http://advances.sciencemag.org/Downloaded from