Phenotypic Variability in the Coccolithophore Emiliania huxleyi
Sonia Blanco-Ameijeiras1¤, Mario Lebrato2*, Heather M. Stoll3, Debora Iglesias- Rodriguez4, Marius N. Müller5, Ana Méndez-Vicente3, Andreas Oschlies6
1National Oceanography Centre, Southampton, University of Southampton, European Way, SO14 3ZH Southampton, United Kingdom,2Kiel University (CAU), Christian-Albrechts-Platz 4, 24118, Kiel, Germany, 3Department of Geology, University of Oviedo, Arias de Velasco s/n, 33005 Oviedo, Spain,4Department of Ecology, Evolution and Marine Biology, University of California Santa Barbara, Santa Barbara, California, 93106, United States of America,5Oceanographic Institute at the University of São Paulo, Praça do Oceanográfico 191, São Paulo, SP 05508-120, Brazil,6Helmholtz Centre for Ocean Research Kiel (GEOMAR), Düsternbrooker Weg 20, 24105 Kiel, Germany
¤ Current address: Institute F.-A. Forel, University of Geneva, Boulevard Carl-Vogt, 66, 1211 Geneva, Switzerland
*mlebrato13@gmail.com
Abstract
Coccolithophores are a vital part of oceanic phytoplankton assemblages that produce organic matter and calcium carbonate (CaCO3) containing traces of other elements (i.e. Sr and Mg). Their associated carbon export from the euphotic zone to the oceans' interior plays a crucial role in CO2feedback mechanisms and biogeochemical cycles. The cocco- lithophoreEmiliania huxleyihas been widely studied as a model organism to understand physiological, biogeochemical, and ecological processes in marine sciences. Here, we show the inter-strain variability in physiological and biogeochemical traits in 13 strains ofE.
huxleyifrom various biogeographical provinces obtained from culture collections commonly used in the literature. Our results demonstrate that inter-strain genetic variability has greater potential to induce larger phenotypic differences than the phenotypic plasticity of single strains cultured under a broad range of variable environmental conditions. The range of var- iation found in physiological parameters and calcite Sr:Ca highlights the need to reconsider phenotypic variability in paleoproxy calibrations and model parameterizations to adequately translate findings from single strain laboratory experiments to the real ocean.
Introduction
The coccolithophore speciesEmiliania huxleyibelongs to a group of unicellular photosynthetic protists covered by plates of calcite (CaCO3) termed coccoliths [1]. Coccolithophores are major producers of CaCO3[2] and key players in the Earth's climate system [3]. They contrib- ute to the biological carbon pump via the combined effects of calcification, photosynthesis, and the downward transport of particulate material to the oceans' interior [4]. Although there are numerous extant coccolithophore species,E.huxleyiis used as a model species in many a11111
OPEN ACCESS
Citation:Blanco-Ameijeiras S, Lebrato M, Stoll HM, Iglesias-Rodriguez D, Müller MN, Méndez-Vicente A, et al. (2016) Phenotypic Variability in the
CoccolithophoreEmiliania huxleyi. PLoS ONE 11(6):
e0157697. doi:10.1371/journal.pone.0157697 Editor:Francisco Rodriguez-Valera, Universidad Miguel Hernandez, SPAIN
Received:October 17, 2015 Accepted:June 2, 2016 Published:June 27, 2016
Copyright:© 2016 Blanco-Ameijeiras et al. This is an open access article distributed under the terms of theCreative Commons Attribution License, which permits unrestricted use, distribution, and reproduction in any medium, provided the original author and source are credited.
Data Availability Statement:All relevant data are within the paper and its Supporting Information files.
Funding:This work was funded by the "European Project on Ocean Acidification" (EPOCA) (which received funding from the European Community's Seventh Framework Program (FP7/2007-2013) under grant agreement n° 211384) and partly by the Helmholtz Centre for Ocean Research Kiel (GEOMAR) and by the Center of Excellence "The Future Ocean" to ML; the Abbey-Santander Internationalization Fund, University of Basque Country (UPV/EHU), and Ministry of Science and Education (Government of Spain) to SBA; the
physiological [5], ecological [6], oceanographic [7], paleoceanographic [8], and modelling stud- ies [9] because of its global importance and the ease to culture it under a broad range of envi- ronmental conditions [10].
Emiliania huxleyiharbors a genome constituted by core genes plus genes distributed vari- ably amongst strains, which supports a considerable intra-species variability [11]. This enables E.huxleyito form large seasonal blooms in temperate waters and subpolar regions under a wide variety of environmental conditions [12]. Based on the morphological identity of the coc- coliths,E.huxleyiis separated in seven morphotypes [13], although the relationship between geographic origin and morphotype genetic distance is unclear [14]. Within the species concept ofE.huxleyi, numerous diploid non-calcifying cells have been identified which lost the ability to form calcified scales following prolonged culture [10,15] or unfavorable experimental con- ditions [16]. Taking into account the morphological diversity found within the species concept ofE.huxleyia high physiological variability is expected.
The cosmopolitan distribution and bloom-forming capacity ofE.huxleyi[12], its distinct optical features [17] and sinking properties [18,19] makeE.huxleyia suitable model organism for parameterization studies in Earth System modelling. The biogeochemical signature ofE.
huxleyi's coccoliths is used to develop paleoproxies because of their abundant fossil record starting in the Quaternary [20,21]. The abundance of trace elements replacing Ca ions in cal- cite, such as strontium (Sr) and magnesium (Mg) is driven by thermodynamic, kinetic, and biological factors, facilitating the development of paleoproxies based on the ratio between the element of interest and calcium. The Sr:Ca ratio is used to estimate coccolithophore productiv- ity [22], and the Mg:Ca ratio is used to reconstruct seawater temperature [23,24] and track CO2[25].Recently, the incorporation of boron (B) in the calcite has been related to seawater pH [26]. However, phenotypic variability in coccolith elemental ratios is virtually impossible to address in sediment samples because only morphotypes can be differentiated.
In this study we characterize intra-species phenotypic variation and its implications in 13 strains ofE.huxleyimeasuring physiological parameters (growth rate, particulate organic and inorganic carbon content [POC and PIC], particulate inorganic: organic carbon [PIC:POC], particulate carbon:nitrogen [C:N]) and coccolith geochemistry (Sr:Ca and Mg:Ca ratios). The high variability observed in our results highlights the importance of account for inter-strain variability when usingE.huxleyias a model organism in marine studies ranging from experi- mental work to past ocean reconstructions and model parameterizations.
Material and Methods Experimental work
Monoclonal cultures of 13E.huxleyistrains were obtained from the Provasoli-Guillard National Center for Marine Algae and Microbiota (NCMA), the Roscoff Culture Collection (RCC), the Algobank-Caen and the Microalgal Culture Collection and the Plymouth Culture Collection of Marine Algae. Nine coccolith-bearing strains, including three morphotypes (A, B and R; seeTable 1), and four non-calcifying strains from various latitudes were grown in semi continuous batch cultures under identical conditions (Table 1). Strain morphotype identifica- tion followed previously published studies [15,27,28,29]. Cultures were maintained at 19.15
±0.75°C (Table 1), with a 12:12h light:dark cycle under light irradiance of 126.03 ±8.96μmol quanta m-2s-1supplied by cool-white fluorescent lamps (Osram LUMILUX) and determined using a LI-COR (LI-189) Quantum Sensor (Q 39308). The cultures were daily agitated by manual swirling. Culture medium was prepared from coastal Atlantic Ocean filter-sterilized (0.22μm) natural seawater. Salinity was determined using a refractometer. Filtered seawater was enriched with 91.4μM of NaNO3, 5.3μM of NaH2PO4(Table 1) [30–32], and trace metals
Conselho Nacional de Desenvolvimento Científico e Tecnológico Brasil (CNPq, Processo: 405585/2013-6) to MNM; and ERC-STG-240222PACE for funding HS and AMV. Strains RCC1212 and RCC1258 were obtained from the RCC through the ASSEMBLE program (FP7-227799). The funders had no role in study design, data collection and analysis, decision to publish, or preparation of the manuscript.
Competing Interests:The authors have declared that no competing interests exist.
and vitamins were added according to f/2 medium [33]. Triplicate flasks containing medium were inoculated with cultures in exponential growth phase pre-acclimated for a minimum of 8 generations. Cells were inoculated at ~100 cell ml-1and harvested at cell densities of 28,000
±5,000 cell ml-1to minimize changes in carbonate chemistry and nutrient availability that could potentially lead to CO2and/or nutrient limitation.
Cell density, pH, salinity and irradiance were monitored during the incubations. Dailyin-situ pHtotaland temperature were determined on sub-samples using a pH-meter with a temperature
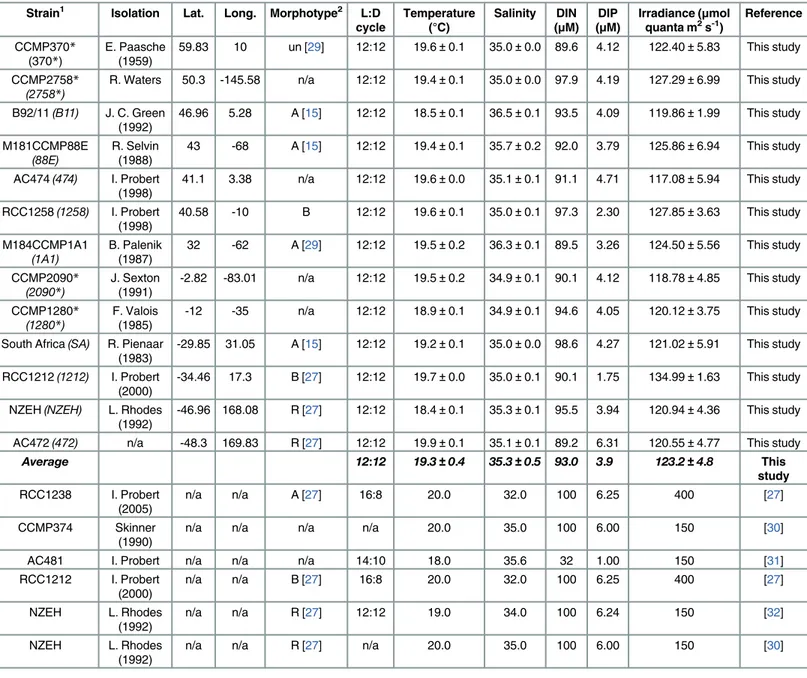
Table 1. Origin of theEmiliania huxleyistrains and environmental culture conditions.
Strain1 Isolation Lat. Long. Morphotype2 L:D
cycle Temperature
(°C) Salinity DIN (μM) DIP
(μM) Irradiance (μmol
quanta m2s-1) Reference CCMP370*
(370*) E. Paasche
(1959) 59.83 10 un [29] 12:12 19.6±0.1 35.0±0.0 89.6 4.12 122.40±5.83 This study CCMP2758*
(2758*) R. Waters 50.3 -145.58 n/a 12:12 19.4±0.1 35.0±0.0 97.9 4.19 127.29±6.99 This study
B92/11(B11) J. C. Green
(1992) 46.96 5.28 A [15] 12:12 18.5±0.1 36.5±0.1 93.5 4.09 119.86±1.99 This study M181CCMP88E
(88E) R. Selvin
(1988) 43 -68 A [15] 12:12 19.4±0.1 35.7±0.2 92.0 3.79 125.86±6.94 This study AC474(474) I. Probert
(1998) 41.1 3.38 n/a 12:12 19.6±0.0 35.1±0.1 91.1 4.71 117.08±5.94 This study RCC1258(1258) I. Probert
(1998) 40.58 -10 B 12:12 19.6±0.1 35.0±0.1 97.3 2.30 127.85±3.63 This study M184CCMP1A1
(1A1) B. Palenik
(1987) 32 -62 A [29] 12:12 19.5±0.2 36.3±0.1 89.5 3.26 124.50±5.56 This study CCMP2090*
(2090*) J. Sexton
(1991) -2.82 -83.01 n/a 12:12 19.5±0.2 34.9±0.1 90.1 4.12 118.78±4.85 This study CCMP1280*
(1280*) F. Valois
(1985) -12 -35 n/a 12:12 18.9±0.1 34.9±0.1 94.6 4.05 120.12±3.75 This study South Africa(SA) R. Pienaar
(1983) -29.85 31.05 A [15] 12:12 19.2±0.1 35.0±0.0 98.6 4.27 121.02±5.91 This study RCC1212(1212) I. Probert
(2000) -34.46 17.3 B [27] 12:12 19.7±0.0 35.0±0.1 90.1 1.75 134.99±1.63 This study NZEH(NZEH) L. Rhodes
(1992) -46.96 168.08 R [27] 12:12 18.4±0.1 35.3±0.1 95.5 3.94 120.94±4.36 This study AC472(472) n/a -48.3 169.83 R [27] 12:12 19.9±0.1 35.1±0.1 89.2 6.31 120.55±4.77 This study
Average 12:12 19.3±0.4 35.3±0.5 93.0 3.9 123.2±4.8 This
study RCC1238 I. Probert
(2005) n/a n/a A [27] 16:8 20.0 32.0 100 6.25 400 [27]
CCMP374 Skinner
(1990) n/a n/a n/a n/a 20.0 35.0 100 6.00 150 [30]
AC481 I. Probert n/a n/a n/a 14:10 18.0 35.6 32 1.00 150 [31]
RCC1212 I. Probert (2000)
n/a n/a B [27] 16:8 20.0 32.0 100 6.25 400 [27]
NZEH L. Rhodes
(1992)
n/a n/a R [27] 12:12 19.0 34.0 100 6.24 150 [32]
NZEH L. Rhodes
(1992)
n/a n/a R [27] n/a 20.0 35.0 100 6.00 150 [30]
(1)Strain name in backets and italics correspond to the abreviations used in Figs3and4.
*Indicates the non-calcifying strains.
(2)Morphotypes classification extracted from the literature and references.
(un) undetermined. (n/a) no data available.
doi:10.1371/journal.pone.0157697.t001
probe (EUTECH EcoScan—pH/mV/°C) (S1 Table). During the experiments the medium car- bon chemistry was measured for each replicate flask. Both, daily monitoring and final harvesting were performed at the same time of the day within a 3–5 h interval after the start of the light phase.
Inorganic elemental chemistry
The seawater carbonate system parameters were calculated from temperature, salinity, and the concentration of dissolved inorganic carbon (DIC), total alkalinity (TA) and phosphate using the software CO2SYS [34] (S1 Table). Total alkalinity and DIC were determined using the (Versatile INstrument for the Determination of Tritation Alkalinity) VINDTA, calibrated with Certified Reference Material (CRM) for oceanic CO2measurements, Marine Physics Labora- tory of Scripps Institute of Oceanography, University of San Diego, following Mintrop [35].
Precisions for TA and DIC were ±7.45μmol kg-1and ±4.7μmol kg-1, respectively.
Dissolved inorganic nitrate (DIN) and dissolved inorganic phosphate (DIP) were deter- mined according to Hansen and Koroleff [36] using a HITACHI U-2000 Spectrophotometer at the GEOMAR, Kiel, Germany. The precisions for DIN and DIP were ±0.1μM and ±0.02μM, respectively.
In order to measure calcite Sr:Ca and Mg:Ca ratios cells were concentrated by centrifugation of ~1.5 l of culture at 1970×g for 20 min using a Hettich ROTANTA 460RS Centrifuge, and subsequent freeze drying of the pellet. Before analysis, the samples were treated to remove organic-Mg cellular phases with hydroxylamine-hydrochloride (NH2OH!HCl + NH4OH) fol- lowed by three consecutive oxidation steps (using H2O2) according to Blanco-Ameijeiraset al.
[37]. The samples were dissolved in 50μl of ultrapure 2% HNO3and diluted to 500μl with Milli-Q. Elemental composition of the samples was determined using the ThermoiCAP 6300 Series ICP Spectrometer, at the Geology Faculty of the University of Oviedo (Spain). All sam- ples were diluted to a common Ca concentration, seeking the highest possible value within the range of standard calibration solutions (Ca = 15, 50, 100 ppm). Calibrations were performed with multi-element standards offline using the intensity ratio method described in de Villiers et al. [38].
Seawater Sr:Ca and Mg:Ca ratios were determined separately by the method of standards addition in culture medium samples filtered through 0.22μm, diluted to 1:200 and 1:10 respec- tively and measured with a ThermoiCap 6300 Series ICP spectrometer as described above. The partition coefficients of Sr (DSr) and Mg (DMg) between coccolith calcite and seawater were cal- culated followingEq 1, wherexis the trace element of interest.
Dx ¼
x Ca
! "
calcite x Ca
! "
seawater
ð1Þ
Growth rates and cell morphometrics
Cells were counted using a ZEISS Axioskop 40 light microscope with 200×magnification in a Neubauer haemocytometer (0.1 mm depth; 0.0025 mm3). Growth rate (μ) was calculated fol- lowingEq 2, where c0and c1are the cell concentrations at the beginning and at the end of the experiment, respectively, andΔtis the period of incubation in days. Growth rate was deter- mined as the average counts on triplicate measurements.
m¼ðLogeC1%LogeC0Þ
Dt ð2Þ
Determination of coccosphere and cell volume was performed on a Beckman Coulter Multi- sizer III,fitted with an aperture tube orifice diameter of 70μm. Analyses were performed with the program MULTI 32 program (Beckman Coulter). Coccospheres were decalcified to deter- mine the cell volume by adding HCl to culture aliquots until pH 5.0 was reached, which results in coccolith dissolution. After two minutes, the pH was rapidly readjusted to its original value in the culture by adding of 100 mM NaOH, following a modified version of the method described by Linschootenet al. [39]. Cell integrity was checked with the optical microscope with 400×magnification.
Particulate carbon analysis
Samples for total particulate carbon (TPC), particulate organic carbon (POC), total particulate nitrogen (TPN), and particulate organic nitrogen (PON) were prepared by filtering aliquots onto pre-combusted 25 mm GF/F filters, followed by storage at -20°C until required for subse- quent analysis. The samples for POC and PON analysis were fumed with sulfurous acid for 24 h [40] to remove particulate inorganic carbon (PIC) from the filters. The filters were dried at 60°C for 24 h, packaged in pre-combusted aluminum foil [41], and analyzed on a Thermo Fin- negan flash EA1112 elemental analyzer using acetanilide as the calibration standard. PIC was calculated as the subtraction of POC from TPC. Inorganic and organic carbon production (Prod) were calculated according toEq 3and expressed in pg C cell-1d-1.
Prod¼ m&cellular carbon content ð3Þ In addition, calcium (from the PIC) was measured using a ThermoiCap 6300 Series ICP Spectrometer to determine PIC assuming that Ca concentration in organic phases is negligible.
The two methods to measure PIC were compared to each other because both are widely used in the literature and results are often assumed to be comparable (see details and discussion in S1 Notes,S1 Fig).
Data analyses
Averaged values are given by the statistical mean and the standard deviation (SD) of three rep- licate samples per treatment. One-way analysis of variance (ANOVA) was used to test that the differences in biogeochemical parameters (coccosphere volume, cell volume, growth rate, par- ticulate carbon and nitrogen cell quotas, particulate carbon production, stoichiometric ratios and DSr) between strains were statistically different. Correlation of the biogeochemical parame- ters was determined using the Pearson product-moment correlation coefficient (r). Statistical analyses were performed using SigmaPlot (Systat Software, San Jose, CA).
Results
Culture conditions
The average seawater pHtotalfor all the strains was 7.97 ± 0.04,pCO2was 479.82 ± 37.96μatm, total alkalinity (TA) was 2272.40 ± 18.04μmol kg-1, dissolved inorganic carbon (DIC) was 2055.39 ± 13.16μmol kg-1andO-Calcite was 3.75 ± 0.25 (S1 Table). The shift in DIC due to cells consumption and production of inorganic carbon was<2.5%. Average nitrate concentra- tion was 93.0 ± 3.4μM and average phosphate concentration was 3.9 ± 1.1μM (Table 1). Irra- diance during the incubation oscillated between 117.08 ±5.94 and 134.99 ±1.63μmol quanta m2s-1and the average temperature during the incubation was 19.32 ±0.45°C.
Physiological parameters
Cellular volume. Coccosphere (cell + coccoliths) volume was statistically different between strains (P<0.001) varying between 46.18 ±3.58μm3(M184CCMP1A1) and 121.45
±25.82μm3(RCC1212) (Table 2). After coccoliths dissolution, the cell volume varied between 34.13 ±0.10 (B92/11) and 92.18 ±12.48μm3(RCC1212) (Fig 1). Inter-strain differences in cell volume were statistically different between strains (P<0.001).
Growth rate (μ). The growth rate ofE.huxleyistrains was significantly different between strains (P<0.001). It ranged from 0.53 ±0.01 d-1to 1.45 ±0.01 d-1(Fig 1). The fastest growth rate was observed in NZEH and the lowest in the non-calcifying strain CCMP1280. Non-calci- fying strains showed lower growth rates between 0.53 ±0.01 d-1and 0.93 ±0.02 d-1, whilst those of calcifying strains varied between 0.67 ±0.01 and 1.45 ±0.01 d-1(Table 2). Growth rate of non-calcifying strains was on average 19.28% lower than in calcifying strains (P = 0.015).
Growth rate was inversely correlated with coccosphere volume, cell volume and PIC cell quota (r = -0.522, -0.479 and -0.481, respectively; P<0.05) (S2 Table).
Particulate carbon. POC cell quota ranged from 4.56 ±0.28 to 23.04 ±1.80 pg C cell-1in the strains South Africa and RCC1212, respectively (Fig 1). Amongst the calcifying strains, PIC cell quota ranged from 0.59 ±0.64 to 12.49 ±1.54 pg C cell-1in strains M184CCMP1A1 and RCC1212, respectively. These two parameters were directly correlated (r = 0.727; P<0.05).
PIC cell quotas showed a direct correlation with coccosphere size and cell volume (r= 0.788 and 0.847, respectively;P<0.05). Similarly, POC cell quota was positively correlated with coc- cosphere volume and cell volume (r= 0.691 and 0.725;P<0.05). Production of POC ranged
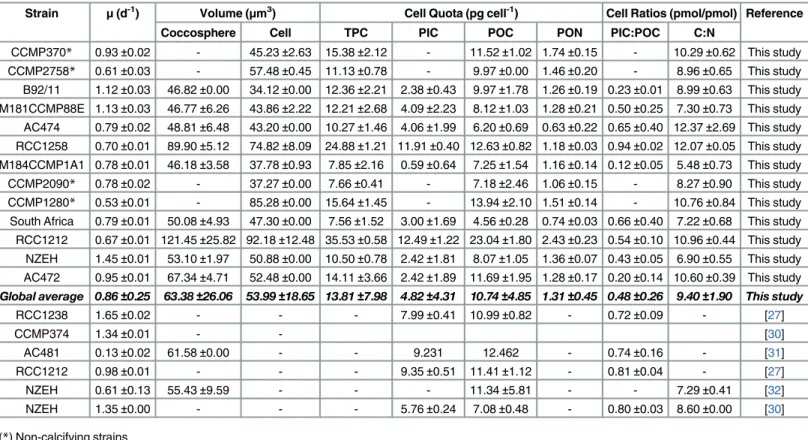
Table 2. Physiological parameters measured in this study and collected from the literature.
Strain μ(d-1) Volume (μm3) Cell Quota (pg cell-1) Cell Ratios (pmol/pmol) Reference
Coccosphere Cell TPC PIC POC PON PIC:POC C:N
CCMP370* 0.93±0.02 - 45.23±2.63 15.38±2.12 - 11.52±1.02 1.74±0.15 - 10.29±0.62 This study
CCMP2758* 0.61±0.03 - 57.48±0.45 11.13±0.78 - 9.97±0.00 1.46±0.20 - 8.96±0.65 This study
B92/11 1.12±0.03 46.82±0.00 34.12±0.00 12.36±2.21 2.38±0.43 9.97±1.78 1.26±0.19 0.23±0.01 8.99±0.63 This study M181CCMP88E 1.13±0.03 46.77±6.26 43.86±2.22 12.21±2.68 4.09±2.23 8.12±1.03 1.28±0.21 0.50±0.25 7.30±0.73 This study AC474 0.79±0.02 48.81±6.48 43.20±0.00 10.27±1.46 4.06±1.99 6.20±0.69 0.63±0.22 0.65±0.40 12.37±2.69 This study RCC1258 0.70±0.01 89.90±5.12 74.82±8.09 24.88±1.21 11.91±0.40 12.63±0.82 1.18±0.03 0.94±0.02 12.07±0.05 This study M184CCMP1A1 0.78±0.01 46.18±3.58 37.78±0.93 7.85±2.16 0.59±0.64 7.25±1.54 1.16±0.14 0.12±0.05 5.48±0.73 This study
CCMP2090* 0.78±0.02 - 37.27±0.00 7.66±0.41 - 7.18±2.46 1.06±0.15 - 8.27±0.90 This study
CCMP1280* 0.53±0.01 - 85.28±0.00 15.64±1.45 - 13.94±2.10 1.51±0.14 - 10.76±0.84 This study South Africa 0.79±0.01 50.08±4.93 47.30±0.00 7.56±1.52 3.00±1.69 4.56±0.28 0.74±0.03 0.66±0.40 7.22±0.68 This study RCC1212 0.67±0.01 121.45±25.82 92.18±12.48 35.53±0.58 12.49±1.22 23.04±1.80 2.43±0.23 0.54±0.10 10.96±0.44 This study NZEH 1.45±0.01 53.10±1.97 50.88±0.00 10.50±0.78 2.42±1.81 8.07±1.05 1.36±0.07 0.43±0.05 6.90±0.55 This study AC472 0.95±0.01 67.34±4.71 52.48±0.00 14.11±3.66 2.42±1.89 11.69±1.95 1.28±0.17 0.20±0.14 10.60±0.39 This study Global average 0.86±0.25 63.38±26.06 53.99±18.65 13.81±7.98 4.82±4.31 10.74±4.85 1.31±0.45 0.48±0.26 9.40±1.90 This study
RCC1238 1.65±0.02 - - - 7.99±0.41 10.99±0.82 - 0.72±0.09 - [27]
CCMP374 1.34±0.01 - - [30]
AC481 0.13±0.02 61.58±0.00 - - 9.231 12.462 - 0.74±0.16 - [31]
RCC1212 0.98±0.01 - - - 9.35±0.51 11.41±1.12 - 0.81±0.04 - [27]
NZEH 0.61±0.13 55.43±9.59 - - - 11.34±5.81 - - 7.29±0.41 [32]
NZEH 1.35±0.00 - - - 5.76±0.24 7.08±0.48 - 0.80±0.03 8.60±0.00 [30]
(*) Non-calcifying strains doi:10.1371/journal.pone.0157697.t002
Fig 1. Histogram of three physiological parameters.(A) Cell size; cell volume (grey area) and coccolith layer (white area), which includes the attached coccoliths; (B) Growth rate (μ) and particulate organic and inorganic carbon cell quota; and (C) particulate organic and inorganic carbon production, comparing the13 strains grown under identical environmental conditions. (*) Indicates non-calcifying strains. Characters at the base of the bars indicate the morphotype corresponding to each strain.“n/a”indicates that there is not an
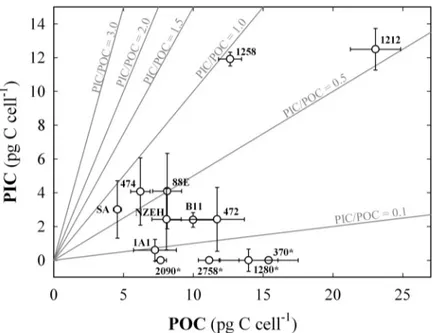
from 3.62 ±0.22 pg C cell-1d-1in South Africa strain to 15.62 ±1.25 in RCC1212, and PIC pro- duction ranged from 0.69 ±0.45 pg C cell-1d-1in M184CCMP1A1to 8.46 ±0.81 pg C cell-1d-1 in RCC1212 (Fig 1). The average PIC:POC ratio for the calcifying strains was 0.48 ±0.26 (Fig 2). The highest values of PIC:POC were observed in RCC1258 (0.94 ±0.02) and South Africa (0.66 ±0.40) strains (Fig 3). All the particulate carbon parameters tested for theE.huxleyiwere statistically different between strains (P<0.001), with exception of PIC/POC were P = 0.127 (S2 Table).
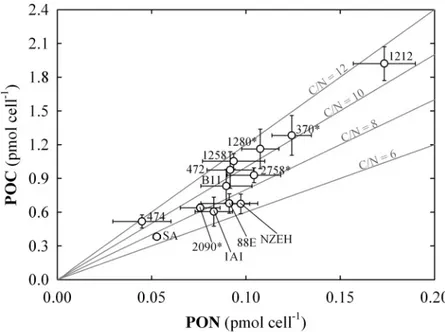
Particulate Nitrogen. Average PON was 1.31 ±0.45 pg N cell-1for the 13 strains used in this study. The range of variation was between 0.63 ±0.22 and 2.43 ±0.23 pg N cell-1. The PON showed a direct significant correlation with POC and PIC cell quota, and cell volume (r = 0.917; 0.559 and 0.583, respectively; P<0.05). The carbon to nitrogen ratio (C:N) ranged between 5.48 ±0.73 to 12.37 ±2.69, observed in NZEH and AC474, respectively. Average C:N for all theE.huxleyistrains was 9.40 ±1.90 pmol:pmol (Fig 3). The C:N ratio was inversely cor- related with growth rate (r = -0.451; P<0.05). Both, PON and C:N were statistically different between strains (P<0.001).
Biogeochemical variation in calcite composition
Calcite Sr:Ca ratio was measured in triplicates in the 9 calcifying strains ofE.huxleyi (NZEH, RCC1212, South Africa, AC474, AC472, RCC1258, B92/11, M184CCMP1A1 and M181CCMP88E). Average Sr:Ca was 3.28 ± 0.32 mmol:mol (Table 3) and the individual sam- ples ranged from 2.75 ± 0.06 to 3.71 ± 0.03 mmol:mol (Fig 4). The strontium-partitioning
available morphotype classification for that strain. Values were calculated as averages of three replicates.
Error bars represent standard deviation between replicates.
doi:10.1371/journal.pone.0157697.g001
Fig 2. Particulate organic and inorganic carbon cell quota proportions for the 13 strains.Each value includes three replicates while the error bars represent the standard deviation. The numbers next to the symbols indicate the strain code. (*) indicates non-calcifying strains. Grey lines indicate the different particulate inorganic to organic carbon ratios (PIC:POC).
doi:10.1371/journal.pone.0157697.g002
coefficient (DSr) ranged from 0.350 ± 0.007 to 0.475 ± 0.004. Both, Sr:Ca and DSrwere statisti- cally different between strains (P<0.001 and P = 0.034, respectively). The average calcite Mg:
Ca was 0.39 ± 0.06 mmol:mol (Table 2). The indicators of organic phase’s contamination (phosphorus (P):Ca and iron (Fe):Ca) [37] were below 6.5 and 41 mmol:mol, respectively.
Fig 3. Particulate carbon to particulate nitrogen ratio (C:N) cell quotas.Each value includes three replicates (error bars represent the standard deviation). The numbers next to the symbols indicate the strain code. (*) indicates non-calcifying strains. Continuous grey lines indicate the different C:N.
doi:10.1371/journal.pone.0157697.g003
Table 3. Magnesium (Mg) and strontium (Sr) concentrations in culture medium and in coccolithophore calcite, and the corresponding partitioning coefficients (Drx).
Strain na Ca testb Seawater Calcite (mmol/mol) Contamination proxy (mmol/mol) Partitioning coeficient
Mg:Cac Sr:Cad Mg:Caa Sr:Cae P:Caa Fe:Caa DMga DSre
NZEH 2 19±1 5.52 7.66 0.15±0.01 2.86±0.03 0.80±0.23 8.34±5.64 0.027±0.003 0.374±0.004 RCC1212 2 21±2 5.59 7.71 0.45±0.11 3.17±0.06 1.28±0.14 40.53±6.54 0.081±0.027 0.394±0.007 South Africa 1 17±0 5.60 7.74 0.55±0.00 2.75±0.06 6.10±1.16 30.37±4.03 0.099±0.000 0.350±0.007 AC474 3 23±21 5.62 7.81 11.76±6.25 3.71±0.03 250.56±164.49 723.37±474.17 2.091±1.298 0.475±0.004 AC472 2 115±18 5.63 7.87 5.46±0.64 3.37±0.06 114.30±14.15 190.88±16.13 0.970±0.149 0.428±0.008 RCC1258 3 130±25 5.58 7.75 6.17±0.30 3.26±0.03 40.70±11.40 221.34±75.75 1.102±0.061 0.421±0.004 B92/11 2 16±1 5.59 7.68 8.01±2.01 3.29±0.23 266.40±60.70 755.41±165.53 1.434±0.475 0.428±0.029 M184CCMP1A1 3 14±9 5.62 7.74 13.11±4.38 3.56±0.40 261.15±141.57 836.15±430.74 2.333±0.867 0.460±0.051 M181CCMP88E 3 6±6 5.59 7.71 17.57±3.99 3.55±0.54 240.69±122.57 1107.04±141.92 3.143±0.452 0.460±0.070 Average 5.59±0.03 7.74±0.07 0.39§±0.06 3.28±0.32 - - 0.069§±0.037 0.421§±0.042
(a)number the of samples considered after removal of organic phases for Mg/Ca, P/Ca, Fe/Ca and DMg;
(b)Indicates the concentration of calcium in the sample (ppm) after removal of organic phases;
(c)mol/mol;
(d)mmol/mol;
(e)values calculated from 3 replicates;
(§)Mean value of the strains NZEH, RCC1212 and South Africa, accepted as effectively clean of organic phases.
doi:10.1371/journal.pone.0157697.t003
Discussion
Experimental set-up considerations
Many experiments have investigated the physiological response ofE.huxleyiunder future ocean acidification scenarios obtaining contrasting results (summary in [9]) but recently a unifying concept was developed [43], showing that the shifting in optimalpCO2observed in different strains is also affected by culture conditions such as light and temperature [43].
Intra-species variability has been suggested as key factor for the recorded variability in physio- logical responses [9,27,44]. However, the large variety of experimental set ups, environmental conditions and different investigated strains hamper any attempt to estimate the magnitude of this phenotypic variability. Our approach suggests that phenotypic variability of physiologi- cal and biogeochemical traits between strains grown under identical environmental condi- tions may reflect genotypic differences. Thus, we examined phenotypic variability amongst 13 strains representative of different ocean biogeographic provinces grown under identical cul- ture conditions.
We acknowledge that the chosen environmental conditions do not reflect strain specific optimal conditions neither do they represent the biogeographic conditions at the site of isola- tion. Some of the investigated strains have been maintained in culture collections for decades.
For example, strain“South Africa”(Table 1) has been kept in culture for 30 years. In these cases, the genetic drift and adaptation to culture conditions over time represents a potential bias given that the phenotype of the strains investigated may no longer accurately represent the initially isolated cells. In general, older cultures are more likely to have departed from their
“natural state”than newer isolates, especially in terms of traits that are not under selection under culture conditions [45]. Yet, most of the strains were widely used in many research stud- ies during the last 20 years (Table 1). Therefore, our results (S2 Table) are relevant for compari- son of literature strain-specific responses.
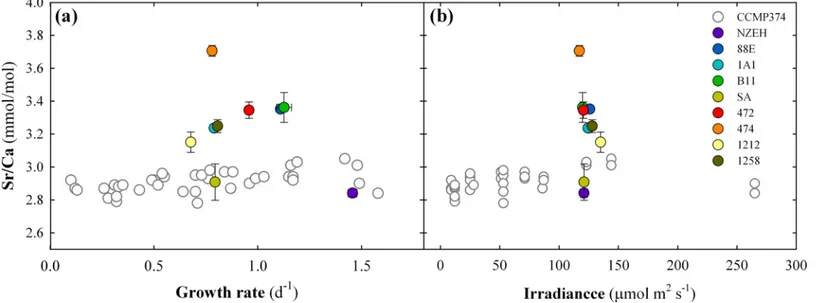
Fig 4. Comparison of the strontium to calcium ratios (Sr:Ca) from the 9 calcifying strains with the Sr:Ca from a single strain cultured under different irradiance levels.White symbols represent single values compiled from Stollet al. [42]. Colored symbols represent mean values of three replicates obtained from our laboratory cultures. Error bars are standard deviation of three replicates.
doi:10.1371/journal.pone.0157697.g004
Biogeographic considerations
Despite several studies showing a genetic separation between strains originating in the north- ern and southern hemisphere [12,14,13], physiological and biogeochemical parameters mea- sured in our experiments do not separate between strains from the two hemispheres. For instance, the two B morphotypes included in this study, strain 1212 (from southern hemi- sphere) and 1258 (from northern hemisphere), showed similar biogeochemical properties (S2 Table). The morphometric analysis performed here suggests that A type strains have typically small volumes and that B type strains possess the largest cell volumes (Fig 1). However, the small number of strains used in this study might prevent us from drawing conclusive results in relation to the biogeographic origin of the strains.
Latitudinal origin of isolation was not reflected in the variation of physiological parameters or morphotype identities. Thus, at ~19°C we would expect to find strains from mid-latitudes growing at optimum conditions, while the same temperature for strains isolated at high lati- tudes might be the upper or lower threshold for growth depending on the average annual tem- perature at the site of isolation [46,47]. However, other physico-chemical parameters such as light regimes and seawater CO2concentrations could shift the maximum peaks of the physio- logical and biogeochemical properties under the same temperature [25,43,48]. Our results are in line with those obtained by Reidet al. [49], where functional diversity based on enzyme activity assays of 52 strains ofE.huxleyishowed no significant effects of strains grouped according to biogeographic origin.
Strain-specific significance in biogeochemical cycling of elements A mechanistic relationship between particulate organic and inorganic carbon, and growth rates was suggested by Buitenhuiset al. [50]. However, we only find a moderate inverse correla- tion between growth rate and cell volume (r = -0.479; P = 0.002), POC production (r = -0.59;
P<0.001) and C:N (r = -0.441; P = 0.005). Our results suggest that strains with higher cell vol-
ume entail lower growth rate and higher carbon production (r>0.73; P<0.001) (S2 Table).
Therefore, the PIC and POC production are strongly determined by cell volume, and hence PIC and POC cell quota. The variation of PIC and POC production, and the PIC:POC ratios are in agreement with values previously reported in the literature [27,32].
It is surprising that the range of strain-specific phenotypic variability for the different parameters determined here is much higher than the maximum variation registered in previ- ous studies for a single strain growing under increasing concentrations of seawater CO2[27].
For instance, the maximum variation of growth rate, POC and PIC cell quota, within a range of about 900μatm of CO2, determined by Langeret al. [27], corresponds to only 49, 25, and 23%, respectively, of the variation determined in the present study for 9 strains under identical envi- ronmental conditions. This suggests that the inter-strain genetic variability has greater poten- tial to induce larger phenotypic differences than the phenotypic plasticity of a single strain cultured under a broad range of variable environmental conditions. In the ocean, the shifts in PIC:POC ratios in a population are likely to be more strongly controlled by the changes in pop- ulation composition (dominating strains) than the plasticity of PIC:POC of a given strain as suggested by the results obtained by Beaufortet al. [51]. Thus, the combination of strain-spe- cific values of organic and inorganic carbon cell quotas, and growth rates represent the strain- specific biogeochemical signature with potential to specifically contribute to the biological car- bon pump when it dominates large blooms (Fig 1).
The range of C:N variability determined in this study (between 5.48 and 12.37) covers the systematic variation between phytoplankton groups reported in Quigget al. [52]. Interestingly, the direct correlation between C:N ratios and cell volume (r = 0.47, P<0.005), along with the
inverse correlation with growth rate (r = -0.44, P = 0.005), reveals hints on the implication of cell size on biogeochemical cycling of elements [53]. Thus, the nitrogen remineralization rate in the water column could be largely affected by cell volume, which is strain-specific. The strain-specific stoichiometric variations have implications on the export of carbon and other elements (N, P, etc.) to the deep ocean.
Coccolithophores are commonly integrated in biogeochemical models because they domi- nate pelagic PIC production and export. Models largely rely on the limited experimental data- sets available for PIC production. Extrapolations from experimental work on single strains might lead to over/underestimated results when not taking into account the genetic diversity and ecophysiological plasticity within the species [43,48]. For instance, if we compare the range variation of PIC:POC ratios recorded in our study (between 0.12±0.05 and 0.94±0.02) with the parameterization used by Gehlenet al. [54] this issue becomes evident. The range of PIC:POC variation registered in our study with saturation state with respect to calcite (OCalcite)
= 3.75±0.25 was 1.2-fold larger than that recorded for a single strain ofE.huxleyi(0.3–1.0 [55]) within range from 2 to 10OCalcite, and for a mesocosm bloom dominated by the same species (0.3–0.9 [56]). Therefore, finding a way to includeE.huxleyi's functional diversity in biogeo- chemical models is essential to improve our understanding about the role of this species on global biogeochemical cycling of elements and the effect of climate change-driven selection on the populations. However, the lack of systematic biogeographic information on physiological parameters complicates the integration into models.
Strain-specific elemental chemistry
The calcite Sr:Ca ratio for each strain was well within the range of reported values from other culture experiments [42,57]. No correlation was found between calcite Sr:Ca ratios, growth rates, cell and coccosphere volume, and calcification rates (P>0.05). However, it should be noted that six strains (excluding the three outermost calcite Sr:Ca of strains AC474, SA and NZEH) follow a positive trend of increasing calcite Sr:Ca along with increasing growth rate, as previously described by Stollet al. [58]. The range of variation of calcite Sr:Ca for the 9 calcify- ing strains used for elemental analyses (from 2.75 to 3.57 mmol:mol) was 3 times higher than the Sr:Ca range (2.78 to 3.05 mmol:mol) detected in a single strain ofE.huxleyi(CCMP374) cultured at different light levels [42] (Fig 4). The strains displaying the smallest and largest ratios (SA and AC474, respectively) were not isolated at high latitudes, therefore, we can dis- card the effect of adaptation to a baseline temperature lower than the 19.3°C used in this study.
Since all the strains were cultured under nutrient replete conditions, and harvested during the exponential growth phase, physiological control is assumed to be similar for all strains. Differ- ences in the calcite Sr:Ca ratio may be due to inherent genomic properties controlling seawater Sr transport mechanisms, both, at the level of extracellular membrane and the coccolith vesicle, where calcification takes place [59]. Thus the incorporation of Sr into the calcite lattice ofE.
huxleyiis strain-specific.
The wide calcite Mg:Ca ratio variation was influenced by incomplete removal of organic matter that can bias intra-species comparisons (Table 2) when calcite content is low in relation to POC, i.e., in low calcifying strains [37]. Given that the organic phases of phytoplankton con- tain an order of magnitude more Mg (~560 mmol:mol of P) than, for example, Sr (~54 mmol:
mol of P) [60], removal of organic phases is critical in determining Mg inE.huxleyi[43] owing to the small size of the samples and the low calcite content (~40 ppm Ca; seeTable 2). In our study, only the highest calcifying strains displayed relatively low organic matter content as indicated by the P:Ca and Fe:Ca ratios, which were used as indicators of organic contamination in the calcite samples [37] (Table 2). After the cleaning pre-treatment only 5 samples from 3
strains (SA, 1212 and NZEH) satisfied the requirements established to consider the measure- ment of calcite Mg:Ca ratio as acceptable: (1) Fe:Ca ratio<50 mmol:mol, and (2) P:Ca<6 mmol:mol [37]. We conclude that Mg/Ca ratios cannot be used with confidence forE.huxleyi due to the difficulties to remove organic phases from the samples. We suggest thatE.huxleyiis not a good candidate for measuring calcite Mg:Ca, and thus should not be used to reconstruct any property using the geological record. However, in larger species such asGephyrocapsa oceanica,Coccolithus pelagicus, orCalcidiscus leptoporusthe Mg organic phases are easier to clean, and thus calcite Mg:Ca measurements are more reliable for applications in paleo-recon- structions [25,37].
We show a relationship between intra-species diversity and variability in coccolith geo- chemistry, which is an important factor in proxy calibration of primary productivity (Sr:Ca) [8, 24,25]. In addition, organic biomarker proxies (alkenone-derived carbon isotopes fraction- ation) to determine ancientpCO2scenarios [61] are affected by strain-specific variability on cell volumes and POC quotas [62]. In order to obtain an accurate calibration of productivity, temperature, andpCO2, strain biogeochemical identity within the species concept ofE.huxleyi needs to be considered. Therefore, inter-strain variability will have to be incorporated into the palaeopoxy calibration and its error margins.
Inter-strain complexity driven by strain functional diversity has the potential to mask varia- tions in elemental composition associated to interactions with environmental conditions due to strain-specific acclimation patterns and element discrimination capacity [63]. This complex- ity might limit the direct use of elemental ratios as paleoproxies. However, changes on calcite Sr:Ca could be used to detect and characterize climate driven changes in dominant strains, which could shed light on determining what and how climatic events drive changes in cocco- lithophore community composition and evolution [53].
Implications for climate change and ocean acidification research
The impact of climate change on coccolithophores predicted for the next 100 years as a result of anthropogenic activity will ultimately depend on their capability to adapt. The frequency of environmental changes will determine adaptation; i.e., new beneficial mutations, horizontal gene transfer, or recombination [64,65]. The genetic variability and different metabolic reper- toires ofE.huxleyihave the potential to make this species particularly resilient in novel envi- ronments [11]. Additionally, the phenotypic variability ofE.huxleyishowed in this study constitutes an enormous advantage to mitigate the effects of rapid climate change, since physi- ological functioning of phytoplankton is expected to be phenotypically buffered against such environmental heterogeneity [66]. Thus, high diversity of environmentally induced responses [27,67] has the potential to lead to different evolutionary outcomes [68]. As a counterpoint, the complexity in intra-species resilience, adaptation and competition ofE.huxleyimight com- plicate the application of paleoproxies to reconstruct ancient climate scenarios, predictions of the ocean carbon pump strength and efficiency, the biogeochemical cycles and ecological impacts in future climate scenarios.
Conclusion
Phytoplankton intra-species genetic variability is well studied [69,70]. Yet, this study provides additional evidence of intra-species physiological variability of the coccolithophore species E.huxleyi, revealing strain-specific elemental signatures and growth rates. Thus, it can be expected that blooms dominated by a certain strain have different signatures in the biological pump and the elements they export. Most of the strains included in this study have previously been used in laboratory experiments investigating the response of coccolithophores to
projected global change (increase in seawater CO2, temperature, nutrients) showing variable responses [9]. Our results provide a frame of comparison for the phenotypes that have been used in many laboratory and model studies. In addition, the great variability reflected in the calcite elemental composition and the physiological parameters highlight the need to take in account the intra-species for the calibration of paleo-proxies.
Supporting Information
S1 Fig. Comparison of carbon measurements.We used particulate carbon parameters (PIC, POC and TPC) determined with two different techniques: (1) carbon concentration using an elemental analyzer, and (2) calcium concentration using ICP-AES, and results were compared.
This was done to compare the two most used carbon-measuring techniques in the literature and assess possible errors or deviations.
(DOC)
S1 Notes. Comparison of particulate carbon parameters (PIC, POC and TPC) determined using two different techniques.
(DOC)
S1 Table. Culture medium’s carbonate system of our strains and of published strains.
(DOC)
S2 Table. Pearson product-moment correlation coefficients between all parameters mea- sured on the 13 differentEmiliania huxleyistrains cultured under identical environmental conditions.
(DOC)
Author Contributions
Conceived and designed the experiments: SBA ML DIR AO. Performed the experiments: SBA ML AMV. Analyzed the data: SBA ML. Contributed reagents/materials/analysis tools: ML DIR HMS. Wrote the paper: SBA ML DIR HMS MNM AO.
References
1. Westbroek P, de Jong EW, van der Wal P, Borman AH, de Vrind JPM, Kok D, et al. (1984) Mechanism of Calcification in the Marine AlgaeEmiliania huxleyi. Philosophical Transactions of the Royal Society of London. Series B. Biological Sciences 304: 435–444.
2. Archer D, Winguth A, Lea D, Mahowald N (2000) What caused the glacial/interglacial atmospheric pCO2cycles? Reviews of Geophysics 38: 159–189.
3. Ridgwell A, Zondervan I, Hargreaves JC, Bijma J, Lenton TM (2007) Assessing the potential long-term increase of oceanic fossil fuel CO2uptake due to CO2-calcification feedback. Biogeosciences 4: 481–
492.
4. Westbroek P, Brown CW, Van Bleijswijk J, Brownlee C, Brummer GJ, Conte M, et al. (1993) A model system approach to biological climate forcing. The example ofEmiliania huxleyi. Global and Planetary Change 8: 27–46.
5. Rost B, Zondervan I,Riebesell U (2003) Light-dependent carbon isotope fractionation in the coccolitho- phoridEmiliania huxleyi. Limnology and Oceanography 47: 120–128.
6. Cubillos JC, Wright SW, Nash G, de Salas MF, Griffiths B, Tilbrook B, et al. (2007) Calcification mor- photypes of the coccolithophoridEmiliania huxleyiin the Southen Ocean: changes in the 2001 to 2006 compared to historical data. Marine Ecology Progress Series 348: 47–54.
7. Buitenhuis ET, van der Wal P,de Baar HJW (2001) Blooms ofEmiliania huxleyiare Sinks of atmo- spheric Carbon Dioxide: A Field and Mesocosm Study derived Simulation. Global Biogeochemical Cycles 15: 577–587.
8. Stoll HM, Ziveri P, Schimizu N, Conte M, Theroux S (2007) Relationship between coccolith Sr:Ca ratios and coccolithophore production and export in the Arabian Sea and Sargasso Sea.Deep Sea Research Part II: Tropical Studies in Oceanography 54: 581–600.
9. Ridgwell A, Schmidt DN, Turley C, Brownlee C, Maldonado MT, Tortell P, et al. (2009) From laboratory manipulations to Earth system models: scaling calcification impacts of ocean acidification. Biogeos- ciences 6: 2611–2623.
10. Paasche E (2001) A review of the coccolithophoridEmiliania huxleyi(Prymnesiophyceae), with particu- lar reference to growth, coccolith formation, and calcification-photosynthesis interactions. Phycologia 40: 503–529.
11. Read BA, Kegel J, Klute MJ, Kuo A, Lefebvre SC, Maumus F, et al. (2013) Pan genome of the phyto- planktonEmilianiaunderpins its global distribution. Nature, 499: 209–213. doi:10.1038/nature12221 PMID:23760476
12. Iglesias-Rodriguez MD, Brown CW, Doney SC, Kleypas J, Kolber D, Kolber Z, et al. (2002a) Repre- senting key phytoplankton functional groups in ocean carbon cycle models: Coccolithophorids. Global Biogeochemical Cycles, 16: 1–20.
13. Hagino K, Bendif EM, Young JR, Kogame K, Probert I, Takano Y, et al. (2011) New evidence for mor- phological and genetic variation in the cosmopolitan coccolithophoreEmiliania huxleyi(Prymnesiophy- ceae) from thecox1b-atp4genes. Journal of phycology 47: 1164–1176. doi:10.1111/j.1529-8817.
2011.01053.xPMID:27020197
14. Iglesias-Rodriguez M D, Sáez A G, Groben R, Edwards K J, Batley J, Medlin LK, et al. (2002b) Poly- morphic microsatellite loci in global populations of the marine coccolithophoridEmiliania huxleyi.Molec- ular Ecology Notes 2: 495–497.
15. Green JC, Course PA, Tarran GA (1996) The life cycle ofEmiliania huxleyi: A brief review and a study of relative ploidy levels analysed by flow cytometry. Journal of Marine Systems 9: 33–44.
16. Müller MN, Trull TW, Hallegraeff GM (2015) Differing responses of three Southern Ocean Emiliania huxleyiecotypes to changing seawater carbonate chemistry. Marine Ecology Progress Series 531:
81–90, doi:10.3354/meps11309
17. Balch W, Drapeau D, Bowler B, Booth E (2007) Prediction of pelagic calcification rates using satellite measurements. Deep-Sea Research II 54: 478–495.
18. Armstrong RA, Lee C, Hedges JI, Honjo S, Wakeham SG (2002) A new mechanistic model for organic carbon fluxes in the ocean based on the quantitative association of POC with ballast minerals. Deep- Sea Research II 49: 219–236.
19. Biermann A, Engel A (2010) Effect of CO2on the properties and sinking velocity of aggregates of the coccolithophoreEmiliania huxleyi. Biogeosciences 7: 1017–1029.
20. Berggren WA, Burckle LH, Cita MB, Cooke HBS, Funnell BM, Gartner S, et al. (1980) Towards a Qua- ternary time scale. Quaternary Research 13: 277–302.
21. Bown PR, Lees JA., Young JR (2004) Calcareous nannoplankton evolution and diversity through time.
In: Thierstein H, Young J, eds. Coccolithophores: From Molecular Processes to Global Impact. Ger- many: Springer Verlag Berlin Heidelberg, 481–508.
22. Stoll HM, Schrag DP (2001) Sr:Ca variaitons in Cretaceous carbonates:relation to productivity and sea level changes. Paleogeography, Paleoclimatology, Paleoecology 169: 311–336.
23. Nürnberg D, Bijma J, Hemlebem C (1996) Assessing the reliability of magnesium in foraminiferal calcite as a proxy for water mass temperatures. Geochimica et Cosmochimica Acta 60: 803–814.
24. Ra K, Kitagawa H, Shiraiwa Y (2010) Mg isotopes and Mg:Ca values of coccoliths from cultured spe- cimes of the speciesEmiliania huxleyiandGephyrocapsa oceanica. Marine Micropaleontology 77:
119–124.
25. Müller MN, Lebrato M, Riebesell U, Barcelos e Ramos J, Schulz KG, Blanco-Ameijeiras S, at al. (2014).
Influence of temperature and CO2on the strontium and magnesium composition of coccolithophore cal- cite. Biogeosciences 11: 1065–1075.
26. Stoll H, Langer G, Shimizu N, Kanamaru K (2012) B:Ca in coccoliths and relationship to calcification vesicle pH and dissolved inorganic carbon concentrations. Geochiminca et Cosmochimica Acta 80:
143–157.
27. Langer G, Nehrke G, Probert I, Ly J, Ziveri P (2009) Strain-specific responses ofEmiliania huxleyito changing seawater carbonate chemistry. Biogeosciences 6: 2637–2646.
28. Cook SS, Jones RC, Vaillancourt RE, Hallegraeff GM (2011) Genetic differentiation among Australian and Southern Ocean populations of the ubiquitous coccolithophoreEmiliania huxleyi(Haptophyta).
Phycologia 52: 368–374.