BGD
12, 17219–17243, 2015
Soluble trace metals in aerosols over the tropical south east
Pacific offshore of Peru
A. R. Baker et al.
Title Page Abstract Introduction Conclusions References
Tables Figures
J I
J I
Back Close
Full Screen / Esc
Printer-friendly Version Interactive Discussion
DiscussionPaper|DiscussionPaper|DiscussionPaper|DiscussionPaper
Biogeosciences Discuss., 12, 17219–17243, 2015 www.biogeosciences-discuss.net/12/17219/2015/
doi:10.5194/bgd-12-17219-2015
© Author(s) 2015. CC Attribution 3.0 License.
This discussion paper is/has been under review for the journal Biogeosciences (BG).
Please refer to the corresponding final paper in BG if available.
Soluble trace metals in aerosols over the tropical south east Pacific o ff shore
of Peru
A. R. Baker1, M. Thomas1, H. W. Bange2, and E. Plasencia Sánchez3
1Centre for Ocean and Atmospheric Science, School of Environmental Sciences, University of East Anglia, Norwich, NR4 7TJ, UK
2Marine Biogeochemie, GEOMAR Helmholtz-Zentrum für Ozeanforschung Kiel, Düsternbrooker Weg 20, 24105 Kiel, Germany
3Facultad de Ingeniería Geológica, Minera y Metalúrgica, Universidad Nacional de Ingeniería, Perú Dirección General de Investigación y Asuntos Ambientales, Servicio Nacional de Meteorología e Hidrología del Perú SENAMHI, Lima, Peru
Received: 1 October 2015 – Accepted: 12 October 2015 – Published: 27 October 2015 Correspondence to: A. R. Baker (alex.baker@uea.ac.uk)
Published by Copernicus Publications on behalf of the European Geosciences Union.
BGD
12, 17219–17243, 2015
Soluble trace metals in aerosols over the tropical south east
Pacific offshore of Peru
A. R. Baker et al.
Title Page Abstract Introduction Conclusions References
Tables Figures
J I
J I
Back Close
Full Screen / Esc
Printer-friendly Version Interactive Discussion
DiscussionPaper|DiscussionPaper|DiscussionPaper|DiscussionPaper|
Abstract
Bulk aerosol samples collected during cruise M91 of FSMeteoroffthe coast of Peru in December 2012 were analysed for their soluble trace metal (Fe, Al, Mn, Ti, Zn, V, Ni, Cu, Co, Cd, Pb, Th) and major ion (including NO−3 and NH+4) content. These data are among the first recorded for trace metals in this relatively poorly studied region of
5
the global marine atmosphere. To the north of ∼13◦S, the concentrations of several elements (Fe, Ti, Zn, V, Ni, Pb) appear to be related to distance from the coast. At the south of the transect (∼15–16◦S), elevated concentrations of Fe, Cu, Co and Ni were observed. These may be related to the activities of the large smelting facilities in the south of Peru or northern Chile. Calculated dry deposition fluxes (3370–17 800
10
and 16–107 nmol m−2d−1for inorganic nitrogen and soluble Fe respectively) indicated that atmospheric input to the waters of the Peru upwelling system contains an excess of Fe over N, with respect to phytoplankton requirements. This may be significant as primary production in these waters has been reported to be limited by Fe availability, but atmospheric deposition is unlikely to be the dominant source of Fe to the system.
15
1 Introduction
Aerosol chemical composition plays a key role in a number of processes that are impor- tant for climate regulation, including the formation of cloud condensation nuclei (Raes et al., 2000) and the supply of nutrients such as nitrogen (N), phosphorus (P) and iron (Fe) and other trace metals to the ocean (Okin et al., 2011).
20
Few studies of the atmosphere over the south-eastern Pacific Ocean have been conducted and, compared to other ocean regions (e.g. the north Atlantic, northwest Pacific and northern Indian Oceans), rather little is known about its aerosol chemi- cal composition. The coastal region of Peru and northern Chile contains some strong sources of aerosols including: the mega-city of Lima with its associated urban/industrial
25
combustion emissions (nitrogen and sulphur oxides, trace metals); industrial and infor-
BGD
12, 17219–17243, 2015
Soluble trace metals in aerosols over the tropical south east
Pacific offshore of Peru
A. R. Baker et al.
Title Page Abstract Introduction Conclusions References
Tables Figures
J I
J I
Back Close
Full Screen / Esc
Printer-friendly Version Interactive Discussion
DiscussionPaper|DiscussionPaper|DiscussionPaper|DiscussionPaper
mal mining (mineral dust), several large metal smelting facilities (trace metals, sulphur dioxide); arid areas (mineral dust) and active volcanoes (sulphur dioxide, mineral dust).
The region is heavily influenced by the high Andes mountain chain, which forces sur- face winds into a strong south-easterly flow roughly parallel to the coast (Wood et al., 2011). This wind system in turn drives coastal upwelling offshore of Peru and Chile,
5
supplying nutrients which support intense primary productivity in surface waters. Previ- ous ship- and satellite-based observations have identified a strong gradient in aerosol concentrations in the region, with very low concentrations offshore and higher concen- trations near the coast (Hawkins et al., 2010), and the surface and vertical distributions of manganese (Mn) in the waters of the Peruvian shelf have been interpreted to sug-
10
gest that Mn has a significant atmospheric source here (Vedamati et al., 2015). There is however, very little data available on the chemical composition of aerosol material in this region (particularly for trace metals) or the impact that deposition of this material has on surface water nutrient dynamics.
Here we report concentrations of aerosol soluble trace metals and major ions in sam-
15
ples collected offthe coast of Peru during December 2012. We examine the possible sources of this material and its potential impact on the waters into which it is deposited.
2 Methods
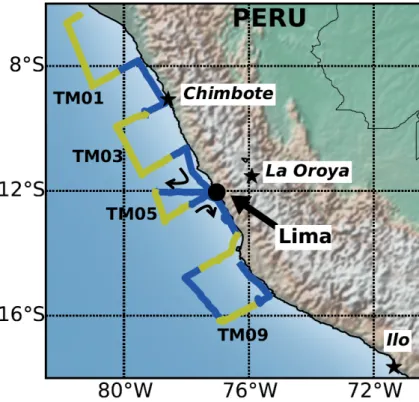
Aerosol samples were collected between 4 and 24 December 2012 during cruise M91 of the FSMeteoroff the coast of Peru (Fig. 1). A volumetric-flow controlled total sus-
20
pended particulate collector was used, operating at a flow rate 1.1 m3min−1. Operation of the collector was controlled by an automated wind sector controller, which interrupted pumping if the relative wind speed was below 2 m s−1or the relative wind direction was within an arc 45◦ either side of the ship’s stern. Each sample was deployed in the col- lector for a period of∼48 h, giving maximum air volumes filtered of∼3200 m3. Sam-
25
ple collection details are given in Table 1. Samples were collected on 20.3×25.4 cm Whatman 41 filters that had previously been washed using dilute (0.5 and 0.1 M) HCl
BGD
12, 17219–17243, 2015
Soluble trace metals in aerosols over the tropical south east
Pacific offshore of Peru
A. R. Baker et al.
Title Page Abstract Introduction Conclusions References
Tables Figures
J I
J I
Back Close
Full Screen / Esc
Printer-friendly Version Interactive Discussion
DiscussionPaper|DiscussionPaper|DiscussionPaper|DiscussionPaper|
solutions and ultrapure water to reduce trace metal contamination (Rickli et al., 2010).
Contributions from blanks were assessed by analysis of filters that had been housed in the sampling cassette for 24 h, but not deployed in the collector, and of filters that had been deployed in the collector for 48 h without air pumping.
After collection, aerosol filters were sealed in zip-lock plastic bags and returned
5
frozen to the University of East Anglia (UEA). All handling of filters at UEA was done within a laminar flow hood in a trace metal clean laboratory. Filters were quartered us- ing ceramic-bladed scissors and one quarter each was used for analysis of major ions (MI: Na+, NH+4, Mg2+, K+, Ca2+, Cl−, NO−3, SO2−4 , C2O2−4 , Br−) and soluble trace metals (TM: Fe, Al, Mn, Ti, Zn, V, Cu, Ni, Co, Cd, Pb, Th). Major ions were extracted into 20 mL
10
of ultrapure water using 60 min of ultrasonication, filtered (0.2 µm Sartorius) and anal- ysed by ion chromatography (Baker et al., 2007). Soluble TMs were extracted using a batch method into 20 mL pH 4.7 ammonium acetate buffer prepared from TraceS- ELECT Ultra ammonium hydroxide and acetic acid solutions (Sigma-Aldrich). Extrac- tions were terminated by filtration (0.2 µm Sartorius) and TM concentrations were deter-
15
mined by ICP-OES (Fe, Al, Mn, Ti, Zn, V) and ICP-MS (Mn, V, Cu, Ni, Co, Cd, Pb, Th).
Instruments were calibrated using matrix-matched standard solutions prepared from single element SPEX CertiPrep 1000 mg L−1 standard solutions. The Certified Ref- erence Materials TMRAIN-04, TM-27.3 and TMDA-64.2 (Environment Canada) were analysed together with TM samples. Recoveries for these CRMs were within the fol-
20
lowing limits of their certified values: TMRAIN-04±10 % (Mn, Cu),±15 % (Ni, Co, Fe),
±20 % (Ti, Zn); TM-27.3±5 % (Cu, Ni, Co, Pb, Ti),±10 % (Mn, V),±20 % (Cd, Fe, Al, Zn); TMDA-64.2±5 % (Mn, Cu, Co, Ti),±10 % (V, Ni, Pb, Fe, Zn),±20 % (Cd, Al).
Quantities of analytes on each filter (Qx) were calculated from measured concentra- tions in extracts (Cxe), extraction volumes (Ve) and the fraction of filter extracted (f) (see
25
Eq. 1), corrected for blank contributions (Qbx) and converted into atmospheric concen-
BGD
12, 17219–17243, 2015
Soluble trace metals in aerosols over the tropical south east
Pacific offshore of Peru
A. R. Baker et al.
Title Page Abstract Introduction Conclusions References
Tables Figures
J I
J I
Back Close
Full Screen / Esc
Printer-friendly Version Interactive Discussion
DiscussionPaper|DiscussionPaper|DiscussionPaper|DiscussionPaper
trations (Catx) using the air volume for each sample (Vair), Eq (2).
Qx=CxeVe/f (1)
Cxat=(Qx−Qbx)/Vair (2)
For K+, Ca2+ and SO2−4 we calculated the contribution to measured concentrations arising from sea spray using the measured aerosol Na+concentrations and the ratio of
5
each ion to Na+in seawater (Csw). We then subtracted this sea spray contribution from the measured concentration to obtain the non-sea spray (nss) concentration for each ion, Eq. (3).
nss-Catx =Catx −(CatNaCxsw/CNasw) (3)
Dry deposition fluxes (Fd) were estimated from atmospheric concentrations using dry
10
deposition velocities (vd), Eq. (4). Dry deposition velocities are highly variable with particle size and wind speed and rather poorly known. Duce et al. (1991) estimated the uncertainty in dry deposition velocities to be approximately a factor of 2–3.
Fxd=Cxatvd (4)
Given the lack of aerosol size distribution data available for this region of the global
15
ocean, we used fixed values ofvdfor species predominantly associated with seaspray or mineral dust aerosol (0.6 cm s−1: NO−3, Fe, Al, Mn, Ti, Co, Th) or for species pre- dominantly associated with fine mode aerosols (0.1 cm s−1: NH+4, Zn, V, Cu, Ni, Cd, Pb).
Where we investigated correlations between parameters we reported these as sig-
20
nificant using Spearman’s Rank Correlation at the 99 % confidence level. We obtained 5-day air mass back trajectories at heights of 10, 500 and 1000 m above the ship’s po- sition and ground-level 2-day forward trajectories from the sites of the Chimbote and Ilo smelters from the NOAA Air Resources Laboratory, HYSPLIT model using the GDAS dataset.
25
BGD
12, 17219–17243, 2015
Soluble trace metals in aerosols over the tropical south east
Pacific offshore of Peru
A. R. Baker et al.
Title Page Abstract Introduction Conclusions References
Tables Figures
J I
J I
Back Close
Full Screen / Esc
Printer-friendly Version Interactive Discussion
DiscussionPaper|DiscussionPaper|DiscussionPaper|DiscussionPaper|
3 Results and discussion
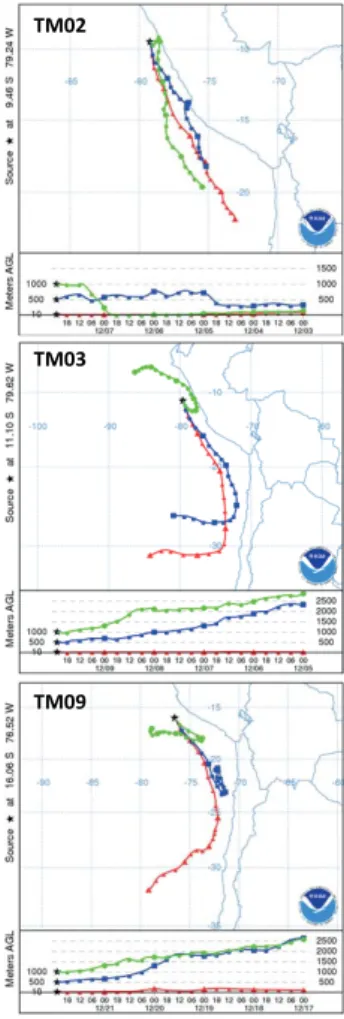
Air mass back trajectories for all the M91 aerosol samples indicated that surface flow was approximately south-south-easterly, consistent with both the average wind direc- tions recorded aboard ship for each sample (144–168◦) and the climatological average flow for the region (Wood et al., 2011). Example trajectories for the mid-point of samples
5
TM02 (on-shore), TM03 (off-shore) and TM09 are shown in Fig. 2. A notable feature of these trajectories (which were run at intervals of 24 h, i.e. twice per sample period) was that very few (for any start height) appeared to pass over South America.
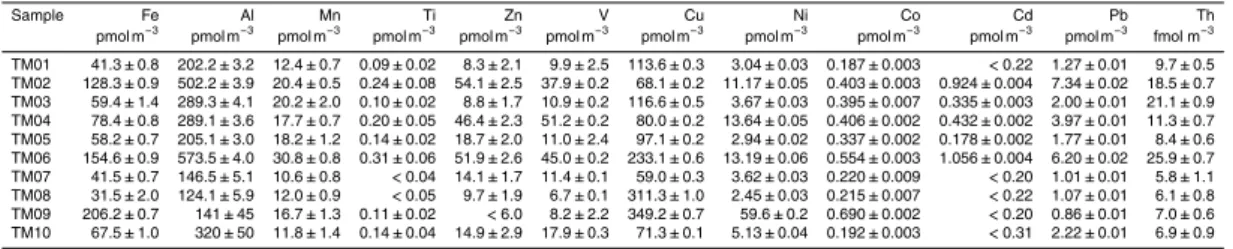
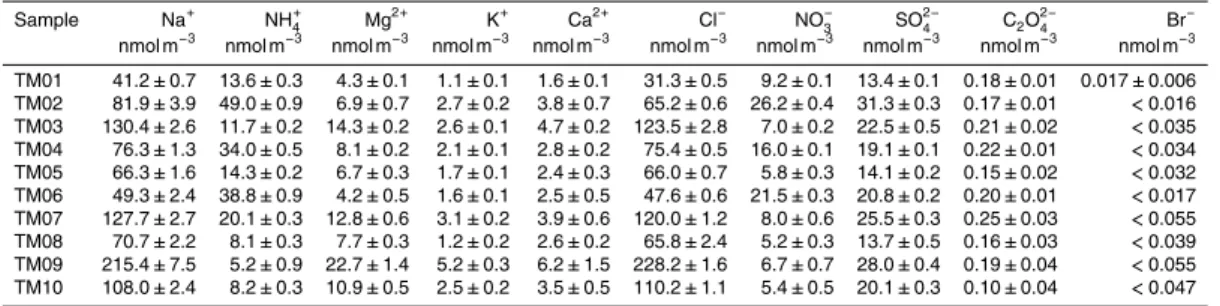
Concentrations of soluble TMs and MIs determined for the aerosol samples collected during M91 are shown in Tables 2 and 3 respectively. We are aware of few previous
10
studies of aerosol chemical composition in this region of the South Pacific. Hawkins et al. (2010) reported SO2−4 concentrations in <1 µm diameter aerosol particles of 15±10 nmol m−3 in continentally-influenced samples between ∼4 and ∼20◦S (al- though further offshore than M91) during the VOCALS-REx field campaign in October–
November 2008. Allen et al. (2011) reported NH+4 and SO2−4 concentrations, also in
15
<1 µm diameter particles and during VOCALS-REx, of 16–39 and 2–9.4 nmol m−3re- spectively in samples collected between∼85 and∼75◦W at 20◦S. Although we report concentrations for bulk aerosol, rather than the sub-micron size fraction determined in these studies, their results are similar to those for M91 (Table 3), presumably be- cause substantial fractions of both NH+4 and SO2−4 are present in <1 µm diameter
20
particles. Water soluble concentrations of Fe, Al, Mn, Zn and Cu were determined in <1 µm diameter aerosol particles near potential sources of mineral dust and an- thropogenic emissions at Paposo, northern Chile (25.007◦S 70.450◦W) in October–
November 2008 (Chand et al., 2010). Mean concentrations were reported to be 410, 410, 25, 75 and 88 pmol m−3 respectively for Fe, Al, Mn, Zn and Cu. Note that the
25
data of Chand et al. (2010) are not directly comparable with our results from M91 be- cause they were acquired using a different extraction protocol, and a different sampling method. The trace metal fractions extracted in ammonium acetate and water may well
BGD
12, 17219–17243, 2015
Soluble trace metals in aerosols over the tropical south east
Pacific offshore of Peru
A. R. Baker et al.
Title Page Abstract Introduction Conclusions References
Tables Figures
J I
J I
Back Close
Full Screen / Esc
Printer-friendly Version Interactive Discussion
DiscussionPaper|DiscussionPaper|DiscussionPaper|DiscussionPaper
be different (Morton et al., 2013) and the exclusion of larger aerosol particles in the Paposo samples would be expected to remove significant fractions of those elements strongly associated with mineral dust (Fe, Al and Mn). Concentrations of soluble TMs measured during M91 were generally higher (by factors of 4 to 16 for V, Ni, Co, Cd and Pb) than reported over the remote southeast Atlantic using nearly identical sampling
5
and analysis methods to M91 (Chance et al., 2015). In the case of Cu, M91 concen- trations were more than 50-fold higher than the concentrations measured by Chance et al. (2015).
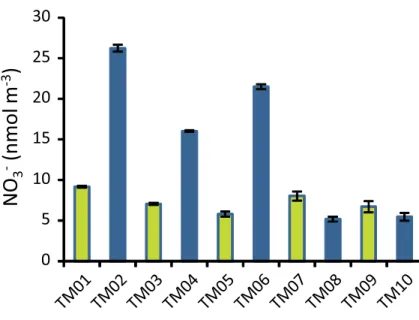
In Fig. 3 we show aerosol nitrate concentrations as a function of sample number for the M91 cruise. This shows that NO−3 concentrations were approximately 2-fold higher
10
in the on-shore samples (TM02, TM04 and TM06) north of∼13◦S than in the off-shore samples at those latitudes or in any of the samples south of 13◦S. Similar patterns were exhibited by many other analytes (see Tables 2 and 3) and this is in good qualitative agreement with the distribution of aerosol optical depth (AOD) in this region reported by Hawkins et al. (2010). These patterns gave rise to a number of significant correlations
15
between analytes (e.g. between NH+4 and NO−3) that are most likely caused by the co- location of emission sources, rather than by similar production/emission mechanisms for the analytes in question.
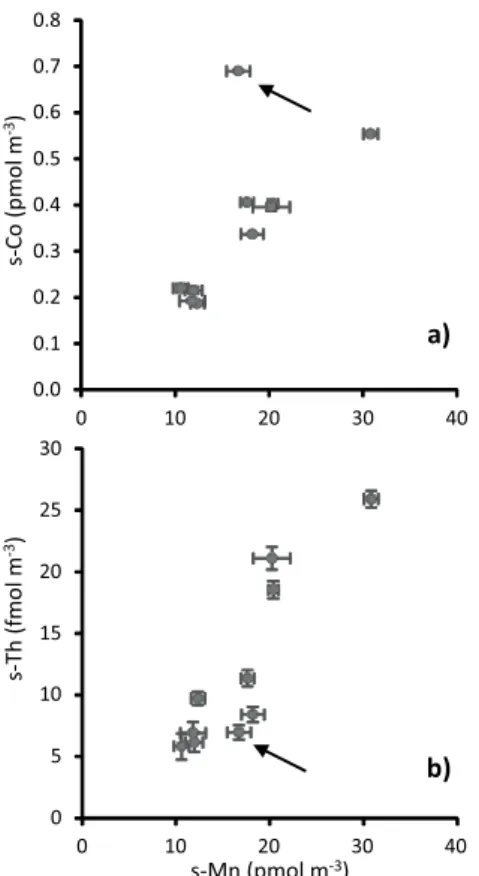
We observed significant correlations for several elements associated with mineral dust (Fe, Al, Mn, Ti, Co, Th: Fig. 4, Table 4). However for Co (Fig. 4a) and Fe, soluble
20
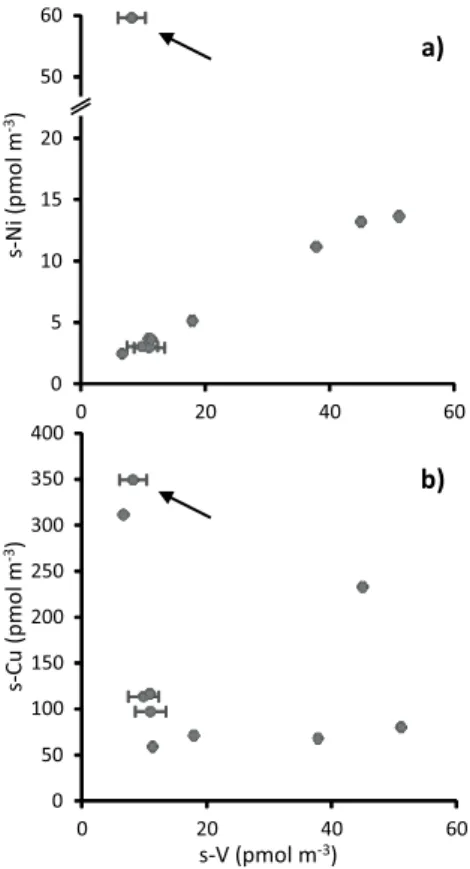
concentrations appear to be enriched in sample TM09 relative to other dust-associated elements. Aerosol soluble V and Ni concentrations have previously been shown to be very highly correlated due to their emission during combustion of heavy fuel oils (Becagli et al., 2012). We find a similar close relationship between s-V and s-Ni, again with the exception of sample TM09, which appears to be enriched in Ni (Fig. 5a).
25
Although s-Cu does not appear to be related to s-V in our dataset (Fig. 5b), it is no- table that the highest s-Cu concentrations were found in samples TM08 and TM09, in which most aerosol concentrations were relatively low. We consider that the most likely source of the elevated concentrations of Cu, Fe, Co and Ni we observed in sample
BGD
12, 17219–17243, 2015
Soluble trace metals in aerosols over the tropical south east
Pacific offshore of Peru
A. R. Baker et al.
Title Page Abstract Introduction Conclusions References
Tables Figures
J I
J I
Back Close
Full Screen / Esc
Printer-friendly Version Interactive Discussion
DiscussionPaper|DiscussionPaper|DiscussionPaper|DiscussionPaper|
TM09 was emissions from the metal smelting facility at Ilo in southern Peru (Fig. 1), or perhaps from smelters located in central and northern Chile (Gidhagen et al., 2002;
Paytan et al., 2009). Forward air mass trajectories run from Ilo (Fig. 6b) indicate that some of the emissions from the facility may have been advected over the ocean during the collection period of sample TM09. Satellite detections using the Ozone Monitor-
5
ing Instrument (NASA EOS/Aura) in 2004–2005 were used to estimate SO2emissions from the Ilo facility to be∼0.3 Tg yr−1, equivalent to∼25 % of the combined SO2emis- sions from the volcanoes in Ecuador and southern Colombia over the same period (Carn et al., 2007). However, improvements in sulphur capture efficiency at the smelter (Boon et al., 2001) were completed in 2007 and there is no elevation in nss-SO2−4
10
concentration in sample TM09, compared to the other samples collected during the cruise (cruise range 9.5–26.3 nmol m−3, TM09 15.0 nmol m−3). The copper smelter at La Oroya ceased operations in 2009 and was not active at the time of the M91 cruise.
In any case, the elevation of the La Oroya site (∼3750 m a.s.l.) and its surrounding mountains makes it unlikely to influence M91 aerosol concentrations. Emissions from
15
the iron foundry at Chimbote may have contributed to the TM concentrations observed in sample TM02 (Fig. 6a).
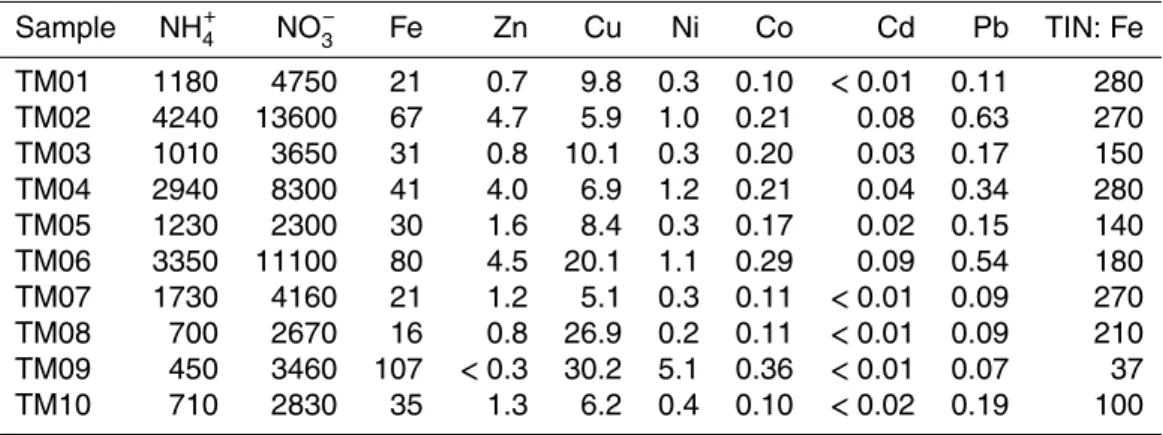
In Table 5 we show calculated dry deposition fluxes of NH+4, NO−3, s-Fe, s-Co, s-Zn, s-Cu, s-Ni, Cd, s-Pb and the ratio of total inorganic N (NH+4+NO−3) to s-Fe in dry de- position for the cruise. Dry deposition fluxes of NH+4 and NO−3 for the off-shore and
20
southerly samples were similar to average values calculated for the remote South At- lantic (NH+4: 600–800 nmol m−2d−1, NO−3: 2300–3400 nmol m−2d−1; Baker et al., 2010), while fluxes for the northern in-shore samples were higher and similar to corresponding values for on-shore winds on the west coast of Ireland (NH+4: 5100–9500 nmol m−2d−1, NO−3: 4200–7500 nmol m−2d−1; Spokes et al., 2000). The range of NO−3 dry deposition
25
fluxes calculated for M91 is in reasonable agreement with the results of a global mod- elling study for the region (Dentener et al., 2006), which indicated that the deposition of total NOy (including gas-phase and wet deposition of oxidised N species) to the re- gion was approximately 15 000–20 000 nmol m−2d−1. In contrast to N, dry deposition
BGD
12, 17219–17243, 2015
Soluble trace metals in aerosols over the tropical south east
Pacific offshore of Peru
A. R. Baker et al.
Title Page Abstract Introduction Conclusions References
Tables Figures
J I
J I
Back Close
Full Screen / Esc
Printer-friendly Version Interactive Discussion
DiscussionPaper|DiscussionPaper|DiscussionPaper|DiscussionPaper
of s-Fe during M91 was one to two (for sample TM09) orders of magnitude higher than reported for the remote South Atlantic (2–7 nmol m−2d−1; Baker et al., 2013). Our av- erage estimate ofFs-Fed during M91 (45 nmol m−2d−1, equivalent to ∼0.9 mg m−2yr−1) appears to be somewhat higher that the total deposition flux of s-Fe (0.3 mg m−2yr−1) estimated for the region by Krishnamurthy et al. (2009) (as reported by Messie and
5
Chavez, 2015). The range of TIN: s-Fe ratios in the M91 samples compares well to val- ues of the total N: s-Fe ratio reported for the tropical Atlantic Ocean (170–1300; Baker et al., 2007) and implies that atmospheric deposition to the margins of the tropical eastern Pacific, as elsewhere in the global ocean, supplies Fe in excess (with respect to N supply) of the stoichiometric requirements of the phytoplankton community (Okin
10
et al., 2011). This excess Fe supply from the atmosphere may be significant as primary production offthe coast of Peru has been suggested to be limited by Fe availability (Bru- land et al., 2005; Hutchins et al., 2002; Messie and Chavez, 2015). However, recent analysis indicates that dissolved Fe in the surface waters of the Peru upwelling sys- tem is isotopically lighter than Fe in known atmospheric sources, so that atmospheric
15
deposition is unlikely to be the dominant source of Fe in these waters (Chever et al., 2015).
Dissolved Co in the Peru upwelling system exhibits micronutrient-like behaviour and Co speciation is linked to changes in phytoplankton assemblages there (Saito et al., 2004). Saito et al. (2004) suggested that Co input to the upwelling system was dom-
20
inated by a sedimentary source of∼19.9×10⁶mol yr−1. Assuming an areal extent of the upwelling of 120–220×103km2 (Nixon and Thomas, 2001), this equates to a flux of∼250–450 nmol m−2d−1, approximately three orders of magnitude greater than our estimates of the dry atmospheric flux (Table 5).
Paytan et al. (2009) estimated Cu dry deposition to the global ocean using an at-
25
mospheric chemistry transport model in an investigation of the potential toxicity of at- mospheric Cu inputs towards marine primary producers. Their estimates of Cu flux to the tropical eastern Pacific margin appear to be in the range 0.02–0.06 mg Cu m−2yr−1 (0.8–2.4 nmol m−2d−1), roughly an order of magnitude lower than the values calculated
BGD
12, 17219–17243, 2015
Soluble trace metals in aerosols over the tropical south east
Pacific offshore of Peru
A. R. Baker et al.
Title Page Abstract Introduction Conclusions References
Tables Figures
J I
J I
Back Close
Full Screen / Esc
Printer-friendly Version Interactive Discussion
DiscussionPaper|DiscussionPaper|DiscussionPaper|DiscussionPaper|
for M91. Emissions from copper smelters on the Nasca coast, which were not included in the model of Paytan et al. (2009), may account for the differences between the two deposition estimates.
4 Conclusions
We have reported what we believe to be the first study of aerosol soluble TM concen-
5
trations over the Peru upwelling system. Most TMs (and MIs) analysed show higher concentrations close to the coast north of 13◦S than further offshore or to the south, in good agreement with the observed spatial distribution of AOD in the region (Hawkins et al., 2010).
Elevated concentrations of Cu, Fe, Co and Ni at the south of the transect are most
10
likely related to emissions from the metal smelter at Ilo or similar facillties in northern Chile. However, neither air mass back trajectory analysis nor examination of nss-SO2−4 concentrations (as an indicator of smelter SO2emissions) can confirm this.
Our calculated dry deposition fluxes for s-Fe and s-Cu appear to be somewhat higher than recent modelled estimates of their deposition (Krishnamurthy et al., 2009; Paytan
15
et al., 2009). However, it should be noted that this comparison is necessarily based on only a few observations from a single month, whereas both modelling studies reported annual average values. The ratio of N to s-Fe in dry deposition during M91 indicates that aerosol inputs constitute a source of excess Fe (relative to phytoplankton stoichio- metric requirements) to the Peru upwelling system. This may be significant as primary
20
production in these waters has been shown to be limited by Fe availability (Bruland et al., 2005; Hutchins et al., 2002), although it appears unlikely that atmospheric depo- sition is the dominant source of Fe to surface waters here (Chever et al., 2015). Our work does not allow us to assess whether the deposition flux of s-Cu we estimate might lead to potential problems of toxicity in the tropical south east Pacific.
25
Acknowledgements. Meteor cruise M91 was supported by the BMBF projects SOPRAN II and III (FKZ 03F0611A and FKZ 03F662A). We thank the Peruvian authorities for authoriz-
BGD
12, 17219–17243, 2015
Soluble trace metals in aerosols over the tropical south east
Pacific offshore of Peru
A. R. Baker et al.
Title Page Abstract Introduction Conclusions References
Tables Figures
J I
J I
Back Close
Full Screen / Esc
Printer-friendly Version Interactive Discussion
DiscussionPaper|DiscussionPaper|DiscussionPaper|DiscussionPaper
ing us to conduct the study in their territorial waters. We also would like to thank our Pe- ruvian colleagues from IMARPE (M. Graco, A. Bernal, G. Flores and V. León) for their lo- gistical support to our work. Sample analysis was funded by the UK Natural Environment Research Council (NERC) through grant NE/H00548X/1 and by the School of Natural Sci- ences, University of East Anglia. We gratefully acknowledge the NOAA Air Resources Labo-
5
ratory for the provision of the HYSPLIT transport and dispersion model and READY website (http://www.arl.noaa.gov/HYSPLIT.php).
References
Allen, G., Coe, H., Clarke, A., Bretherton, C., Wood, R., Abel, S. J., Barrett, P., Brown, P., George, R., Freitag, S., McNaughton, C., Howell, S., Shank, L., Kapustin, V.,
10
Brekhovskikh, V., Kleinman, L., Lee, Y.-N., Springston, S., Toniazzo, T., Krejci, R., Fochesatto, J., Shaw, G., Krecl, P., Brooks, B., McMeeking, G., Bower, K. N., Williams, P. I., Crosier, J., Crawford, I., Connolly, P., Allan, J. D., Covert, D., Bandy, A. R., Russell, L. M., Trembath, J., Bart, M., McQuaid, J. B., Wang, J., and Chand, D.: South East Pacific atmo- spheric composition and variability sampled along 20◦S during VOCALS-REx, Atmos. Chem.
15
Phys., 11, 5237–5262, doi:10.5194/acp-11-5237-2011, 2011.
Baker, A. R., Weston, K., Kelly, S. D., Voss, M., Streu, P., and Cape, J. N.: Dry and wet de- position of nutrients from the tropical Atlantic atmosphere: links to primary productivity and nitrogen fixation, Deep-Sea Res. Pt. I, 54, 1704–1720, 2007.
Baker, A. R., Lesworth, T., Adams, C., Jickells, T. D., and Ganzeveld, L.: Estimation of atmo-
20
spheric nutrient inputs to the Atlantic Ocean from 50◦N to 50◦S based on large-scale field sampling: fixed nitrogen and dry deposition of phosphorus, Global Biogeochem. Cy., 24, GB3006, doi:10.1029/2009GB003634, 2010.
Baker, A. R., Adams, C., Bell, T. G., Jickells, T. D., and Ganzeveld, L.: Estimation of atmo- spheric nutrient inputs to the Atlantic Ocean from 50◦N to 50◦S based on large-scale field
25
sampling: iron and other dust-associated elements, Global Biogeochem. Cy., 27, 755–767, doi:10.1002/gbc.20062, 2013.
Becagli, S., Sferlazzo, D. M., Pace, G., di Sarra, A., Bommarito, C., Calzolai, G., Ghedini, C., Lucarelli, F., Meloni, D., Monteleone, F., Severi, M., Traversi, R., and Udisti, R.: Evidence for heavy fuel oil combustion aerosols from chemical analyses at the island of Lampedusa: a
30
BGD
12, 17219–17243, 2015
Soluble trace metals in aerosols over the tropical south east
Pacific offshore of Peru
A. R. Baker et al.
Title Page Abstract Introduction Conclusions References
Tables Figures
J I
J I
Back Close
Full Screen / Esc
Printer-friendly Version Interactive Discussion
DiscussionPaper|DiscussionPaper|DiscussionPaper|DiscussionPaper|
possible large role of ships emissions in the Mediterranean, Atmos. Chem. Phys., 12, 3479–
3492, doi:10.5194/acp-12-3479-2012, 2012.
Boon, R. G. J., Alexaki, A., and Becerra, E. H.: The Ilo Clean Air Project: a local response to pollution control in Peru, Environ. Urban., 13, 215–232, doi:10.1177/095624780101300217, 2001.
5
Bruland, K. W., Rue, E. L., Smith, G. J., and DiTullio, G. R.: Iron, macronutrients and diatom blooms in the Peru upwelling regime: brown and blue waters of Peru, Mar. Chem., 93, 81–
103, 2005.
Carn, S. A., Krueger, A. J., Krotkov, N. A., Yang, K., and Levelt, P. F.: Sulfur dioxide emissions from Peruvian copper smelters detected by the Ozone Monitoring Instrument, Geophys. Res.
10
Lett., 34, L09801, doi:10.1029/2006GL029020, 2007.
Chance, R., Jickells, T. D., and Baker, A. R.: Atmospheric trace metal concentrations, solubility and deposition fluxes in remote marine air over the south-east Atlantic, Mar. Chem., in press, doi:10.1016/j.marchem.2015.06.028, 2015.
Chand, D., Hegg, D. A., Wood, R., Shaw, G. E., Wallace, D., and Covert, D. S.: Source attribution
15
of climatically important aerosol properties measured at Paposo (Chile) during VOCALS, Atmos. Chem. Phys., 10, 10789–10801, doi:10.5194/acp-10-10789-2010, 2010.
Chever, F., Rouxel, O. J., Croot, P. L., Ponzevera, E., Wuttig, K., and Auro, M.: Total dissolvable and dissolved iron isotopes in the water column of the Peru upwelling regime, Geochim.
Cosmochim. Ac., 162, 66–82, doi:10.1016/j.gca.2015.04.031, 2015.
20
Dentener, F., Drevet, J., Lamarque, J. F., Bey, I., Eickhout, B., Fiore, A. M., Hauglustaine, D., Horowitz, L. W., Krol, M., Kulshrestha, U. C., Lawrence, M., Galy-Lacaux, C., Rast, S., Shin- dell, D., Stevenson, D., van Noije, T., Atherton, C., Bell, N., Bergman, Butler, T., Cofala, J., Collins, B., Doherty, R., Ellingsen, K., Galloway, J., Gauss, M., Montanaro, V., Muller, J. F., Pitari, G., Rodriguez, J., Sanderson, M., Solmon, F., Strahan, S., Schultz, M., Sudo, K.,
25
Szopa, S., and Wild, O.: Nitrogen and sulfur deposition on regional and global scales: a multi- model evaluation, Global Biogeochem. Cy., 20, GB4003, doi:10.1029/2005GB002672, 2006.
Duce, R. A., Liss, P. S., Merrill, J. T., Atlas, E. L., Buat-Menard, P., Hicks, B. B., Miller, J. M., Pros- pero, J. M., Arimoto, R., Church, T. M., Ellis, W., Galloway, J. N., Hansen, L., Jickells, T. D., Knap, A. H., Reinhardt, K. H., Schneider, B., Soudine, A., Tokos, J. J., Tsunogai, S., Wol-
30
last, R., and Zhou, M.: The atmospheric input of trace species to the world ocean, Global Biogeochem. Cy., 5, 193–259, doi:10.1029/91GB01778, 1991.
BGD
12, 17219–17243, 2015
Soluble trace metals in aerosols over the tropical south east
Pacific offshore of Peru
A. R. Baker et al.
Title Page Abstract Introduction Conclusions References
Tables Figures
J I
J I
Back Close
Full Screen / Esc
Printer-friendly Version Interactive Discussion
DiscussionPaper|DiscussionPaper|DiscussionPaper|DiscussionPaper
Gidhagen, L., Kahelin, H., Schmidt-Thome, P., and Johansson, C.: Anthropogenic and natural levels of arsenic in PM10 in central and northern Chile, Atmos. Environ., 36, 3803–3817, doi:10.1016/s1352-2310(02)00284-4, 2002.
Hawkins, L. N., Russell, L. M., Covert, D. S., Quinn, P. K., and Bates, T. S.: Carboxylic acids, sulfates, and organosulfates in processed continental organic aerosol over the
5
southeast Pacific Ocean during VOCALS-REx 2008, J. Geophys. Res., 115, D13201, doi:10.1029/2009JD013276, 2010.
Hutchins, D. A., Hare, C. E., Weaver, R. S., Zhang, Y., Firme, G. F., DiTullio, G. R., Alm, M. B., Riseman, S. F., Maucher, J. M., Geesey, M. E., Trick, C. G., Smith, G. J., Rue, E. L., Conn, J., and Bruland, K. W.: Phytoplankton iron limitation in the Humboldt Current and Peru Up-
10
welling, Limnol. Oceanogr., 47, 997–1011, doi:10.4319/lo.2002.47.4.0997, 2002.
Krishnamurthy, A., Moore, J. K., Mahowald, N., Luo, C., Doney, S. C., Lindsay, K., and Zen- der, C. S.: Impacts of increasing anthropogenic soluble iron and nitrogen deposition on ocean biogeochemistry, Global Biogeochem. Cy., 23, GB3016, doi:10.1029/2008gb003440, 2009.
Messie, M. and Chavez, F. P.: Seasonal regulation of primary production in eastern boundary
15
upwelling systems, Prog. Oceanogr., 134, 1–18, doi:10.1016/j.pocean.2014.10.011, 2015.
Morton, P., Landing, W. M., Hsu, S. C., Milne, A., Aguilar-Islas, A. M., Baker, A. R., Bowie, A. R., Buck, C. S., Gao, Y., Gichuki, S., Hastings, M., Hatta, M., Johansen, A. M., Losno, R., Mead, C., Patey, M. D., Swarr, G., Vandermark, A., and Zamora, L. M.: Methods for sampling and analysis of marine aerosols: results from the 2008 GEOTRACES aerosol intercalibration
20
experiment, Limnol. Oceanogr.-Meth., 11, 62–78, doi:10.4319/lom.2013.11.62, 2013.
Nixon, S. and Thomas, A.: On the size of the Peru upwelling ecosystem, Deep-Sea Res. Pt. I, 48, 2521–2528, doi:10.1016/S0967-0637(01)00023-1, 2001.
Okin, G., Baker, A. R., Tegen, I., Mahowald, N. M., Dentener, F. J., Duce, R. A., Gal- loway, J. N., Hunter, K., Kanakidou, M., Kubilay, N., Prospero, J. M., Sarin, M., Surapip-
25
ith, V., Uematsu, M., and Zhu, T.: Impacts of atmospheric nutrient deposition on marine productivity: roles of nitrogen, phosphorus, and iron, Global Biogeochem. Cy., 25, GB2022, doi:10.1029/2010GB003858, 2011.
Paytan, A., Mackey, K. R. M., Chen, Y., Lima, I. D., Doney, S. C., Mahowald, N., Labiosa, R., and Post, A. F.: Toxicity of atmospheric aerosols on marine phytoplankton, P. Natl. Acad. Sci.
30
USA, 106, 4601–4605, doi:10.1073/pnas.0811486106, 2009.
BGD
12, 17219–17243, 2015
Soluble trace metals in aerosols over the tropical south east
Pacific offshore of Peru
A. R. Baker et al.
Title Page Abstract Introduction Conclusions References
Tables Figures
J I
J I
Back Close
Full Screen / Esc
Printer-friendly Version Interactive Discussion
DiscussionPaper|DiscussionPaper|DiscussionPaper|DiscussionPaper|
Raes, F., Van Dingenen, R., Vignati, E., Wilson, J., Putaud, J. P., Seinfeld, J. H., and Adams, P.:
Formation and cycling of aerosols in the global troposphere, Atmos. Environ., 34, 4215–
4240, 2000.
Rickli, J., Frank, M., Baker, A. R., Aciego, S., de Souza, G., Georg, R. B., and Halliday, A. N.:
Hafnium and neodymium isotope distribution in surface waters of the eastern Atlantic Ocean:
5
implications for sources and inputs of trace metals to the ocean, Geochim. Cosmochim. Ac., 74, 540–557, doi:10.1016/j.gca.2009.10.006, 2010.
Saito, M. A., Moffett, J. W., and DiTullio, G. R.: Cobalt and nickel in the Peru upwelling region:
a major flux of labile cobalt utilized as a micronutrient, Global Biogeochem. Cy., 18, GB4030, doi:10.1029/2003GB002216, 2004.
10
Spokes, L. J., Yeatman, S. G., Cornell, S. E., and Jickells, T. D.: Nitrogen deposition to the eastern Atlantic Ocean. The importance of south-easterly flow, Tellus B, 52, 37–49, 2000.
Vedamati, J., Chan, C., and Moffett, J. W.: Distribution of dissolved manganese in the Pe- ruvian Upwelling and Oxygen Minimum Zone, Geochim. Cosmochim. Ac., 156, 222–240, doi:10.1016/j.gca.2014.10.026, 2015.
15
Wood, R., Mechoso, C. R., Bretherton, C. S., Weller, R. A., Huebert, B., Straneo, F., Al- brecht, B. A., Coe, H., Allen, G., Vaughan, G., Daum, P., Fairall, C., Chand, D., Gallardo Klen- ner, L., Garreaud, R., Grados, C., Covert, D. S., Bates, T. S., Krejci, R., Russell, L. M., de Szoeke, S., Brewer, A., Yuter, S. E., Springston, S. R., Chaigneau, A., Toniazzo, T., Min- nis, P., Palikonda, R., Abel, S. J., Brown, W. O. J., Williams, S., Fochesatto, J., Brioude, J.,
20
and Bower, K. N.: The VAMOS Ocean-Cloud-Atmosphere-Land Study Regional Experiment (VOCALS-REx): goals, platforms, and field operations, Atmos. Chem. Phys., 11, 627–654, doi:10.5194/acp-11-627-2011, 2011.
BGD
12, 17219–17243, 2015
Soluble trace metals in aerosols over the tropical south east
Pacific offshore of Peru
A. R. Baker et al.
Title Page Abstract Introduction Conclusions References
Tables Figures
J I
J I
Back Close
Full Screen / Esc
Printer-friendly Version Interactive Discussion
DiscussionPaper|DiscussionPaper|DiscussionPaper|DiscussionPaper
Table 1.Details of aerosol samples collected during the M91 cruise.
Sample Start Date Start Position End Date End Position Air Volume (m3) TM01 4 Dec 2012 6.37◦S 81.43◦W 6 Dec 2012 8.11◦S 80.07◦W 2858.5 TM02 6 Dec 2012 8.10◦S 80.06◦W 8 Dec 2012 9.57◦S 79.32◦W 2339.0 TM03 8 Dec 2012 9.57◦S 79.32◦W 10 Dec 2012 10.84◦S 78.38◦W 3089.5 TM04 10 Dec 2012 10.84◦S 78.38◦W 12 Dec 2012 12.04◦S 79.00◦W 2563.4 TM05 12 Dec 2012 12.04◦S 79.00◦W 14 Dec 2012 12.42◦S 77.81◦W 3002.3 TM06 14 Dec 2012 12.42◦S 77.81◦W 16 Dec 2012 13.43◦S 76.37◦W 2267.1 TM07 16 Dec 2012 13.43◦S 76.37◦W 18 Dec 2012 14.56◦S 77.66◦W 3099.4 TM08 18 Dec 2012 14.57◦S 77.67◦W 20 Dec 2012 16.16◦S 76.83◦W 2795.1 TM09 20 Dec 2012 16.16◦S 76.82◦W 22 Dec 2012 15.54◦S 75.62◦W 3121.8 TM10 22 Dec 2012 15.54◦S 75.62◦W 24 Dec 2012 14.37◦S 76.25◦W 2015.0
BGD
12, 17219–17243, 2015
Soluble trace metals in aerosols over the tropical south east
Pacific offshore of Peru
A. R. Baker et al.
Title Page Abstract Introduction Conclusions References
Tables Figures
J I
J I
Back Close
Full Screen / Esc
Printer-friendly Version Interactive Discussion
DiscussionPaper|DiscussionPaper|DiscussionPaper|DiscussionPaper|
Table 2.Concentrations of aerosol soluble trace metals during the M91 cruise.
Sample Fe Al Mn Ti Zn V Cu Ni Co Cd Pb Th
pmol m−3 pmol m−3 pmol m−3 pmol m−3 pmol m−3 pmol m−3 pmol m−3 pmol m−3 pmol m−3 pmol m−3 pmol m−3 fmol m−3 TM01 41.3±0.8 202.2±3.2 12.4±0.7 0.09±0.02 8.3±2.1 9.9±2.5 113.6±0.3 3.04±0.03 0.187±0.003 <0.22 1.27±0.01 9.7±0.5 TM02 128.3±0.9 502.2±3.9 20.4±0.5 0.24±0.08 54.1±2.5 37.9±0.2 68.1±0.2 11.17±0.05 0.403±0.003 0.924±0.004 7.34±0.02 18.5±0.7 TM03 59.4±1.4 289.3±4.1 20.2±2.0 0.10±0.02 8.8±1.7 10.9±0.2 116.6±0.5 3.67±0.03 0.395±0.007 0.335±0.003 2.00±0.01 21.1±0.9 TM04 78.4±0.8 289.1±3.6 17.7±0.7 0.20±0.05 46.4±2.3 51.2±0.2 80.0±0.2 13.64±0.05 0.406±0.002 0.432±0.002 3.97±0.01 11.3±0.7 TM05 58.2±0.7 205.1±3.0 18.2±1.2 0.14±0.02 18.7±2.0 11.0±2.4 97.1±0.2 2.94±0.02 0.337±0.002 0.178±0.002 1.77±0.01 8.4±0.6 TM06 154.6±0.9 573.5±4.0 30.8±0.8 0.31±0.06 51.9±2.6 45.0±0.2 233.1±0.6 13.19±0.06 0.554±0.003 1.056±0.004 6.20±0.02 25.9±0.7 TM07 41.5±0.7 146.5±5.1 10.6±0.8 <0.04 14.1±1.7 11.4±0.1 59.0±0.3 3.62±0.03 0.220±0.009 <0.20 1.01±0.01 5.8±1.1 TM08 31.5±2.0 124.1±5.9 12.0±0.9 <0.05 9.7±1.9 6.7±0.1 311.3±1.0 2.45±0.03 0.215±0.007 <0.22 1.07±0.01 6.1±0.8 TM09 206.2±0.7 141±45 16.7±1.3 0.11±0.02 <6.0 8.2±2.2 349.2±0.7 59.6±0.2 0.690±0.002 <0.20 0.86±0.01 7.0±0.6 TM10 67.5±1.0 320±50 11.8±1.4 0.14±0.04 14.9±2.9 17.9±0.3 71.3±0.1 5.13±0.04 0.192±0.003 <0.31 2.22±0.01 6.9±0.9
BGD
12, 17219–17243, 2015
Soluble trace metals in aerosols over the tropical south east
Pacific offshore of Peru
A. R. Baker et al.
Title Page Abstract Introduction Conclusions References
Tables Figures
J I
J I
Back Close
Full Screen / Esc
Printer-friendly Version Interactive Discussion
DiscussionPaper|DiscussionPaper|DiscussionPaper|DiscussionPaper
Table 3.Concentrations of aerosol soluble major ions during the M91 cruise.
Sample Na+ NH+4 Mg2+ K+ Ca2+ Cl− NO−3 SO2−4 C2O2−4 Br−
nmol m−3 nmol m−3 nmol m−3 nmol m−3 nmol m−3 nmol m−3 nmol m−3 nmol m−3 nmol m−3 nmol m−3 TM01 41.2±0.7 13.6±0.3 4.3±0.1 1.1±0.1 1.6±0.1 31.3±0.5 9.2±0.1 13.4±0.1 0.18±0.01 0.017±0.006 TM02 81.9±3.9 49.0±0.9 6.9±0.7 2.7±0.2 3.8±0.7 65.2±0.6 26.2±0.4 31.3±0.3 0.17±0.01 <0.016 TM03 130.4±2.6 11.7±0.2 14.3±0.2 2.6±0.1 4.7±0.2 123.5±2.8 7.0±0.2 22.5±0.5 0.21±0.02 <0.035 TM04 76.3±1.3 34.0±0.5 8.1±0.2 2.1±0.1 2.8±0.2 75.4±0.5 16.0±0.1 19.1±0.1 0.22±0.01 <0.034 TM05 66.3±1.6 14.3±0.2 6.7±0.3 1.7±0.1 2.4±0.3 66.0±0.7 5.8±0.3 14.1±0.2 0.15±0.02 <0.032 TM06 49.3±2.4 38.8±0.9 4.2±0.5 1.6±0.1 2.5±0.5 47.6±0.6 21.5±0.3 20.8±0.2 0.20±0.01 <0.017 TM07 127.7±2.7 20.1±0.3 12.8±0.6 3.1±0.2 3.9±0.6 120.0±1.2 8.0±0.6 25.5±0.3 0.25±0.03 <0.055 TM08 70.7±2.2 8.1±0.3 7.7±0.3 1.2±0.2 2.6±0.2 65.8±2.4 5.2±0.3 13.7±0.5 0.16±0.03 <0.039 TM09 215.4±7.5 5.2±0.9 22.7±1.4 5.2±0.3 6.2±1.5 228.2±1.6 6.7±0.7 28.0±0.4 0.19±0.04 <0.055 TM10 108.0±2.4 8.2±0.3 10.9±0.5 2.5±0.2 3.5±0.5 110.2±1.1 5.4±0.5 20.1±0.3 0.10±0.04 <0.047