www.biogeosciences.net/13/4985/2016/
doi:10.5194/bg-13-4985-2016
© Author(s) 2016. CC Attribution 3.0 License.
Box-modelling of the impacts of atmospheric nitrogen deposition and benthic remineralisation on the nitrogen cycle of the eastern tropical South Pacific
Bei Su, Markus Pahlow, and Andreas Oschlies
GEOMAR Helmholtz-Zentrum für Ozeanforschung Kiel, Marine Biogeochemical Modelling, Düsternbrooker Weg 20, 24105 Kiel, Germany
Correspondence to:Bei Su (bsu@geomar.de)
Received: 25 April 2015 – Published in Biogeosciences Discuss.: 2 September 2015 Revised: 21 June 2016 – Accepted: 14 July 2016 – Published: 9 September 2016
Abstract.Both atmospheric deposition and benthic reminer- alisation influence the marine nitrogen cycle, and hence ulti- mately also marine primary production. The biological and biogeochemical relations in the eastern tropical South Pa- cific (ETSP) among nitrogen deposition, benthic denitrifi- cation and phosphorus regeneration are analysed in a prog- nostic box model of the oxygen, nitrogen and phosphorus cycles in the ETSP. Atmospheric nitrogen deposition (≈ 1.5 Tg N yr−1for the years 2000–2009) is offset by half in the model by reduced N2fixation, with the other half transported out of the model domain. Model- and data-based benthic den- itrification in our model domain are responsible for losses of 0.19 and 1.0 Tg N yr−1, respectively, and both trigger nitro- gen fixation, partly compensating for the NO−3 loss. Model- and data-based estimates of enhanced phosphate release via sedimentary phosphorus regeneration under suboxic condi- tions are 0.062 and 0.11 Tg P yr−1, respectively. Since phos- phate is the ultimate limiting nutrient in the model, even very small additional phosphate inputs stimulate primary produc- tion and subsequent export production and NO−3 loss in the oxygen minimum zone (OMZ). A sensitivity analysis of the local response to both atmospheric deposition and benthic remineralisation indicates dominant stabilising feedbacks in the ETSP, which tend to keep a balanced nitrogen inventory;
i.e. nitrogen input by atmospheric deposition is counteracted by decreasing nitrogen fixation; NO−3 loss via benthic den- itrification is partly compensated for by increased nitrogen fixation; enhanced nitrogen fixation stimulated by phosphate regeneration is partly counteracted by stronger water-column denitrification. Even though the water column in our model
domain acts as a NO−3 source, the ETSP including benthic denitrification might be a NO−3 sink.
1 Introduction
Marine primary production (PP) by phytoplankton is a key factor controlling the strength of the oceanic biological car- bon pump and the amount of CO2that is stored in the ocean (Gruber, 2004; Okin et al., 2011). PP is controlled by light and nutrients, such as nitrogen, phosphorus or iron, necessary for the production of phytoplankton. These nutrients are sup- plied to the light-lit surface waters by upwelling, turbulent entrainment of subsurface water, riverine inputs, biological nitrogen fixation, atmospheric deposition and benthic rem- ineralisation (Falkowski et al., 1998; Kasai et al., 2002; Duce et al., 2008; Bakun and Weeks, 2008; Moore and Braucher, 2008).
Nitrogen is often the limiting nutrient for phytoplankton in the ocean (Moore et al., 2013). On the other hand, oceanic nitrogen is thought to adjust, via nitrogen gain and loss pro- cesses, to the marine phosphorus inventory on geological timescales, making phosphorus the ultimate limiting nutrient and nitrogen the proximate limiting nutrient (Tyrrell, 1999).
The ocean’s nitrogen inventory has a turnover time of a few thousand years, being affected by relatively large interact- ing nitrogen sinks and sources. The exact mechanisms and timescales of the interactions are not well understood. Esti- mates of oceanic nitrogen fixation, the main fixed-N source
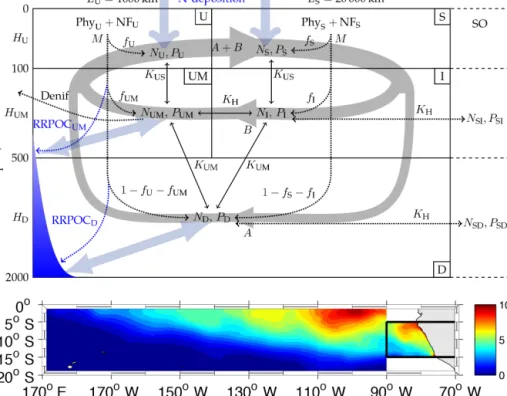
Figure 1.Model structure. The model domain comprises five boxes representing the top 100 m of an upwelling region (U), the underlying oxygen minimum zone (UM), and an adjacent open-ocean basin divided into a surface (S) and an intermediate-depth box (I). A deep box (D) underlies both the upwelling region and the open ocean. The large-scale circulation is represented by deep (A) and shallow (B) convection (thick grey lines). Mixing between boxes is implemented via mixing coefficients (K). Remineralisation derived from primary production by ordinary (Phy) and diazotrophic (NF) phytoplankton in the surface boxes consumes oxygen. Under anoxic conditions remineralisation is fuelled by anaerobic remineralisation (Denif). In the configuration employed in this study, the model domain exchanges nutrients and oxygen with the Southern Ocean (right, denoted as “SO”). Nitrogen deposition and benthic remineralisation are included additionally to represent their influence on the local water-column nutrient concentrations (thick light blue arrows). The graph above is a schematic figure of our model domain; the graph below shows the surface of our model domain, and the colour bar is nitrate concentration in µ mol L−1.
into the ocean, vary from 106 to 330 Tg N yr−1based on both in situ observations and models (Codispoti et al., 2001; Bran- des and Devol, 2002; Gruber and Sarmiento, 2002; Gruber, 2004; Großkopf et al., 2012). Water-column denitrification and anaerobic ammonium oxidation (anammox) in oxygen minimum zones (OMZs), accounting for 100–300 Tg N yr−1, and benthic denitrification, estimated as 95–300 Tg N yr−1, mainly determine the oceanic fixed-N sink (Gruber and Sarmiento, 2002; Gruber, 2004; Codispoti, 2007; Bohlen et al., 2012; Eugster and Gruber, 2012; DeVries et al., 2012).
Due to the large uncertainties in the major sources and sinks of the global nitrogen cycle, the balance of the nitrogen in- ventory in the ocean is still a matter of debate (Gruber, 2004;
Codispoti, 2007; DeVries et al., 2012).
Phosphate can be the ultimate limiting nutrient on geolog- ical timescales even in regions with fixed-nitrogen deficits with respect to the Redfield equivalent of the phosphate concentration (Tyrrell, 1999; Su et al., 2015; Auguéres and Loreau, 2015). The ocean’s phosphorus budget has been sug- gested to be unbalanced in the modern ocean with sedimen- tary burial as the major sink exceeding phosphorus sources
(Wallmann, 2010). This condition might be alleviated by benthic phosphorus regeneration, which can be enhanced un- der low-oxygen bottom waters (O2<20 µmol L−1) (Slomp and Van Cappellen, 2007; Wallmann, 2010; Noffke et al., 2012). Input of bioavailable phosphorus into the ocean stim- ulates primary production, and decomposition of subsequent export production enhances O2 consumption in the ocean, in turn increasing the volume of oceanic oxygen-deficit wa- ter and the fixed-N loss. Consequently, phosphorus regener- ation is expected to be enhanced by enlarging OMZs, possi- bly leading to a positive feedback loop (Van Cappellen and Ingall, 1994; Wallmann, 2003).
Iron (Fe) limitation has been suggested to exert some con- trol on both primary production and N2fixation in the eastern tropical South Pacific (ETSP) (Dekaezemacker et al., 2013), possibly related to relatively low rates of atmospheric Fe deposition in this area in comparison to the eastern tropi- cal North Atlantic (Mills et al., 2004; Moore et al., 2009).
However, ambient Fe concentrations are relatively high, al- lowing complete utilisation of phosphate in the upwelling re- gion of the ETSP (Dekaezemacker et al., 2013). Also, the
stimulation of N2fixation due to Fe enrichment reported by Dekaezemacker et al. (2013) appears positively related to ambient Fe concentration. This is counter to what would be expected if N2fixation was mainly Fe limited. Thus, the role of Fe limitation in the ETSP remains unclear, and we have excluded Fe dynamics from this work, which also facilitates focusing on the influence of benthic nitrogen and phosphate remineralisation in the ETSP.
OMZs also play an important role in the global marine fixed-N budget as they are responsible for a large fraction of total marine fixed-N loss (Canfield, 2006). The relative contribution of heterotrophic denitrification and autotrophic anammox to the total oceanic fixed-nitrogen sink remains de- bated (Lam et al., 2009; Ward et al., 2009). Anammox has been observed to be a major fixed-N loss process in the ETSP (Lam et al., 2009; Kalvelage et al., 2013). However, the es- sential substrates for anammox are ultimately provided by heterotrophic processes (Koeve and Kähler, 2010; Kalvelage et al., 2013), such as organic-matter remineralisation or dis- similatory nitrate reduction to ammonium (DNRA). Thus, both denitrification and anammox are driven by the flux of organic matter into the OMZ. For simplicity, heterotrophic denitrification is considered to be the major fixed-N loss pro- cess in the present study. Continental shelves and the upper continental slopes are the most important sites for benthic fixed-N loss (Christensen et al., 1987; Devol, 1991). How- ever, Bohlen et al. (2011) found that the continental shelf and upper continental slope of the ETSP across a section at 11◦S are sites of nitrogen recycling rather than fixed-N loss be- cause of relatively low rates of denitrification and high rates of NH+4 release from DNRA. This illustrates that the NH+4 released from DNRA should be taken into account when the benthic fixed-N sink is estimated.
In the last few decades, a number of model- and data- based investigations have been carried out on the importance of atmospheric fixed-N input into the ocean for marine bio- geochemical cycles (Duce, 1986; Duce et al., 1991; Krish- namurthy et al., 2007, 2010; Okin et al., 2011; Mouriño- Carballido et al., 2012; Kim et al., 2014). Duce et al. (2008) suggest that anthropogenic nitrogen deposition is rapidly ap- proaching estimates for global oceanic N2 fixation, while preindustrial deposition was an order of magnitude lower.
However, the response of nitrogen fixation and denitrification to atmospheric nitrogen deposition remains an open ques- tion. Atmospheric nitrogen inputs into the global ocean are dominated by inorganic nitrogen from anthropogenic sources (Warneck, 1988; Paerl and Whitall, 1999). The exact mag- nitude of organic nitrogen deposition and its bioavailability are still under appraisement due to a lack of enough obser- vations (Duce et al., 2008; Zamora et al., 2011). Therefore, we apply the finding of Cornell et al. (2003) and Kanakidou et al. (2012) that DON accounts for 30 % of total nitrogen deposition in our model and investigate its role on the ni- trogen budget of the ETSP with the bioavailability measured by Paerl and Whitall (1999). Several scenarios with differ-
ent DON bioavailability are assessed to analyse uncertainties regarding the bioavailability of DON.
Various biogeochemical models have addressed the ef- fects and feedbacks between the major sources and sinks in the marine nitrogen cycle (Van Cappellen and Ingall, 1994; Deutsch et al., 2001, 2007; Krishnamurthy et al., 2007;
Somes et al., 2013; Landolfi et al., 2013). However, most of them have explored only a subset of the atmospheric, pelagic and benthic nitrogen sources and sinks. Using a concep- tually simple and computationally efficient box model, we here attempt a synthesis considering all essential sources and sinks and their mutual interactions, with the only exception of riverine input, which is excluded from our model analysis because it contributes negligibly to the nitrogen inventory in the ETSP (Seitzinger and Kroeze, 1998).
2 Model description
2.1 Circulation and biogeochemical model
The circulation model is the same as in Su et al. (2015), which is a prognostic five-box model to explore the interac- tions among oceanic circulation, nitrogen fixation and water- column denitrification in the OMZ of the ETSP. Briefly, the physical parameters were calibrated to fit the average δ14C (Key et al., 2004) of each box and biogeochemical parameters are constrained by literature data. δ14C is the
13C fractionation-corrected ratio of14C /12C, which is com- monly used in ocean modelling to evaluate and calibrate model physics because it tends to cancel the effect of the biotic downward transport of14C with the rain of organic particles produced by marine organisms. All the simulations in this manuscript employ the Open-boundary+Reduced- denitrification (OBRD) configuration of Su et al. (2015), which allows for the exchange of deep and intermediate ETSP waters with the Southern Ocean (“SO” in Fig. 1) and applies reduced remineralisation rates under suboxic condi- tions. The model domain consists of five boxes represent- ing the water column of an upwelling region and an adja- cent ocean basin. The U box represents the upper upwelling region. The UM box is the OMZ below, where suboxia is expected to develop. The S box represents the surface ocean away from the upwelling zone. Below the S box sits the I box, which represents water of intermediate depth and exchanges water with UM. D is the deep box, which represents water deeper than 500 m (model configuration shown in Fig. 1).
We represent two phytoplankton types in the biogeochem- ical model: ordinary phytoplankton (Phy) and nitrogen fixers (NF) as defined in Su et al. (2015). Both Phy and NF concen- trations are determined by the steady-state balance between net primary production (NPP) and mortality (M), respec- tively, in the U and S boxes. Phy requires both phosphate and nitrate, and growth of Phy is described by a Blackman-type dependence on the nitrate and phosphate limitation terms. NF
can fix N2as long as PO3−4 is available. A quadratic mortal- ity term is adopted for both Phy and NF, considering possible viral lysis, phytoplankton aggregation or a feedback between zooplankton grazing and phytoplankton concentration. N2 fixers are given a lower maximum growth rate, which is one third of the maximum growth rate of ordinary phytoplank- ton, in order to account for the high cost of nitrogen fixation (La Roche and Breitbarth, 2005).
Dead phytoplankton is immediately remineralised in the surface layer and underlying boxes according to the pre- defined remineralisation fractions. Remineralisation occurs preferentially via aerobic respiration, with anaerobic denitri- fication and the associated nitrogen loss setting in only when all O2has been consumed by aerobic respiration. When oxy- gen is exhausted in the OMZ, remineralisation is assumed to slow down by a factor of 5, and accordingly denitrification within the UM box is responsible for one fifth of the remain- ing organic-matter remineralisation, and the remainder will be remineralised in the D box.
In order to represent the nitrogen and phosphate fluxes across the water–sediment interface, remineralisation of par- ticulate organic carbon reaching the sediment (POC rain rate, RRPOC) is included additionally in the UM and D boxes.
RRPOC is calculated according to the method introduced in Sect. 2.4, and we assume that all the POC is buried in the sediment.
2.2 Model configurations
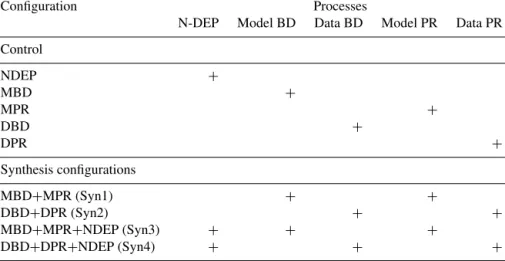
The above descriptions define the control configuration. In order to investigate the model sensitivity to atmospheric nitrogen deposition and benthic remineralisation, we em- ploy another nine model configurations incorporating either a subset or all of these processes, which are summarised in Table 1.
In the NDEP configuration, atmospheric nitrogen input into the surface ocean according to the estimate by Lamarque et al. (2011) is included; MBD and DBD are configurations in which model- and data-based benthic denitrification rates are included in the control configuration; MPR and DPR represent configurations with model- and data-based benthic phosphorus regeneration, respectively. Detailed information of all processes is presented in Sects. 2.3, 2.4 and 2.5; the configuration names are summarised in Table 1.
Nitrogen deposition, benthic denitrification and phosphate regeneration are integrated into the synthesis model configu- rations to explore the model sensitivity to each process and their mutual interactions in the ETSP. Synthesis configura- tion Syn1 includes model-based benthic denitrification and phosphorus regeneration; Syn2 includes the data-based ben- thic denitrification and phosphorus regeneration; Syn3 in- cludes atmospheric deposition in addition to the processes in Syn1; Syn4 includes atmospheric deposition in addition to the processes in Syn2. The synthesis configurations Syn1 to Syn4 are summarised in Table 1.
2.3 Atmospheric nitrogen deposition
Years 2000–2009 levels of dry and wet inorganic nitrogen deposition following the RCP 4.5 scenario (Lamarque et al., 2011) are examined in our work. Inferred atmospheric inor- ganic nitrogen deposition rates are 0.081 and 1.4 Tg N yr−1 (73.1 and 64.9 mg N m−2yr−1) for the U and S box, re- spectively. Note that the circulation remains constant in our model, and only atmospheric nitrogen deposition fluxes are included as an additional annual nitrogen input into the sur- face (U and S) boxes.
Atmospheric phosphorus deposition is excluded from our analysis because its amount is much smaller than the Red- field equivalent of nitrogen atmospheric deposition (Duce et al., 1991). This results in N/P (mole/mole) ratios of more than 100, much higher than the average elemental N/P ratio required by phytoplankton (Duce et al., 2008; Ma- howald et al., 2008).
2.4 Benthic denitrification
The empirical transfer function of Bohlen et al. (2012) is applied to predict benthic inorganic nitrogen loss (LDIN in µmol N m−2d−1) through benthic denitrification, which can account for the net loss of dissolved inorganic nitrogen (DIN) from the sediment.
LDIN=
0.06+0.19·0.99(O2−NO−3)bw
· RRPOC, (1)
where NO−3 and O2 are bottom-water nitrate and oxy- gen concentrations in µmol kg−1, and the RRPOC is in µmol C m−2d−1. Since the bottom-water NO−3 and O2 con- centrations are well known in the ETSP, the uncertainty in our estimation of benthic denitrification comes mostly from uncertainties in the rain rate, which, in turn, de- pends on biological production, as a function of phytoplank- ton biomass and its physiological status. Simulated phyto- plankton concentrations in the surface boxes of the model roughly agree with estimates by Behrenfeld et al. (2005) from Aqua-MODIS satellite data and the Redfield C : N ra- tio (U box: 1.06 µmol N kg−1simulated vs. 0.68 µmol N kg−1 from Aqua-MODIS; S Box: 0.23 µmol N kg−1simulated vs.
0.28 µmol N kg−1from Aqua-MODIS).
2.4.1 Model-based estimation of benthic denitrification Fixed-N losses via benthic denitrification (LDIN) in the UM and D boxes are obtained according to Eq. (1), with the re- spective simulated actual NO−3 and O2concentrations taken as the bottom-water concentrations, and RRPOC is estimated from the export production from of the U and S boxes (EPU and EPS) and the Martin curve (Eq. 2) (Martin et al., 1987):
RRPOC =F· z 100
−b
, (2)
where RRPOC is the rain rate, F is the export pro- duction from both surface boxes and z is the water
Table 1.Summary of model configurations including different processes. Process abbreviations are “N-DEP”, “Model BD”, “Data BD”,
“Model PR” and “Data PR”. N-DEP represents the atmospheric nitrogen input into the surface ocean according to the estimate by Lamarque et al. (2011); Model BD and Data BD represent model- and data-based benthic denitrification, respectively; Model PR and Data PR are model- and data-based benthic phosphorus regeneration, respectively.
Configuration Processes
N-DEP Model BD Data BD Model PR Data PR Control
NDEP +
MBD +
MPR +
DBD +
DPR +
Synthesis configurations
MBD+MPR (Syn1) + +
DBD+DPR (Syn2) + +
MBD+MPR+NDEP (Syn3) + + +
DBD+DPR+NDEP (Syn4) + + +
+Indicates that the process is included.
depth. The bathymetry of the regions of the UM and D boxes is derived from the 2-minute gridded global relief dataset ETOPO2 (http://www.ngdc.noaa.gov/mgg/gdas/gd_
designagrid.html). We applyb=0.82 in Eq. (2), which is the global average according to Berelson (2001) and also close to his estimate for the ETSP. An exponent of 0.4 for Eq. (2) in suboxic water is implied by Van Mooy et al. (2002). There- fore, sensitivity experiments are performed with b=0.4.
From Eq. (2) and the fraction of the lower boundary of the respective box in contact with the seafloor, the RRPOC at the sediment surfaces of the UM and D boxes is calculated according to Eqs. (3) and (4):
RRPOCUM= EPU· SDUM· AMCUM, (3) RRPOCD=(EPU+ EPS)· SDD· AMCD, (4) where EPUand EPU+EPSrepresent the export production (F in Eq. 2) in the upwelling region and the whole model do- main, respectively; AMCUM and AMCD ((100z )−bin Eq. 2) are the average Martin curve values corresponding to the ac- tual water depth (z) in the ETOPO2 data; SDUM and SDD represent the percentages in contact with the sediment in the UM and D boxes, respectively (Table 2).
2.4.2 Data-based estimation of benthic denitrification For a second and independent estimate ofLDIN, we combine observations from different datasets. O2 and NO−3 concen- trations for our model domain are obtained from the annual objectively analysed mean concentrations of the WOA 2009 1◦×1◦data (Garcia et al., 2010a, b) and interpolated over the region of our model domain to match the resolutions of the other datasets.
RRPOC is estimated from primary production follow- ing Bohlen et al. (2012). According to the carbon-based approach of Behrenfeld et al. (2005), average annual pri- mary production is derived from photosynthetically avail- able radiation (PAR), the diffuse attenuation coefficient at 490 nm (K490), chlorophyll a (Chl a) and mixed layer depth (MLD). PAR, K490 and Chl a are from the Aqua- MODIS satellite data (2005–2010) (http://oceancolor.gsfc.
nasa.gov/), and MLD is from the Hybrid Coordinate Ocean Model (HYCOM, http://orca.science.oregonstate.edu/1080.
by.2160.monthly.hdf.mld.hycom.php). Export production is estimated from primary production and sea-surface temper- ature (SST) (Dunne et al., 2005), where SST is from the WOA 2009 annual average 1◦×1◦ temperature data (Lo- carnini et al., 2010). The rate of particle transport at each grid cell to the seafloor is calculated using the Martin curve (Eq. 2) (Martin et al., 1987). To obtain more accurate esti- mates for RRPOC of our regional box model, all data pro- cessed in this experiment are interpolated on a grid of 20×20 in the UM box and 200×200in the D box, and the ETOPO2 data (20×20) are averaged within each 200×200grid cell in the D box. The Aqua-MODIS data (50×50) and NO−3 and O2 concentrations from WOA 2009 dataset are interpolated or averaged horizontally to match these resolutions. The verti- cal resolution of the NO−3 and O2concentrations are inter- polated to resolve the bathymetry of the ETOPO2 data, and the NO−3 and O2concentrations closest to the sediment are applied in Eq. (1) for the bottom-water NO−3 and O2concen- trations.
Finally, the LDIN derived from observational datasets is averaged over the regions represented by UM and D boxes to produce an annual NO−3 loss term.
2.5 Phosphorus regeneration
Phosphorus regeneration is estimated according to Wallmann (2010) and Flögel et al. (2011), with both model- and data- based estimates for the rain rate. We estimate benthic PO3−4 regeneration (resupply of benthic PO3−4 to the water column, BenDP) from the RRPOC degradation ratio (rREG) and the POC burial rate in the sediments (BURPOC) according to BenDPUM=RRPOCUM− BURPOCUM
rREG , (5)
BenDPD=min
RRPOCD−BURPOCD
rREG ,RRPOC
106
, (6) where RRPOC is estimated with the methods described in Sections. 2.4.1 and 2.4.2. A minimum condition is intro- duced in the D box to prevent BenDPexceeding the rain rate of particulate organic phosphate (RRPOP=RRPOC/106) to the deep ocean but not for the UM box because there are possible extra sources of RRPOP, such as inputs via weath- ering or eolian deposition, for the continental shelf, which is contained in the UM box in our model.
BURPOC is estimated from Eq. (7) for the continen- tal shelf (UM box) and Eq. (8) for the deep-sea sediment (D box), and rREG is the C : P regeneration ratio estimated via Eq. (9) following the empirical relations of Wallmann (2010).
BURPOCUM=0.14· RRPOC1.11UM, (7)
BURPOCD=0.014· RRPOC1.05D , (8)
rREG=123+(−112)·exp
−O2 32
, (9)
where O2is the oxygen concentration in the ambient bottom water (in µmol kg−1).rREGin Eq. (9) is higher than the Red- field ratio in oxic water, resulting in preferential P burial un- der oxic conditions;rREGis much smaller than the Redfield ratio when O2<20 µmol kg−1, indicating excess phosphate release from the sediment under suboxic conditions.
2.6 Model sensitivity experiments
Since the atmospheric nitrogen deposition data from Lamar- que et al. (2011) only include results of a single chemistry–
climate model, a multi-model perspective could offer addi- tional insights into the influence of uncertainties in nitrogen deposition on our model results. Three recent inter-model comparisons (Dentener et al., 2006; Lamarque et al., 2013;
Vet et al., 2014) show very similar performance over our model domain; therefore, we choose the results from Den- tener et al. (2006), which is also applied in a number of benchmark papers such as Duce et al. (2008). The influ- ence of DON from the atmospheric nitrogen deposition on the nitrogen budget is investigated by applying the fact that DON accounts for 30 % of the total dissolved nitrogen de- position suggested by Cornell et al. (2003) and Kanakidou
et al. (2012). The bioavailability of the deposited DON is also considered by assuming that 30 % of it is available to primary producers according to Paerl and Whitall (1999). In addition, 10 and 50 % bioavailability is also applied in our model to account for the underlying uncertainties. Consider- ing the rapid rise of nitrogen deposition (Duce et al., 2008), we also apply the RCP 8.5 scenario for the year 2100 pre- dicted by Lamarque et al. (2011) in our model domain.
Bonnet et al. (2013) reported a large quantity of aphotic nitrogen fixation in the ETSP, which can account for as much as 90 % of the total fixed-N input via nitrogen fixa- tion there. To test the effect of aphotic nitrogen fixation on the nitrogen budget of the ETSP, we include the aphotic ni- trogen fixation rate measured by Bonnet et al. (2013) as addi- tional NO−3 input in two sensitivity experiments: AphoticN- fix1 and AphoticNfix2. Due to the very low sampling den- sity of their data, we extrapolate their data to our model domain and assume that the nitrogen fixation rate in the open ocean is the same as that measured at the coast.
Aphotic nitrogen fixation is responsible for 0.0711, 0.0528 and 0.0528 µmol N kg−1yr−1(0.44, 6.5 and 25.6 Tg N yr−1) fixed-N input into the UM, I and D boxes, respectively, with estimates from the 2010 cruise (AphoticNfix1). It con- tributes 0.0109, 0.0057 and 0.0059 µmol N kg−1yr−1(0.067, 0.70 and 2.9 Tg N yr−1) when applying estimates for the 2011 cruise (AphoticNfix2).
Since our model domain only includes the top 2000 m of the water column, the sediments only account for a small por- tion of the whole sediment of the ETSP (Table. 2). A sen- sitivity experiment “high-BD/PR” is performed with the as- sumption that all of the bottom of the D box is in contact with the sediment below 500 m (high benthic denitrification (high- BD), or high phosphorus regeneration (high-PR)) including all NO−3 losses by benthic denitrification and phosphate re- lease by phosphorus regeneration in the sediment.
The original work of Martin et al. (1987) and Van Mooy et al. (2002) indicates a lower value for the exponentb of Eq. (2) in suboxic water. We perform an additional sensitiv- ity experiment withb=0.4 according to the suggestion by Van Mooy et al. (2002) to explore the influence of benthic denitrification and phosphorus regeneration under conditions of slower POC remineralisation.
We perform another sensitivity experiment to explore the influence of organic-matter remineralisation on the benthic denitrification and phosphorus regeneration with more re- cent findings (Guidi et al., 2015), where we apply the vari- able Martin curve exponentb values in our model domain.
In the UM box,b=0.83, which corresponds to the Peru–
Chile upwelling region, is applied, whereasb=0.85 is ap- plied in the D box, which is the average of thebvalues for the regions named Chile–Peru Current Coastal (CHIL), Pa- cific Equatorial Divergence (PEQD), South Pacific Subtrop- ical Gyre (SPSG) and Western Pacific Warm Pool (WARM) in Guidi et al. (2015).
Table 2.Summary of data-based flux estimates. “N deposition” is the annual nitrogen input via atmospheric deposition; “Sediment percent- age” is the percentage of the surface areas of the UM and D boxes in contact with the sediment; “Average Martin curve fraction” represents the average fractions (calculated from the Martin curve) of export production reaching the sediment for each grid point of the topography data; “NPP” is the net primary production estimated from Aqua-MODIS satellite data; “Data BD” and “Data PR” represent fixed-N loss via benthic denitrification and phosphate release via phosphorus regeneration in the UM and D boxes, respectively. High-BD indicates that the full sediment of the D box is included to estimate NO−3 loss via benthic denitrification and phosphate release via phosphorus regeneration.
N deposition Sediment Average Martin NPP Rain rate Data BD Data PR percentage curve fraction
(Tg N yr−1) (SD, %) (AMC, %) (mg C m−2d−1) (Tg N yr−1) (Tg P yr−1)
U box 0.081a
0.12±0.052b
S box 1.4a
1.6±0.63b
UM box 0.81c 53.04c,d 1374.7e 148.4f 0.17g 0.058h
D box 2.25c 12.51c,d 873.9e 12.2f 0.82g 0.056h
D box (high-BD/PR) 873.9e 12.2f 8.8g 0.56h
Equations Eq. 2 Eqs. 3, 4 Eqs. 1 Eqs. (5–9)
aNitrogen deposition estimated from a chemistry–climate model by Lamarque et al. (2011).bAverage nitrogen deposition estimated from 23 atmospheric chemistry transport models by Dentener et al. (2006).cTwo-minute Gridded Global Relief Data (http://www.ngdc.noaa.gov).dThe Martin curve exponentb=0.82is from Berelson (2001).eNPP is estimated according to Behrenfeld et al. (2005). PAR, K490 and Chlaare from the Aqua-MODIS satellite data (http://oceancolor.gsfc.nasa.gov/); MLD data are from the Hybrid Coordinate Ocean Model (HYCOM,
http://orca.science.oregonstate.edu).fExport production is estimated from NPP and SST according to Dunne et al. (2005); SST is from the World Ocean Atlas annual average 1◦×1◦temperature (Locarnini et al., 2010).gBD is estimated from RRPOC applying the empirical transfer function of Bohlen et al. (2012).hPR is estimated from RRPOC following the empirical relationship of Wallmann (2010) and Flögel et al. (2011).
3 Results
3.1 Nitrogen deposition
Due to the low NO−3 concentrations in the surface U and S boxes, the annual nitrogen input by atmospheric nitrogen de- position accounts for 63 and 10 %, respectively, of nitrogen inventories of the U and S boxes.
Figure 2 indicates that the extra bioavailable nitrogen in- put by nitrogen deposition reduces the growth of nitrogen fixers in the surface ocean mainly in the U box, even though more nitrogen is deposited in the S box. Nitrogen fixation is reduced by about 0.7 and 0.1 Tg N yr−1, respectively, in the U and S boxes (about 18 and 5 % of the total). The reduc- tion in nitrogen fixation accounts for about 48 % of the total bioavailable nitrogen inputs into surface waters from atmo- spheric deposition (1.5 Tg N yr−1).
Water-column denitrification stays almost unchanged be- cause the increase in export production (EP) by Phy (ordi- nary phytoplankton) is almost exactly compensated for by the decrease in EP of NF, resulting in essentially unchanged total EP. As a result of the ≈50 % of the nitrogen depo- sition not compensated for by lower nitrogen fixation, the model domain becomes a larger fixed-N source (Fig. 2).
The fixed-N loss through the lateral boundary increases from 0.93 Tg N yr−1in the control configuration to 1.7 Tg N yr−1 in the configurations including nitrogen deposition, leading
Control NDEP Syn3 Syn4
−10
−5 0 5 10
1.4 1.4 1.4
0.081 0.081 0.081
2 1.9 2 2
3.9 3.2 4 4.4
Flux(TgNyr−1)
Lateral-flux NfixU NfixS WC-denif Benthic-denif NdepU NdepS
−0.19 −1
−4.9
−4.9 −5.4 −5.6
−0.93 −1.7 −1.9 −1.3
Figure 2.Nitrogen fluxes after including atmospheric nitrogen de- position in the control, Syn3 and Syn4 configurations defined in Table 1. Lateral-flux is the nitrogen efflux or influx through the southern boundary; NfixU and NfixS represent the nitrogen fixa- tion rate by NF, respectively, in the U and S boxes; WC-denif is water-column denitrification; NdepU and NdepS are the nitrogen input into surface U and S boxes via nitrogen deposition.
to about 0.78 Tg N yr−1 extra fixed-N loss from the model domain, i.e. about 50 % of the total bioavailable nitrogen in- put from atmospheric deposition. Thus, almost all the extra nitrogen input into the model domain via nitrogen deposition is offset by reduced nitrogen fixation and enhanced lateral transport out of the model domain.
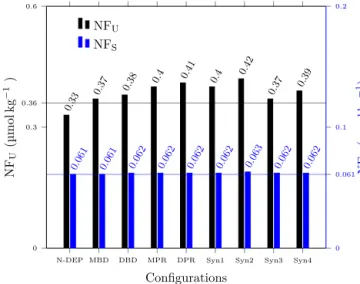
Nitrogen deposition has no significant influence on bio- geochemical tracer concentrations of the model in steady state: Phy concentration increases by 3 % in the U box and even smaller changes occur in the S box, which can be at- tributed to the stronger nitrogen deficit in the region above the OMZ (U box) than in the open ocean (S box) (Fig. S2 in Supplement). The largest effect is a decrease by about 9 % of the concentration of NF in the U box, partly counteracting the nitrogen input via nitrogen deposition (Fig. 3). NF con- centration stays almost unaltered in the S box (Fig. 3). Slight variations of the NO−3 concentration occur in the UM box and of O2concentrations in the I and D boxes (Fig. S2).
3.2 Benthic denitrification
The data-derived benthic denitrification and phosphorus re- generation in the UM and D boxes are shown in Table 2.
Modelled NPP in the surface ocean above the UM and D boxes is, respectively, 1.4 and 0.87 g C m−2day−1, indicating higher NPP in the coastal upwelling region and lower NPP in the open ocean adjacent to the upwelling region, which is consistent with the estimate by Behrenfeld et al. (2005). Due to the small sediment-area percentages, the annual nitrogen loss by benthic denitrification is 0.17 and 0.82 Tg N yr−1in the UM and D boxes, accounting for only about 0.14 % and 5.1×10⁻³% yr−1, respectively, of the NO−3 inventories in these boxes (Table 2). The higher sedimentary NO−3 sink in the UM box can be attributed to the anoxic conditions and larger RRPOC.
Our simulated biogeochemical tracer concentrations in steady state are quite robust with respect to benthic denitrifi- cation (Fig. 3). Including benthic denitrification causes only minor deviations in the MBD and DBD configurations com- pared to the control run. Nitrogen fixation rates increase by about 2.9 and 5.8 %, respectively, in the MBD and DBD con- figurations (A bars in panels MBD and DBD of Fig. 4). Most of this increase occurs in the U box, which receives water with a strong N deficit via upwelling.
Obviously, the response is stronger in the DBD configura- tion than in the MBD configuration because fixed-N loss via benthic denitrification in the DBD configuration is approxi- mately 5 times larger (A bars in Fig. 4). The DBD configu- ration results in a stronger responses of nitrogen fixation and lateral fluxes to benthic denitrification: the increase in nitro- gen fixation cannot fully compensate for the nitrogen loss by benthic denitrification. Thus, the model domain becomes a smaller fixed-N source, about 25 % of that in the control con- figuration. In other respects, the steady-state solutions of the MBD and DBD configurations are almost identical to those of the control configuration after including benthic denitrifi- cation (Fig. S3). The temporal development of biogeochemi- cal tracer concentrations is also insensitive to the presence or absence of benthic denitrification (Fig. S3).
N-DEP MBD DBD MPR DPR Syn1 Syn2 Syn3 Syn4 0
0.3 0.36 0.6
0 0.061 0.1 0.2
0.33 0.37 0.38 0.4 0.41
0.4 0.42
0.37 0.39
Configurations NFU(µmolkg−1)
NFU
NFS
0.061 0.061
0.062 0.062
0.062 0.062
0.063 0.062
0.062 NFS(µmolkg−1)
Figure 3.Sensitivity of simulated steady-state concentrations of nitrogen fixers NFU and NFS in the U and S boxes, respec- tively. Horizontal grey and light blue lines represent the NFU and NFSconcentrations in the control configuration, respectively. Syn1, Syn2, Syn3 and Syn4 denote the “MBD+MPR”, “DBD+DPR”,
“MBD+MPR+NDEP”, and “DBD+DPR+NDEP” synthesis configurations defined in Table 1.
3.3 Phosphorus regeneration
Phosphate release by phosphorus regeneration accounts for about 0.23 % and 2.2×10⁻³% yr−1, respectively, of the to- tal phosphate inventories in the UM and D boxes (Table 2).
The higher sedimentary PO3−4 source in the UM box can be attributed to the anoxic conditions and larger RRPOC. The phosphate release associated with benthic phosphorus regen- eration can stimulate nitrogen fixation and EP from the sur- face ocean, followed by higher water-column denitrification, owing to enhanced decomposition of exported organic mat- ter (A bars in MPR and DPR panels in Fig. 4). In the MPR configuration, nitrogen fixation increases by about 18 % in the U box and stays almost unchanged in the S box. In the DPR configuration, nitrogen fixation also increases by about 23 % in the U box when benthic phosphate release is in- cluded (Fig. 4). Water-column denitrification increases by 10 and 14 %, respectively, in the MPR and DPR configurations (Fig. 4).
Compared to the MBD and DBD configurations, benthic phosphorus regeneration does not turn our model domain into a smaller fixed-N source, in spite of higher water-column denitrification because enhanced nitrogen fixation compen- sates for the extra nitrogen loss (A bars in Fig. 4).
While changes in nitrogen deposition and benthic denitrifi- cation are to a large extent compensated for by adjustments in nitrogen fixation, phosphate is the ultimate limiting nutrient in our model domain (Su et al., 2015). Hence, the extra phos- phate input into the model domain by benthic phosphorus regeneration has a more significant influence on the steady-
Control MBD DBD MPR DPR MBD+MPR DBD+DPR
−15
−10
−5 0 5 10 15
C C
C C C
C
B
B B
B B
B A A A A A
A
2 2 2 2 2 2
4.1 4.2 4.6 4.8 4.7 5.1
Flux(TgNyr−1)
Lateral-flux NfixU NfixS WC-denif Benthic-denif
−0.19 −1
−0.19 −1
−5 −5
−5.4 −5.6 −5.4 −5.6
−0.9 −0.23 −1.2 −1.3 −1.1 −0.53
2 2
2.5
2
2.3 2
3.2
3.9 4.2
5.1
4.5 5.8 4.8
6.7
0.11
6.4 5.4
−1.3
−9
−1.4
−9
−4.9 −5 −5.1
−5.4 −6.4
−5.4 −6.4
−0.93 0.11 −1.2 −1.8 −0.016
6.4 5.4
2
2 2
2.3
2
2.6
4.1
4.7 4.8 6.1 4.9 6.7
1.3 0.23
−0.26 −3 −0.26
−3
−5 −5
−5.6
−6.6 −5.6 −6.6
−0.87 1.3 −1.3 −1.8 −1.1 0.23
Figure 4.Nitrogen fluxes after including benthic denitrification and/or phosphorus regeneration. Lateral-flux is the nitrogen efflux or influx through the southern boundary; NfixUand NfixSrepresent the nitrogen fixation rate by NF in the U and S boxes, respectively; WC-denif is water-column denitrification; Benthic-denif represents the fixed-N loss via benthic denitrification in the model domain. Bar labels: A, main experiments; B, sensitivity experiments with high-BD; C, sensitivity experiments with Martin curve exponentb=0.4.
state model results than the perturbations of the nitrogen in- puts or losses (Fig. 3). Phy concentration in the DPR config- uration decreases in the U box but remains unchanged in the S box (Fig. S2). Phy concentrations in the U and S boxes re- main almost unaltered in the MPR configuration. Compared with the control configuration, NF concentrations in the U and S boxes increase by 11 and 1.6 %, respectively, in the MPR configuration and by 14 and 1.6 %, respectively, in the DPR configuration (Fig. 3). The nitrate concentration in the UM box decreases by about 4.2 % in the MPR configuration and 5.2 % in the DPR configuration (Fig. S2). The tempo- ral development of biogeochemical tracer concentrations ap- pears robust to benthic phosphorus regeneration (Fig. S4).
3.4 Synthesis configurations
In the synthesis configurations (Table 1), phytoplankton, nu- trient and oxygen concentrations are quite robust with respect to the various fluxes associated with nitrogen input or re- moval and phosphate release from the sediment into the wa- ter column (Fig. S2). However, the interactions among nitro- gen fixation, water-column denitrification, and benthic den- itrification and phosphorus regeneration result in different sensitivities of nitrogen fixation and of the lateral fluxes to atmospheric N deposition in the presence of benthic denitri- fication and phosphorus regeneration (Fig. 3). In contrast to the NDEP configuration, nitrogen fixation rates in the Syn3 and Syn4 configurations increase by about 1.7 and 8.5 %, in spite of the additional nitrogen input into the model domain by atmospheric nitrogen deposition. Most of this increase oc-
curs in the U box, whereas almost no change happens in the S box.
The lateral fixed-N flux out of the model domain (NO−3 source) increases by about 0.97 Tg N yr−1in the Syn3 con- figuration, which accounts for about 65 % of the total atmo- spheric nitrogen deposition; i.e. more than half of the extra nitrogen supplied by nitrogen deposition is not utilised lo- cally. However, in the Syn4 configuration, the increase in lateral NO−3 efflux only accounts for about 25 % of the to- tal nitrogen deposition, with 75 % of the deposited nitrogen utilised within the model domain. Less fixed N is lost lat- erally from the model domain in the configurations includ- ing data-based estimates than in those including model-based estimates, due to more NO−3 loss within the model domain (Fig. 4). Thus, the sensitivity of lateral fluxes and the fixed-N budget to nitrogen deposition is strongly controlled by ben- thic denitrification and phosphorus regeneration.
3.5 Model sensitivity
The nitrogen deposition rate estimated by Dentener et al.
(2006) is about 48 and 14 % higher, respectively, in the U and S boxes than the estimate of Lamarque et al. (2011). How- ever, this increase induces only a 3.1 % decrease in nitrogen fixation in the U box and a 5.9 % increase in lateral nitrogen flux, while water-column denitrification and nitrogen fixation in the S box remain unchanged (A and B bars in panel NDEP of Fig. 5). Whereas the uncertainty associated with the ni- trogen deposition estimate of Dentener et al. (2006) amounts to about±40 %, the nitrogen fixation rate in the U box and
lateral flux only vary by about ±9.7 and ±20 %, respec- tively (panels NDEP-low and NDEP-up in Fig. 5). Effects of accounting for atmospheric deposition of bioavailable DON are investigated in three sensitivity experiments with different scenarios for DON bioavailability (panels NDEP- DON(10 %), NDEP-DON(30 %) and NDEP-DON(50 %) in Fig. 5). Including bioavailable atmospheric DON in addition to DIN deposition causes only minor changes, i.e. slightly lower nitrogen fixation and slightly higher lateral nitrogen ef- flux. The RCP 8.5 scenario projects about a 7.2 % increase in nitrogen deposition for the year 2100 compared to our main experiment (2000–2009 average according to the RCP 4.5 scenario), causing only negligible changes to the nitrogen budget in our model domain (A bars in panels NDEP and NDEP-2100 of Fig. 5). These sensitivity experiments show that variations in nitrogen deposition are largely offset by changes in nitrogen fixation and lateral nitrogen flux out of the model domain, tending to keep a balanced nitrogen in- ventory.
The effect of aphotic nitrogen fixation is investigated in the AphoticNfix1 and AphoticNfix2 configurations, where photic nitrogen fixation decreases by 39 and 15 %, respec- tively (Fig. S5). Water-column denitrification remains un- changed because more nitrogen input by aphotic nitrogen fix- ation does not increase export production to the OMZ. The lateral fixed-N effluxes in the AphoticNfix1 and AphoticN- fix2 configurations are about 33 and 4 times those in the control configuration, accounting for about 91 and 78 %, re- spectively, of extra nitrogen input by aphotic nitrogen fixa- tion (Fig. S5). Aphotic N2 fixation has little effect on most tracers except NO−3, which increases by 110 and 87 %, re- spectively, in the UM box and the whole model domain for AphoticNfix1, which is a strong overestimate compared to WOA 2009 data (Fig. S6). The lower estimate of aphotic N2 fixation (AphoticNfix2) brings the NO−3 concentrations closer to the WOA 2009 data (Fig. S6), and the associated changes in nitrogen fluxes are similar to our other sensitivity configurations (Figs. 5 and S5). As for the sensitivity with re- spect to atmospheric nitrogen deposition, these changes are largely compensatory, leading to only small changes in the nitrogen budget of our model domain.
Figure 6 shows the results of the sensitivity experiments with high-BD and high-PR. Compared with Fig. 3, the influ- ence on the biogeochemical tracer concentrations in steady state is stronger, due to the larger NO−3 loss via benthic den- itrification and PO3−4 release via phosphorus regeneration (Table 2). High-BD or high-BD together with high-PR can even turn our model domain into an NO−3 sink (B bars in panels DBD and DBD+DPR of Fig. 4).
Applying the Martin curve exponent b=0.4 also ampli- fies the influence of benthic denitrification and phosphorus regeneration on phytoplankton and biogeochemical tracers, although the effect is weaker than in the high-BD and high- PR configurations. For example, NFUincreases by as much
as 33 % in the DBD+DPR configuration, and NFS increase about 15 % (Fig. 7). Compared with A bars in Fig. 4, this en- hanced influence results from the higher NO−3 loss through benthic denitrification and phosphate input via phosphorus regeneration (C bars in Fig. 4).
Spatial variations in the Martin curve exponentbas sug- gested by Guidi et al. (2015) result in nitrogen fluxes and concentrations in steady state which are in good agreement with those in our main configurations (A and C bars in Figs. S7 and S8) because thebvalues from Guidi et al. (2015) are all very close tob=0.82, as used in our main configura- tions.
Due to the higher RRPOC reaching the sea floor under suboxic conditions, benthic denitrification increases by about 42 and 198 % (A and C bars of panels MBD and DBD in Fig. 4) and phosphorus regeneration increases by about 36 and 200 %, respectively, in model- and data-based estima- tions in the sensitivity experiments with Martin curve value b=0.4. Our model domain switches to a NO−3 sink in the DBD and DBD+DPR configurations withb=0.4 (C bars in Fig. 4). Comparing the A and C bars of panel DBD in Fig. 4, we find that higher benthic denitrification can stim- ulate nitrogen fixation, but water-column denitrification re- mains constant. However, comparing the A and C bars of panel DBD+DPR in Fig. 4, we find that higher benthic den- itrification can increase nitrogen fixation and water-column denitrification, indicating an important role of PO3−4 in bal- ancing the nitrogen inventory. This shows a positive feed- back between water-column denitrification in the OMZ and benthic denitrification below, caused by slower remineralisa- tion under anoxic conditions, which results in more RRPOC reaching the sea floor. All above comparisons indicate that phosphate limitation could be responsible for breaking this positive feedback under the assumption of our model that PO3−4 is the only limiting factor for the growth of nitrogen fixers.
4 Discussion and conclusions
The impact of nitrogen deposition on the ETSP has rarely been investigated so far, since this region is believed to re- ceive less bioavailable nitrogen from atmospheric deposition than the coasts of western Europe, south and east Asia (Den- tener et al., 2006; Duce et al., 2008). The influence of anthro- pogenic nitrogen deposition on the biogeochemical cycles of the open ocean is increasing and the increase in atmospheric nitrogen deposition will probably induce an approximately 10 % rise in carbon sequestration on land and in the ocean by 2030 (Duce et al., 2008; Reay et al., 2008). The ETSP, a typical N-deficit region due to denitrification in the OMZ, is likely to be sensitive to anthropogenic nitrogen deposition.
We find that, in our model, nitrogen deposition can inhibit N2 fixation by relieving nitrogen limitation for Phy, which coun- teracts the effect of atmospheric nitrogen input. This is in line
Control NDEP NDEP-low NDEP-up NDEP-DON(10%) NDEP-DON(30%) NDEP-DON(50%) NDEP-2100
−10
−5 0 5 10
B B
B B
B B A A A A
A
1.4 1.5 1.6 1.8 1.5
0.081 0.084 0.092 0.098 0.087
1.9 1.9 1.9 1.9 1.9
3.2 3.2 3.1 3 3.2
Flux(TgNyr−1)
Lateral-flux NfixU NfixS WC-denif NdepU(bioavailable) NdepS(bioavailable)
−4.9 −4.9 −4.9 −4.9 −4.9
−1.7 −1.7 −1.8 −1.9 −1.7
1.6 0.97 2.3 1.7 1.8 2
0.12 0.068 0.17 0.12 0.13 0.14
2 1.9 1.9 1.9 1.9 1.9 1.9
3.9 3.1 3.4 2.8 3.1 3 2.9
−4.9
−4.9 −4.9
−4.9 −4.9 −4.9 −4.9
−0.93 −1.8 −1.4 −2.1 −1.8 −1.9 −2
Figure 5. Sensitivity of nitrogen fluxes to atmospheric inorganic and organic nitrogen deposition and associated uncertainties. Lateral- flux is the nitrogen efflux or influx through the southern boundary; NfixUand NfixS represent the bioavailable nitrogen fixation rate by NF in the U and S boxes, respectively; WC-denif is water-column denitrification; NdepU and NdepS are the nitrogen input into surface ocean (U and S boxes) via nitrogen deposition. Bar labels: A, nitrogen deposition data from Lamarque et al. (2011); B, nitrogen deposition data from Dentener et al. (2006). In NDEP-low and NDEP-up, the lower and upper limit of nitrogen deposition fluxes are included; in NDEP-DON(10 %), NDEP-DON(30 %) and NDEP-DON(50 %), the bioavailability of deposited DON is assumed to be 10, 30 and 50 %, respectively; in NDEP-2100, nitrogen deposition is estimated according to the RCP8.5 scenario projections for 2100 (Lamarque et al., 2011).
MBD DBD MPR DPR MBD+MPR DBD+DPR 0
0.3 0.36 0.6
0 0.061 0.1 0.2
0.38 0.42 0.39
0.44 0.4
0.48
Configurations (high-BD/PR) NFU(µmolkg−1)
NFU
NFS
0.062 0.069
0.062 0.067 0.062
0.078 NFS(µmolkg−1)
Figure 6.Sensitivity of simulated steady-state concentrations of ni- trogen fixers (NFU and NFS) in the U and S boxes, respectively, after incorporating high-BD and high-PR. Horizontal grey and light blue lines represent the NFUand NFSconcentrations in the control configuration.
with the finding that N2fixation decreases with increasing ni- trogen deposition in global-scale models that use essentially the same assumptions about the environmental controls on marine nitrogen fixation (Krishnamurthy et al., 2007, 2009, 2010; Zamora et al., 2010). Another portion of the deposited nitrogen is exported out of the model domain since not all the deposited nitrogen can be taken up by Phy locally, owing to phosphate limitation (Fig. 2).
The coastal upwelling region (the U box) in our model is more sensitive to nitrogen deposition due to the N-deficit wa-
MBD DBD MPR DPR MBD+MPR DBD+DPR 0
0.3 0.36 0.6
0 0.061 0.1 0.2
0.37 0.4
0.4 0.46
0.41 0.48
Configurations (b=0.4) NFU(µmolkg−1)
NFU
NFS
0.061 0.062
0.062 0.066
0.062 0.07 NFS(µmolkg−1)
Figure 7.Sensitivity of simulated steady-state concentrations of ni- trogen fixers (NFU and NFS) in the U and S boxes, respectively, after applyingb=0.4 for Eq. (2). Horizontal grey and light blue lines represent the NFUand NFSconcentrations in the control con- figuration.
ter supplied by upwelling (Fig. 5). In spite of the uncertain- ties in the magnitude of atmospheric bioavailable nitrogen deposition and the bioavailability of deposited DON, atmo- spheric deposition appears unable to exert a strong influence on the fixed-N budget of our model domain, as nitrogen de- position is mostly counteracted by decreased nitrogen fixa- tion and enhanced nitrogen export out of the model domain.
Replacing obligate N2 fixation in our model by faculta- tive N2fixation slightly enhances the strength of the negative
Sediment N2fixation
Atmospheric deposition
NO3–source
Oxygen minimum zone water-column denitrification
P regeneration Benthic denitrification
Figure 8.Schematic of the model sensitivity to different processes related to the nitrogen budget of the ETSP. The red solid lines repre- sent stimulatory effects, and the black solid lines represent depres- sive effects.
feedback between nitrogen fixation and nitrogen deposition (see Sect. S1 in the Supplement for details).
The NPP estimated in our study is on average 1.4 and 0.87 g C m−2d−1, respectively, in the surface ocean above the UM and D boxes, according to the carbon-based ap- proach of Behrenfeld et al. (2005). Pennington et al. (2006) estimated NPP from ship-collected data as, respectively, 1.2 and 0.67 g C m−2d−1 for the surface ocean above the UM and D boxes, whereby the NPP for the surface ocean above the D box could be somewhat overestimated because the western boundary for their data is 140◦W. Our estimates are about 17 and 30 % higher than those of Pennington et al.
(2006) for the surface ocean above the UM and D boxes be- cause the carbon-based approach of Behrenfeld et al. (2005) yields considerably higher values than other approaches for tropical regions. Export production is linearly related to RRPOC (Eq. 2), as is RRPOC to BD (Eq. 1). PR and RRPOC are related through a power law with exponents of 1.11 and 1.05 for the UM and D boxes, respectively (Eqs. 5–8). Fixed- N loss via BD and PO3−4 release by PR estimated with ship- collected data should thus be within the range correspond- ing to the NPP estimates from Behrenfeld et al. (2005) and Pennington et al. (2006). However, in our data-based estima- tion of BD and PR, the fixed-N loss by BD and PO3−4 re- lease by PR is, respectively, 421 and 140 % higher than our model-based estimates. Therefore, the NPP estimated from ship-collected data lead to benthic remineralisation fluxes be- tween our data-based and model-based estimations.
Aphotic nitrogen fixation, i.e. below the euphotic zone, has been considered an important contribution to the nitrogen budget of the ETSP (Bonnet et al., 2013). Our model con- figurations including aphotic N2fixation are in line with this
view, as the large amount of additional nitrogen input in the AphoticNfix1 configuration induces overestimation of NO−3 concentrations in the model domain, whereas NO−3 concen- tration is closer to the WOA 2009 data in the AphoticNfix2 configuration, which has a much lower aphotic nitrogen fixa- tion rate. Due to the very sparse data for aphotic N2fixation, we had to extrapolate the data for the coastal region to the vast open ocean of the ETSP, which could have led to an overestimation of aphotic nitrogen fixation. Thus, we expect that aphotic N2fixation is likely closer to the lower (2011) estimate of Bonnet et al. (2013), as the resulting NO−3 con- centrations are closer to the WOA 2009 data.
Table 3 shows our modelled fluxes in comparison with other model-based and observational estimates. N2fixation in the upwelling region of our model is higher than those reported by Somes et al. (2010), DeVries et al. (2013), and Dekaezemacker et al. (2013) but within the range sug- gested by Loescher et al. (2014). However, the N2 fixation rate in the open ocean of our model is lower than those by Somes et al. (2010) and DeVries et al. (2013) but within the range suggested by Halm et al. (2012). Water-column deni- trification is comparable to Somes et al. (2010) and DeVries et al. (2013) but lower than that from Kalvelage et al. (2013).
Our predicted fixed-N loss by benthic denitrification is com- parable to other estimates. Phosphorus regeneration in our analysis spans a wide range but is comparable to the evalu- ation of Bohlen et al. (2012) for the full depth of the model domain. Major nitrogen and phosphorus fluxes in our study also span wide ranges because fluxes both from the upper 2000 m and full depth of the ocean are assessed with both data and model-based evaluations, in each case accounting for organic-matter remineralisation under different oxygen conditions (Table 3). Currently, both global and regional esti- mates of nitrogen fixation and benthic remineralisation rates are rather uncertain, owing to temporal and spatial variations and problems associated with measuring methods (e.g. Mohr et al., 2010). Thus, we had to apply rather wide ranges in or- der to investigate the potential influence of these processes on the nitrogen budget of our model domain.
Under the assumption that N2 fixation compensates for any fixed-N deficit (Deutsch et al., 2007), nitrogen fixation can be stimulated by benthic denitrification.
Somes et al. (2013) found that benthic denitrification stim- ulates N2fixation in their 3-D biogeochemical model, which was tuned under the condition that the global fixed-N budget was balanced. Even though we make no a priori assumption about the association between N2 fixation and fixed-N loss processes, we also find that a fixed-N deficit can stimulate N2fixation, thus compensating for the fixed-N loss.
We find that incorporating benthic phosphorus regenera- tion strongly increases primary production, which is mainly attributed to nitrogen fixation (panels MPR and DPR in Fig. 4). Phosphorus regeneration is enhanced under O2- deficit conditions, and the enhanced phosphate release stimu-