A reevaluation of the magnitude and impacts of anthropogenic atmospheric nitrogen
inputs on the ocean
T. D. Jickells1 , E. Buitenhuis1, K. Altieri2, A. R. Baker1 , D. Capone3, R. A. Duce4, F. Dentener5, K. Fennel6 , M. Kanakidou7, J. LaRoche8, K. Lee9 , P. Liss1, J. J. Middelburg10 , J. K. Moore11, G. Okin12 , A. Oschlies13 , M. Sarin14, S. Seitzinger15, J. Sharples16, A. Singh14 ,
P. Suntharalingam1, M. Uematsu17 , and L. M. Zamora18,19
1School of Environmental Science, University of East Anglia, Norwich, UK,2Energy Research Centre, University of Cape Town, Cape Town, South Africa,3Department of Biological Sciences, University of Southern California, Los Angeles, California, USA,4Departments of Oceanography and Atmospheric Sciences, Texas A&M University, College Station, Texas, USA,5DG Joint Research Centre, European Commission, Ispra, Italy,6Department of Oceanography, Dalhousie University, Halifax, Nova Scotia, Canada,7Department of Chemistry, University of Crete, Heraklion, Greece,8Department of Biology, Dalhousie University, Halifax, Nova Scotia, Canada,9School of Environmental Science and Engineering, Pohang University of Science and Technology, Pohang, South Korea,10Faculty of Geosciences, University of Utrecht, Utrecht, Netherlands,
11Department of Earth System Science, University of California, Irvine, California, USA,12Department of Geography, University of California, Los Angeles, California, USA,13GEOMAR, Kiel, Germany,14Geosciences Division, Physical Research Laboratory, Ahmedabad, India,15Department of Environmental Studies, University of Victoria, Victoria, British Columbia, Canada,16School of Environmental Sciences, University of Liverpool, Liverpool, UK,17Center for International Collaboration, Atmosphere and Ocean Research Institute, University of Tokyo, Tokyo, Japan,18NASA Goddard Space Flight Centre, Greenbelt, Maryland, USA,19Universities Space Research Association, Greenbelt, Maryland, USA
Abstract
We report a new synthesis of best estimates of the inputs offixed nitrogen to the world ocean via atmospheric deposition and compare this tofluvial inputs and dinitrogenfixation. We evaluate the scale of human perturbation of thesefluxes. Fluvial inputs dominate inputs to the continental shelf, and we estimate that about 75% of thisfluvial nitrogen escapes from the shelf to the open ocean. Biological dinitrogenfixation is the main external source of nitrogen to the open ocean, i.e., beyond the continental shelf. Atmospheric deposition is the primary mechanism by which land-based nitrogen inputs, and hence human perturbations of the nitrogen cycle, reach the open ocean. We estimate that anthropogenic inputs are currently leading to an increase in overall ocean carbon sequestration of ~0.4% (equivalent to an uptake of 0.15 Pg C yr 1and less than the Duce et al. (2008) estimate). The resulting reduction in climate change forcing from this ocean CO2uptake is offset to a small extent by an increase in ocean N2O emissions. We identify four important feedbacks in the ocean atmosphere nitrogen system that need to be better quantified to improve our understanding of the perturbation of ocean biogeochemistry by atmospheric nitrogen inputs. These feedbacks are recycling of (1) ammonia and (2) organic nitrogen from the ocean to the atmosphere and back, (3) the suppression of nitrogenfixation by increased nitrogen concentrations in surface waters from atmospheric deposition, and (4) increased loss of nitrogen from the ocean by denitrification due to increased productivity stimulated by atmospheric inputs.1. Introduction
Oceanic biogeochemical cycles play many important roles in the Earth system, including sustaining marine productivity by the cycling of carbon and the key nutrients N, P, Si, and Fe [Falkowski et al., 1998, 2000].
Marine productivity in turn affects air-sea gas exchange of greenhouse gases and thereby planetary radia- tive balance and climate. The oceans represent a very large planetary reservoir offixed or reactive nitrogen, i.e., nitrogen that is in forms other than the unreactive gaseous N2. Henceforth,fixed nitrogen will be sim- plified to“nitrogen,”and when we specifically include dinitrogen gas, N2, this will be stated. The internal cycling of this nitrogen within the oceans, predominantly as nitrate in deep water, supports much of the primary production in the surface ocean on annual to decadal time scales. External inputs of nitrogen to the oceans from rivers, groundwater and direct waste discharges, atmospheric deposition, and oceanic dinitrogen (N2) fixation (henceforth nitrogen fixation) may further augment ocean productivity. These
Global Biogeochemical Cycles
RESEARCH ARTICLE
10.1002/2016GB005586
Key Points:
•A new estimate of total atmospheric fixed nitrogen inputs to the ocean (39 Tg N yr 1) and its spatial distribution is presented
•The effects of atmospheric deposition on the oceans are estimated as an increase of productivity equivalent to 0.15 Pg C yr 1
•Four key uncertainties in these estimates are identified
Correspondence to:
T. D. Jickells, T.Jickells@uea.ac.uk
Citation:
Jickells, T. D., et al. (2017), A reevaluation of the magnitude and impacts of anthropogenic atmospheric nitrogen inputs on the ocean,Global Biogeochem.
Cycles,31, 289–305, doi:10.1002/
2016GB005586.
Received 18 NOV 2016 Accepted 17 JAN 2017
Accepted article online 21 JAN 2017 Published online 8 FEB 2017
©2017. American Geophysical Union.
All Rights Reserved.
inputs, together with those of other key potentially limiting nutrients such as P and Fe [Krishnamurthy et al., 2010;Moore et al., 2013;Okin et al., 2011], regulate the long- term biological productivity of the ocean and hence ocean carbon storage.
Prior to human intervention, we assume a steady state for the ocean nitrogen budget in which external inputs should balance losses. These losses occur primarily by denitrification and anaerobic ammonia oxida- tion or anammox (subsequently simplified to denitrification in the text). The nitrate ocean residence time is<3000 years [Voss et al., 2013;Bianchi et al., 2012;Gruber and Galloway, 2008;Landolfiet al., 2015]
The global nitrogen cycle is now being massively perturbed by human activity, particularly on land, and this affects the coastal oceans [Fowler et al., 2013;Gruber and Galloway, 2008;Rockstrom et al., 2009]. Although exact budgets are uncertain, estimated anthropogenic release of nitrogen into the global environment (160 Tg N yr 1, Tg = 1012g) is now of similar magnitude to all natural nitrogenfixation (250 Tg N yr 1) and may increase in the future with a growing global population, depending on societal progress in limiting nitro- genfluxes [Gruber and Galloway, 2008]. The increasing inputs of nitrogen from human activity, predomi- nantly from land-based activities, have the potential to modify oceanic, and even global, biogeochemical systems. However, our understanding of the scale and impact of such perturbations on the oceans is even less complete than on land [Fowler et al., 2013;Gruber and Galloway, 2008].
Duce et al. [2008],Suntharalingam et al. [2012],Yang and Gruber[2016], andKrishnamurthy et al. [2007] have recently provided estimates of atmospheric inputs offixed nitrogen to the world oceans and the impact of this deposition on ocean biogeochemistry.Duce et al. [2008] also argued that atmospheric deposition is the dominant mechanism by which anthropogenic perturbations of the nitrogen cycle affect the open ocean, because of effective removal offluvial nitrogen inputs on shelves by denitrification. Recognizing that there has been considerable new information on atmospheric emissions and their deposition to the oceans, as well as improved modeling capability of their impacts since the publication ofDuce et al. [2008], many of the authors of that paper have come together to reevaluate their earlier conclusions. In this contribution we therefore update theDuce et al. [2008] study, reporting improved estimates of the preindustrial and modern atmospheric nitrogen inputs to the ocean. We also report improved models to describe the distribution and impact of these inputs on the oceans and their impacts on the exchange of some important greenhouse gases. We also consider possible future changes in the nitrogenfluxes. In addition, we reconsider the assump- tion in the Duce et al. paper thatfluvial nitrogen is completely removed by denitrification on shelves and hence does not affect the nitrogen budget of the open oceans.
We begin by considering the three main external nitrogen sources to the oceans,fluvial, atmospheric, and biological nitrogenfixation, before moving on to consider the impacts of changing atmospheric nitrogen inputs on ocean biogeochemistry. As shown in earlier work [Duce et al., 2008] nitrogenfixation by lightning is quantitatively a very small component of the global nitrogen cycle compared to other inputs: ~5 Tg N yr 1 [Fowler et al., 2013]. It is included in the models here and is assumed to be unaffected by human activity and hence not explicitly discussed further.
2. Fluvial Inputs to the Oceans
Freshwater nitrogen inputs to the world oceans include riverine and submarine groundwater inputs plus some direct discharges. River inputs dominate and hence are our focus here [Jickells and Weston, 2011]. Riverine nitro- genfluxes at the freshwater/saltwater boundary have now been modeled and validated against available data, with associated uncertainty, [Seitzinger et al., 2005, 2010]. These authors report a global flux estimate of 23 Tg N yr 1 for dissolved inorganic nitrogen (DIN) and 11 Tg N yr 1 for dissolved organic nitrogen (DON).
The total river input of nitrogen to the coastal seas has approximately doubled over the last few hundred years [Beusen et al., 2016;Moore et al., 2013;Seitzinger et al., 2010]. This input is also now dominated by nitrate, although in preindustrial times organic N may have made a much higher relative contribution [Jickells and Weston, 2011;Seitzinger et al., 2005]. The general agreement between independent estimates [Beusen et al., 2016;Seitzinger et al., 2010] provides confidence in the estimatedfluvial Nfluxes. The validation, calibration, and bias evaluations of the models’estimates are discussed in the individual papers.
Models andfield data have suggested that much of the riverine nitrogen input is consumed on continental shelves, primarily by sediment denitrification fueled by organic carbon derived from shelf sea primary
production [Duce et al., 2008;Fennel et al., 2006;Seitzinger et al., 2006]. This leads to the suggestion that shelf seas are a global ocean nitrogen sink rather than a source to the open ocean. The significance of this shelf sea fluvial nitrogen sink is, however, uncertain and depends, at least in part, on the water residence time on the shelf and how and where the open ocean/shelf sea boundaries are placed. We next consider how much of the nitrogen delivered by rivers reaches the open ocean and how much is utilized and denitrified on the shelf based onSharples et al. [2016].
Fluvial particulate organic nitrogen (along with otherfluvial particulate matter) is effectively trapped in estu- aries at low salinity by particleflocculation [e.g.,Slattery and Phillips, 2011] or on the shelf [Muller-Karger et al., 2005]. However, it may be subsequently degraded to dissolved forms of nitrogen and thereby escape this particulate matter trap.
The main mechanism for long-term trapping offluvial dissolved inorganic nitrogen on the shelf is the micro- bial consumption of nitrate by denitrification in shelf sediments [Voss et al., 2013]. The effectiveness of shelf seafluvial nitrate retention is then a function of both the rates of shelf sedimentary denitrification and the residence time of water on the shelf [Seitzinger et al., 2006]. The residence time offluvial water on the shelf is not well known but can be anticipated to be very variable, being influenced by the width of the shelf,flow rates within the coastal buoyant plumes, and the net rates of water exchange across the shelf break. At a glo- bal scale, a key influence on circulation is the Coriolis force which acts to turn freshwater plumes to the right in the Northern Hemisphere and to the left in the Southern Hemisphere, as the buoyant water exits the estu- ary. This tends to retain the estuary discharge within the shelf sea, inhibiting the freshwater and associated nitrogen from directly crossing the shelf. This increases the water residence time on the shelf. The Coriolis force is highly dependent on latitude, and the analysis ofSharples et al. [2016] suggests that only near the equator (within about 20° latitude) is the Coriolis force weak enough to allow direct across-shelf movement of river plumes. Elsewhere, the Coriolis force moves freshwaterflows along shelf. This creates freshwater resi- dence times on the shelf that are sufficiently long (months to years) to allow effective removal of most river- ine nitrogen, although slowly degrading riverine DON will be exported [Fennel et al., 2006;Letscher et al., 2013;
Sharples et al., 2016].
The limited influence of the Coriolis force near the equator means that the residence time of the freshwater on the shelf there may be sufficiently short (days to weeks) that freshwater inputs will rapidly cross the shelf to reach the open ocean, and hence, there may not be time forfluvial dissolved nitrogen inputs to be deni- trified. By contrast, at higher latitudes the residence times of river water on shelf are increased by the Coriolis force to the point (many months or longer) where sediment denitrification can utilize effectively all of the riv- erine nitrogen input [Sharples et al., 2016].
The rivers discharging in tropical equatorial region include many with highflows per unit catchment area, due to high rainfall [Syvitski et al., 2005], and many with globally important total waterflows such as the Amazon, Zaire, and Fly. These rivers may also have relatively low inorganic nitrogen concentrations, because of both less intensive catchment agriculture and dilution of nitrogen inputs by the high riverflow. However, these rivers still deliver important total nitrogen loads due to the high waterflows [Seitzinger et al., 2005, 2010]. Dissolved organic nitrogen (DON) is often a significant component of the total dissolved nitrogenflux in these tropical river systems [Jickells and Weston, 2011;Seitzinger et al., 2005]. This material contains a com- plex mixture of compounds and the rate of degradation of these DON components is very poorly known [Hansell, 2013]. Assuming that the relatively biogeochemically labile DON is degraded on a time scale of about 50 days [Lønborg and Álvarez-Salgado, 2012], then such biologically labile DON may escape across the shelf to the open ocean from low latitude equatorial rivers due again to the shorter shelf residence times of freshwater in these systems. At high latitudes the labile DON may be degraded on the shelf and will then be retained along with nitrate on the shelf. More slowly degraded DON may be transported to the open ocean [Letscher et al., 2013, 2015].
Sharples et al. [2016] estimate that net globalfluvial dissolved inorganic nitrogen (DIN) inputs across the shelf break to the open ocean are about 17 ± 4 Tg N yr 1.This implies that globally about 75% offluvial DIN is trans- ported across the shelf to the oceans with the main inputs occurring near the equator (Figure 1). This DINflux will be augmented by a riverine DONflux (11 Tg N yr 1), although the uncertainties in our understanding of the composition and reactivity of this material mean that we cannot estimate the shelf-wide retention of this flux with any confidence. Thesefluxes contrast to theDuce et al. [2008] assumption of complete nitrogen
retention on the shelf. TheSharples et al. [2016]flux estimation excludes estuarine nitrogen retention and thus is an upper limit on nitrogen inputs to the open ocean.
As noted earlier globalfluvial nitrogenfluxes to the oceans have probably doubled since 1860 [Beusen et al., 2016;
Moore et al., 2013].Seitzinger et al. [2010] suggest that riverinefluxes of nitrogen may increase by 3 to +10% by 2030, depending on the assumed development scenario. Hence, the overall eutrophication pressures on coastal systems from nitrogen loading are likely to continue. An important control on shelf nutrient retention is associated with physical oceanographic factors particularly the Coriolis force, and we suggest that the spatial distribution of fluvial inputs, and hence the physical controls on the effectiveness of shelf retention of these inputs, is likely to remain similar between 2005 and 2030. Thus, the overall changes in thefluvial nitrogenfluxes to the open ocean are likely to be small, although locally large changes in Arctic regions may follow from global warming.
3. Biological Nitrogen Fixation
Biological nitrogen (N2)fixation offers the marine phytoplankton community a mechanism to relieve nitro- gen limitation. However, biochemical mechanisms for nitrogenfixation require considerable energy expen- diture. Biological nitrogenfixation also requires relatively large amounts of iron [Grosskopf and LaRoche, 2012;
Kustka et al., 2003]. Nitrogenfixation is restricted to a small group of prokaryotic planktonic organisms, although evidence from genetic studies suggests that the range of organisms able tofix nitrogen may be greater than previously thought [Bombar et al., 2016]. Estimates of global nitrogenfixation rates and controls are very uncertain [Landolfiet al., 2015;Mahaffey et al., 2005;Somes and Oschlies, 2015;Somes et al., 2013]. At regional and basin scales nitrogenfixation rates can be estimated using direct measurements, abundance estimates of nitrogenfixers, and from estimates of nitrogen abundance relative to phosphorus, N* [e.g., Singh et al., 2013]. However, at a global scale, estimates of nitrogenfixation rates have been derived from three different approaches: (1) plankton biogeochemical models constrained by marine chemistry data [e.g.,Benavides et al., 2013;Mills and Arrigo, 2010], (2) self-assembling ecosystem models, which do not pre- scribe biological rates directly but derive them to achieve the bestfit to geochemical data [Dutkiewicz et al., 2012], and (3) extrapolations of direct measurements of biological nitrogenfixation [e.g.,Grosskopf et al., 2012]. Some recent studies have reported methodological issues that may cause earlier direct measure- ments of nitrogenfixation rates to be inaccurate [Dabundo et al., 2014;Grosskopf et al., 2012].
The most recent direct measurement based estimates of global ocean nitrogen fixations rate is about 177 Tg N yr 1[Grosskopf et al., 2012]. The self-assembly ecosystem models estimate nitrogenfixation rates Figure 1.N supply across shelf and to the open ocean in 5° × 5° boxes based on NEWS (global nitrogen export from watersheds) river inputs [S.P.Seitzinger et al., 2010] and shelf retention estimates [Sharples et al., 2016] illustrating the dominance of tropical rivers as nitrogen sources capable of transporting nitrogen across the shelf to the open ocean [Sharples et al., 2016].
to be 85 Tg N yr 1(range 66–135) [Dutkiewicz et al., 2012], while other recent model estimates range from 91 to 137 Tg N yr 1 [Bianchi et al., 2012;Landolfiet al., 2015]. The PlankTOM model used here to assess the impacts of atmospheric deposition on the oceans [Buitenhuis et al., 2013;Le Quere et al., 2005] estimates global ocean nitrogen fixation rates of 164 Tg N yr 1 (Figure 2), broadly consistent with these other estimates and somewhat higher than, but within the uncertainties of, the estimate of 100 (60–200) Tg N yr 1used inDuce et al. [2008]. Nitrogenfixation rates are high in warm tropical oligotrophic waters and where there is sufficient availability of water column P and Fe [Luo et al., 2012; Somes and Oschlies, 2015]. The model results (Figure 2) also predict high nitrogenfixation in some coastal areas in SE Asia, which probably reflects stimulation by riverine phosphorus inputs. The global models are rarely able to fully capture the complex and episodic nature of nitrogenfixation blooms, and we note, for example, that high rates of nitrogenfixation have been observed in the Arabian Sea [Gandhi et al., 2011].
Based on current estimates [Bianchi et al., 2012] of nitrogen loss from the ocean by burial and denitrification (260 Tg N yr 1), only at the high end of this range of estimated nitrogenfixation rates is the ocean nitrogen cycle balanced. This has led to a discussion of whether the preindustrial ocean nitrogen system is in steady state or not after recovery from glaciation and the restoration of the current continental shelves [Bianchi et al., 2012;Codispoti, 2007;Grosskopf et al., 2012;Somes et al., 2013]. The usual biogeochemical assumption of ocean steady state may be inappropriate if the oceanic nitrogen system is still responding to postglacial maximum sea level rise when there was little or no continental shelf, and hence, the ocean nitrogen cycle may have been very different. The nitrogen isotopic composition record of organic matter preserved in for- aminifera within ocean sediments does suggest a major reorganization of the oceanic nitrogen cycle between glacial and interglacial conditions [Straub et al., 2013]. In regions like the Arabian Sea oxygen depleted zones, denitrification has been shown tofluctuate on even shorter (century) time scales [Altabet et al., 2002;Suthhof et al., 2001], due to regional changes in environmental conditions. However, with nitro- genfixation and other input and removal rates of the order proposed above, and assuming steady state, the Figure 2.Nitrogenfixation rate estimates from PlankTOM model (see text) as mol N m 2yr 1, averaged over the period 1990–1999.
ocean residence time of nitrogen becomes short enough (of the order of 3000 years) that postglacial maxi- mum reequilibration should have been achieved [Somes et al., 2013]. Hence, a pre-Anthropocene steady state should apply. The oceanic residence times of N and phosphorus (P) are therefore quite distinctly different, despite their close ocean scale coupling as is evident from the Redfield ratio. This coupling is due to large- scale thermohaline water mixing that smooths out the effects of the different internal ocean biogeochemical N and P cycling [Martiny et al., 2013;Singh et al., 2015;Weber and Deutsch, 2010]
Nitrogenfixation in the oceans is controlled in part by the availability of P and Fe [Ito et al., 2016;Moore et al., 2009;Somes and Oschlies, 2015;Srinivas and Sarin, 2013]. Hence, it is coupled to the larger ocean biogeo- chemical cycle, particularly N loss processes [Landolfiet al., 2015;Mahaffey et al., 2005;Meyer et al., 2016;
Moore and Doney, 2007;Moore et al., 2006;Somes et al., 2013]. Nitrogenfixation is also known to be sup- pressed by the presence of dissolved nitrogen species in the water column. This physiological suppression effect is species dependent, but the available evidence [Grosskopf and LaRoche, 2012;Krupke et al., 2015;
Meyer et al., 2016;Sohm et al., 2011] suggests that this only occurs at relatively high dissolved N concentra- tions (several micromolar). This threshold is much higher than the likely increase in surface water nitrogen concentrations from individual atmospheric N deposition events over the open ocean [Duce et al., 2008;
Grosskopf and LaRoche, 2012;Michaels et al., 1993;Somes et al., 2016], which are likely to be in the range of nanomolar rather than micromolar [Michaels et al., 1993]. This argument suggests that suppression of nitro- genfixation by atmospheric deposition events is unlikely. However, this assertion merits further study infield populations, mesocosms, and laboratory cultures, although this is challenging because only a few nitrogen- fixing marine microbes are currently in culture. In our modeling of the N cycle here we evaluate the impacts of atmospheric deposition on the oceans with and without this potential inhibition of nitrogenfixation (see later).
We suggest that nitrogenfixation rates are unlikely to change in the near future as a result of anthropogenic N inputs to the ocean. However, changes in dust input might change the iron supply and hence change the rates [Ito et al., 2016;Jickells et al., 2005;Moore et al., 2006] as may ocean acidification [Hutchins et al., 2015].
4. Atmospheric Deposition
The third important external source offixed nitrogen to the oceans is from the atmosphere. As a result of anthropogenic nitrogen emissions, the total atmospheric nitrogen input to the ocean is now comparable in magnitude to the other external nitrogen sources, although the balance between them will vary regionally.
The atmospheric input is made up of inorganic oxidized (nitrate and nitric acid) and reduced (ammonia and ammonium) nitrogen and organic nitrogen. In this context, organic nitrogen is defined as nitrogen available to inorganic nitrogen analysis after oxidation [Cape et al., 2011]. On a global basis these three forms contri- bute in approximately equal amounts to the total nitrogen deposition [Duce et al., 2008;Kanakidou et al., 2012], although there are substantial temporal and regional variations influxes and composition as discussed later. Atmospheric nitrogenfluxes are now greatly enhanced (approximately tenfold) by human activity.
Combustion is the main source of oxidized nitrogen, emitted as NOxand converted on time scales of a day or so to nitric acid and nitrate. Agricultural emissions are the main source of ammonia [Duce et al., 2008]. Most emissions originate on land, although shipping emissions are becoming increasingly important [Eyring et al., 2005] (Table 1). Rapid and efficient atmospheric transport allows these emissions to reach the open oceans within days, hence much faster and more effectively thanfluvial inputs [Fowler et al., 2013].
The magnitude of nitrogen emissions and their deposition to the oceans are uncertain and generally poorly constrained by both data and models. However, a recent detailed comparison of models and data for the Atlantic Ocean suggested reasonable agreement between model estimates and observations, providing increased confidence in the estimates presented here [Baker et al., 2010, 2017].
The estimates of atmospheric deposition here are based on the TM4-ECPL model [Daskalakis et al., 2015;
Tsigaridis et al., 2014] which includes for thefirst time an explicit scheme for estimating atmospheric dis- solved organic nitrogen deposition [Kanakidou et al., 2012]. In contrast,Duce et al. [2008] ran their present- day simulation of atmospheric nitrogen deposition for the year 2000 based on a synthesis of global models [Dentener et al., 2006]. The simulation reported here is for 2005, although the impacts of this change in year are trivial, when considering the large spatial scales here. The estimates from the TM4-ECPL model agree well with other model outputs and with data [Kanakidou et al., 2016]. The spatial distribution derived from the
TM4-ECPL model of nitrogen deposition (Figure 3) and present-day global nitrogen emission estimates (Table 1, 125 Tg N yr 1) are very similar to those in Duce et al. [2008], 116 (uncertainty range 68–164) Tg N yr 1. However, the net nitrogen deposition estimates to the oceans (Table 2) are rather different as discussed below, with a net deposition here of 39 Tg N yr 1 compared to 67 (uncertainty range 38–96) Tg N yr 1inDuce et al. [2008].
The difference reflects a slightly lower (18 versus 23 Tg N yr 1) oxidized nitrogen deposition to the ocean. This arises in part because some of the oxidized nitrogen emission is assumed to react to form atmospheric organic nitrogen (about 10 Tg N yr 1produced mainly over land), of which 2 Tg N yr 1is deposited to the ocean [Kanakidou et al., 2012]. Other formation pathways for inorganic nitrogen involving ammonia have been suggested [Altieri et al., 2012]. The major differences between the budget here and that ofDuce et al.
[2008] reflects changes in the model estimates ofnet organic nitrogen and reduced inorganic nitrogen (NH4+/NH3) deposition. This highlights the potential importance of the role of recycled marine emissions in thesefluxes in particular, since redeposition of marine emissions will not create a net increase in marine pro- ductivity. The specific major changes to theseflux estimates compared toDuce et al. [2008] are detailed below:
1. The TM4-ECPL explicit modeling of organic nitrogen yields a total depositionflux of dissolved organic nitrogen to the ocean of 15 Tg N yr 1, somewhat lower than theflux of 20 (uncertainty range 10–30) Tg N yr 1estimated byDuce et al. [2008] who used a simple assumption (based on literature estimates) that DON represents 30% of total N deposition. The deposited DON has uncertain, complex, and poorly quantified sources that may include some marine emissions that are redeposited [Jickells et al., 2013].
TM4 model estimates about 6 Tg N yr 1of this DON to be of marine origin and redeposited to the ocean, resulting in a netflux of 9 Tg N yr 1. This estimation of an important recycled marine component of DON is consistent with estimates from observational studies on Bermuda [Altieri et al., 2016], although at other locations anthropogenic terrestrial sources have been argued to dominate the DON [Jickells et al., 2013]. The DON model results reported here estimate gross DON deposition at 15–20% of total N deposi- tion (Figure 3) which is broadly in line with recent measurements of the proportion of DON in aerosols and rainwater over the Atlantic, 7–10% [Zamora et al., 2011], ~24% [Lesworth et al., 2010], and 19% [Altieri et al., 2016], and Pacific, 16% [Martino et al., 2014]. However, the proportion varies greatly regionally from 4 to 62% [Zamora et al., 2011]. Thus, the major change in theflux estimate here compared to that ofDuce et al.
[2008] is the suggestion that the gross DON deposition may include an important marine recycled com- ponent, leading to a reduction in the net DON deposition. The sources of organic nitrogen in marine Table 1. TM4-ECPL Model Estimated Global Atmospheric N Emissions by Source for 1850, 2005, and 2050, the Latter Based on the RCP6.0 Scenario
Emissions (Tg N yr 1)
Source 1850 2005 2050
NOx
Terrestrial anthropogenic NOx 0.6 27 20.2
Shipping NOx 5.3 3.1
Aircraft NOx 0 0
Biomass burning NOx 0.5 5.5 5.7
Natural NOxsoils + lightening 11.8 11.6 11.6
NHx
Terrestrial anthropogenic NHx 5.4 32.9 43.7
Biomass burning NHx 0.9 9.2 9.4
Natural NHxsoils 2.4 2.4 2.4
Natural NHxocean emissions 8.2 8.2 8.2
Total inorganic N 29.8 102.1 104.3
Organic N (ON)
Anthropogenic and biomass burning 1.3 7.0 6.8
Natural biogenic particles and soil dust 9.3 9.3 9.3
ON insoluble on marine aerosol 1.1 1.1 1.1
ON soluble on marine aerosol and marine amines 5.8 5.8 5.8
Total ON 17.5 23.2 23
Total N emissions 47.2 125.2 127.3
deposition are uncertain, and there is also evidence for an important terrestrial and anthropogenic component to the deposition [Cape et al., 2011]. Hence, further studies of atmospheric organic nitrogen are required.
2. In the case of reduced nitrogen (NHx= ammonia + ammonium), the new model estimate of ammonia/ammonium deposition to the oceans presented here (12 Tg N yr 1) is only half of that reported byDuce et al. [2008], 24 (uncertainty range 14–32) Tg N yr 1. This difference arises because in the new model estimate, while gross NHxdeposition is 20 Tg N yr 1 (broadly similar to the earlier estimate), 8 Tg N yr 1of this is estimated to be associated with redeposition of NHxemitted as ammonia from the oceans. This compares to an estimate of recycled ammonia of only 3 Tg N yr 1 inDuce et al. [2008].
Figure 3.Depositionfields to the oceans for (left column) 1850, (middle column) 2005, and (right column) 2050 for (top row) oxidized (NOy), (middle row) reduced (NHx), and (bottom row) organic N (in g N m 2yr 1); scale maximum has beenfixed to 0.20 for readability and easier comparison.
Table 2. Deposition to the Oceans (Tg N yr 1) All With 2005 Meteorology and Using the RCP 6.0 Scenario for 2050a
Flux 1850 2005 2050
Inorganic NOy 4 18 13
NHyfrom land 2 12 14
NHyfrom ocean (redeposited) 8 8 8
ON from land 4 9 9
ON from ocean (recycled) 6 6 6
Total N input 24 53 50
Net N input 10 39 36
aNote that total N includes insoluble organic nitrogen.
Thus, as with the dissolved organic nitrogen, the marine recyclingflux estimation results in an important change in the netflux estimates. There is relatively limited direct experimental evidence to substantiate the large-scale marine emission of ammonia suggested by these models [Johnson et al., 2008], but it is consistent with one recent detailed study on Bermuda in the tropical Atlantic [Altieri et al., 2014]. We suggest that the magnitude and direction of the air-sea ammoniaflux (and the organic nitrogenflux) deserves further investigation.
Despite the changes in the overallfluxes, the geographic patterns of atmospheric deposition to the oceans and their temporal evolution (Figure 3) remain similar to those ofDuce et al. [2008]. Highest inputs occur in the Northern Hemisphere downwind of large industrial and population centers in Europe, North America, and Asia. The model does not have sufficient resolution to separate deposition to coastal waters from that to the open ocean accurately, butVet et al. [2014] suggest that 24% of nitrogen deposition falls in the coastal region as they define it. BecauseVet et al. [2014] use a definition which includes some coastal land area, 24% probably represents an upper limit on the total of atmospheric nitrogen deposition that falls onto the coastal seas.
Atmospheric N inputs to the oceans are estimated to have increased sharply from 1860 to 2005 particularly in areas such as the North Atlantic and North Pacific downwind of industrialized regions. The increases in deposition to the South China Sea, for example, are already evident and now appear to be directly impacting local water column nitrate concentrations and primary production [I. N. Kim et al., 2014;T. W. Kim et al., 2014].
It has recently been argued that atmospheric deposition of nutrients (particularly iron, but also nitrogen) to the western Pacific can have impacts further afield in the eastern tropical Pacific, following transportation of atmospherically deposited nutrients by the ocean circulation [Ito et al., 2016].
Most emission scenarios to 2050 suggest that further atmospheric deposition increases will be seen predo- minantly downwind of southern and Southeast Asia, reflecting industrial development plus population and affluence increases. Current projections for 2030 and 2100 under different representational concentra- tion pathways (RCP) scenarios [Kanakidou et al., 2016] suggest total N deposition to the oceans will change little between now and 2100 ( 2 to + 7% change by 2030, 17 to +8% by 2100 which is somewhat smaller than the projection with a different scenario ofDuce et al. [2008]). However, the global distribution pattern will probably change (Figure 3) [Duce et al., 2008]. The balance of the relative importance of oxidized (derived from NOxemissions) and reduced nitrogen (derived from ammonia emissions) is also projected to change, with an increasing proportion of ammonium compared to nitrate, due to more efficient controls on terrestrial NOxemissions compared to ammonia [Lamarque et al., 2013]. These trends are already evident in deposition data with reduced nitrogen becoming relatively more important in North America in recent years [Vet et al., 2014]. The trend in Southeast Asia is the reverse [Liu et al., 2013] in each case reflecting regional emission changes. There are also currently large regional differences in the relative importance of oxidized and reduced nitrogen in atmospheric deposition, with the proportion of reduced to total nitrogen in deposition much higher in SE Asia than elsewhere [Vet et al., 2014]. The suggested trend to a greater relative proportion of reduced to oxidized nitrogen can potentially alter atmospheric aerosol pH and the acidity of atmospheric deposition [Lamarque et al., 2013]. However, this may not necessarily be the case, at least over land, where aerosol gas phase interactions maintain very acidic aerosol pH values until the ratio of acids to ammonia gas falls quite low [Weber et al., 2016].
5. Summary of Estimated Inputs
In Table 3 we present a summary of our best estimates of contemporary nitrogen inputs to the oceans, based on the earlier discussion in the text. We therefore suggest that at least 76% of the atmospheric input is depos- ited beyond the shelf break, and 75% of the river DIN input escapes beyond the shelf break. We assume that all of the nitrogenfixation takes place in the open ocean. Based on the scenarios discussed earlier, it seems likely that totalfluxes of nitrogen to the ocean are unlikely to change markedly over the next few decades, assuming the scenarios considered are realistic.
6. Impacts of Atmospheric Deposition on Water Column Productivity
The effects of atmospheric deposition have been evaluated previously using global ocean biogeochemical models [Krishnamurthy et al., 2007, 2010, 2009;Suntharalingam et al., 2012;Yang and Gruber, 2016] or based on various scal- ing procedures byDuce et al. [2008].Duce et al. [2008] andSuntharalingam et al. [2012] use the same atmospheric
depositionfield, whileKrishnamurthy et al. [2007] use a separately derivedfield with a somewhat smallerflux, due in part to not considering organic nitrogen and also using net rather than gross ammonia/ammonium inputs, i.e., correcting for the marine ammonia emissions. All three of these models estimate the impact of increased atmospheric N deposition on export production (that which sinks to depth and should relate to ocean biological CO2uptake) to be ~ 0.4 Pg C/yr, reflecting predominantly the similar atmospheric nitrogen inputs used in each of the different model simulation. Studies have also considered the impact of atmospheric deposition at regional scales [Ito et al., 2016; Sundarambal et al., 2010;Zamora et al., 2010], finding, for example, that atmospheric deposition can sustain 3% of new primary production in the northern Indian Ocean and on occasions an even higher percentage in the Atlantic [Singh et al., 2012;Spokes et al., 2000].
The response of the oceans to the atmospheric inputs of nitrogen has been modeled here using the PlankTOM10 model [Le Quere et al., 2005;Le Quere et al., 2016] to which we have added the N2O model ofSuntharalingam et al.
[2012]. This global biogeochemical model has a 2 by 1.1 degree resolution, 10 plankton functional types, and 44 state variables run within an ocean general circulation model. The model allows variable Fe:Chl:Si:C ratios in phy- toplankton and particulate organic matter [Buitenhuis et al., 2013] andfixed O2:C:N:P in all organic matter [Anderson and Sarmiento, 1994] and allows nitrogen-fixing organisms to preferentially utilize dissolved nitrogen in the water column when it is available. The atmospheric depositionfield is essentially the same as that described earlier from the TM4 model, although the totalflux used in the runs here was 35 rather than 39 Tg N yr 1with depositionfields as in Figure 3. The PlankTOM10 nitrogenfixationfield is shown in Figure 2 and discussed earlier. The PlankTOM10 model does not fully resolve the shelf sea because of the grid square reso- lution, so we have used a value of riverine N input to the ocean of 16.3 Tg N/yr, similar to the estimated total DIN net river input to the open ocean.da Cunha et al. [2007] have previously shown, using an earlier version of this model, that the ocean productivity is relatively insensitive (on decadal time scales) to changes in the river input;
for example, primary and export productivity only decrease by 7% and 3%, respectively, for a complete cessation of river inputs in the model runs, while only a 5% increase in primary productivity results from a 50% increase in riverine N inputs. However, the percentage impact on the coastal ocean productivity in each case is greater.
In the standard PlankTOM10 configuration, nitrogenfixation suppression increases with increasing surface water nitrogen concentrations and is suppressed by 50% at 1.7μM NH4or 7.3μM NO3. This is based on the assumption that nitrogen-fixing organisms would preferentially utilize availablefixed nitrogen in the water column. This cre- ates a potential negative feedback on ocean nitrogen cycle from atmospheric deposition as less nitrogen isfixed if there is an increase in nitrogen deposition. As noted above, some of the available evidence suggests that such suppression only occurs at high surface waterfixed N concentrations and that therefore individual atmospheric deposition events are unlikely to lead to such large increases in ambient surface water nitrogen concentrations.
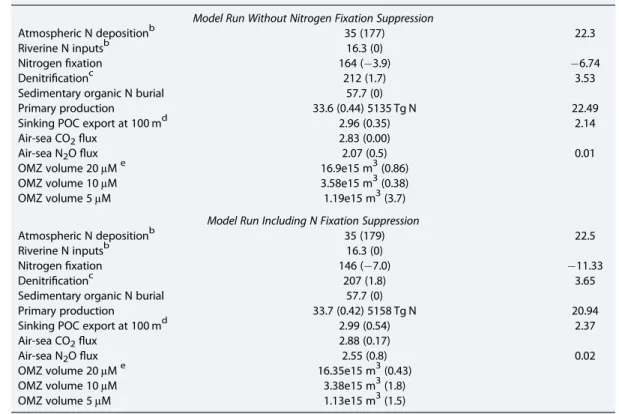
We have performed two model simulations, one assuming no suppression of nitrogenfixation byfixed nitrogen (Table 4, model run without Nfixation suppression), and the other retaining the standard PlankTOM10 suppres- sion (Table 4, model run including Nfixation suppression). The model runs covered just over 400 years. Overall, ocean nitrogenfixation without the suppression is increased by 18 (from 146 to 164) Tg N yr 1(12% increase) over the standard run with suppression, emphasizing the potential sensitivity of the ocean biogeochemical sys- tem to such suppression as a negative feedback. Note also that nitrogenfixation is still reduced by about 4% in the model runs without suppression compared to the preindustrial run. This may reflect non-nitrogen-fixing phy- toplankton outcompeting nitrogenfixers for other key nutrients (Fe and P), and thereby suppressing the growth of nitrogenfixers. Others have reported similar reductions in nitrogenfixation due to atmospheric nitrogen deposition in their model runs [Krishnamurthy et al., 2007, 2010, 2009;Okin et al., 2011;Somes et al., 2016].
Somes et al. [2016] have recently reported a related study of the impacts of atmospheric deposition on ocean productivity using the UVic Earth System Climate Model. This model has more complex feedbacks than the Table 3. Nitrogen Inputs to the Total Oceans Including the Continental Shelf and to the Open Ocean Beyond the Shelf Breaka
Source Total Ocean Flux (Tg N yr 1) Flux to the Open Ocean (Tg N yr 1)
Atmospheric 39 >30
Fluvial DIN 23, DON 11 DIN 17, Don>0 to<11
Nfixation 164 164
aSee text for derivation of numbers.
PlankTOM10 model, particularly in terms of benthic and pelagic denitrification. However, this model does not resolve shelf systems well and so underestimates benthic denitrification and thereby also nitrogenfixation, which is set in the model to balance the overall denitrification losses. TheSomes et al. [2016] simulations estimated the impact of atmospheric nitrogen inputs to the ocean at the upper end of theflux ranges considered byDuce et al. [2008]. The UVic model is parameterized such that at 5μM nitrate, nitrogenfixation is fully suppressed. The UVic model, like the PlankTOM10 model, therefore also produces quite a strong negative feedback from the suppression of nitrogenfixation by atmospheric nitrogen deposition. This model also highlights another potentially important feedback [Landolfiet al., 2013]. Denitrification consumes more nitrogen than is liberated from its decomposition of organic matter. Hence, it has been demonstrated in the UVic model that increased atmospheric nitrogen deposition can lead to a negative feedback, in which increased production leads to expansion of low oxygen zones, then to net nitrogen consumption by denitrification, and hence to lower overall ocean productivity. This feedback occurs on time scales of hundreds of years reflecting the ocean circulation time scales for passing water through denitrification zones [Somes et al., 2016]. Yang and Gruber [2016] reached a very similar conclusion using a different ocean biogeochemical model.
The model estimates here consider mainly the effects of nitrogen deposition on nitrogenfixation. However, there is increasing evidence that atmospheric iron deposition also plays a key role in nitrogenfixation because of the high iron requirements of nitrogen-fixing enzymes [Ito et al., 2016; Martino et al., 2014;
Moore et al., 2009;Ward et al., 2013]. The dominance of nitrogenfixation we identify here, and the uncertainty in its sensitivity to atmospheric nitrogen and iron inputs and water column phosphorus cycling [Landolfiet al., 2015], suggests that the magnitudes and controls on nitrogenfixation merit further research.
Table 4. Mean Global-Scale Fluxes Averaged Over the 1990s Are Given for PlankTOM10 (2*1.1 Degree Resolution)a
PlankTOM10 ΔTg N/yr
Model Run Without Nitrogen Fixation Suppression
Atmospheric N depositionb 35 (177) 22.3
Riverine N inputsb 16.3 (0)
Nitrogenfixation 164 ( 3.9) 6.74
Denitrificationc 212 (1.7) 3.53
Sedimentary organic N burial 57.7 (0)
Primary production 33.6 (0.44) 5135 Tg N 22.49
Sinking POC export at 100 md 2.96 (0.35) 2.14
Air-sea CO2flux 2.83 (0.00)
Air-sea N2Oflux 2.07 (0.5) 0.01
OMZ volume 20μMe 16.9e15 m3(0.86)
OMZ volume 10μM 3.58e15 m3(0.38)
OMZ volume 5μM 1.19e15 m3(3.7)
Model Run Including N Fixation Suppression
Atmospheric N depositionb 35 (179) 22.5
Riverine N inputsb 16.3 (0)
Nitrogenfixation 146 ( 7.0) 11.33
Denitrificationc 207 (1.8) 3.65
Sedimentary organic N burial 57.7 (0)
Primary production 33.7 (0.42) 5158 Tg N 20.94
Sinking POC export at 100 md 2.99 (0.54) 2.37
Air-sea CO2flux 2.88 (0.17)
Air-sea N2Oflux 2.55 (0.8) 0.02
OMZ volume 20μMe 16.35e15 m3(0.43)
OMZ volume 10μM 3.38e15 m3(1.8)
OMZ volume 5μM 1.13e15 m3(1.5)
aBuitenhuis et al. [2013] andLe Quere et al. [2005]. Values in parentheses show the percent difference in eachflux when rising atmospheric N deposition is included. Nitrogenfluxes are given in units of Tg N/yr, and carbonfluxes are in units of Pg C/yr. Total changes (Δ) in the atmospheric nitrogen inputs and their impacts on nitrogenfixation, denitrification, pri- mary production, and N2O emissions are also listed.
bDissolved inorganic N + dissolved organic N.
cAll as water column denitrification in model.
dSinking particulate organic carbon at 100 m.
eVolume of oxygen minimum zone (OMZ) waters at specified cutoff value.
In the subsequent discussion to illustrate the maximum potential effects, we consider the model output run with- out the suppression of nitrogenfixation (Table 4, model run without rather than including Nfixation suppression).
We derive the changes in various ocean biogeochemical processes compared to a preindustrial atmospheric input estimate with the present-day riverine nutrient input. As noted earlier, reducing the riverine input to preindustrial levels would have little impact on the outcome in most open ocean regions [da Cunha et al., 2007].
Our estimates (Table 3) indicate that atmospheric inputs dominate the increased N inputs to the oceans since the preindustrial era. This is the case even allowing for the increased inputs from rivers to the open ocean estimated here, compared to the assumption by Duce et al. of complete shelf nitrogen retention (Table 3).
There are strong spatial gradients in the atmospheric N deposition as discussed by Duce et al. (see also Figure 3) with much larger inputs to the Northern Hemisphere ocean compared to the Southern Hemisphere. Within the Northern Hemisphere, deposition is particularly high in ocean regions downwind of large population centers, such as Asia (Figure 3).
The model results (Table 4) suggest that increased anthropogenic atmospheric N deposition from preindustrial to the present could have increased ocean productivity overall by about 0.4% equivalent to 0.15 Pg C/yr. This increase in overall primary production is about half of that suggested byDuce et al. [2008] whose estimates were based on scaling atmospheric deposition falling on nitrogen-limited ocean regions to primary production using the Redfield ratio. The difference between the estimates here (Table 4) and this earlier estimate is essentially consistent with the reduced net atmospheric nitrogen deposition estimated here compared to the earlier paper.
Export production is the proportion of the primary production sinking to the deep ocean and the key issue in terms of removal of CO2from the atmosphere [Giering et al., 2014;Laws et al., 2000]. Export production only increases by 0.01 Pg C/yr over the short term in the model runs (Table 4). The proportion of the primary production exported to depth estimated here is smaller than that estimated byDuce et al. [2008]. This low export percentage (fratio—new or export/total primary production) estimate of only 7% in PlankTOM10 compared to an assumed value of 22% in Duce et al. is consistent with some other lower published estimates [e.g.,Laws et al., 2000].
Krishnamurthy et al. [2007] have a similarly low sinking particulate organic carbon (POC)flux that is only 12% of productivity in their estimates of the impacts of atmospheric nitrogen deposition. Recently,Henson et al. [2011]
have also argued more generally for such a lower value for the f ratio, based on direct measurements, while also emphasizing that the f ratio varies systematically throughout the oceans. Regardless of the short-term (years to decades) recycling of the atmospherically deposited nitrogen within the upper ocean and low export production, on the longer time scale (centuries) the atmospheric nitrogen input will eventually be lost to the deep sea and with it the associated drawdown of 0.15 Pg C/yr; the model runs are simply not long enough to capture this effect.
N2O is a powerful greenhouse gas released by nitrification and denitrification processes.Duce et al. [2008]
noted that increases in ocean productivity can lead to expansion of low oxygen regions and an attendant increase in N2O emissions. The extent of such a feedback is sensitive to the export production and also to the area and extent of low oxygen [e.g.,Bianchi et al., 2012]. The impacts of atmospheric nitrogen deposition on N2O emissions by nitrification and denitrification have been modeled bySuntharalingam et al.[2012]. In our model runs (Table 4) we estimate the low oxygen region for N2O emissions, based on three different oxy- gen concentration thresholds of<20, 10, and 5μM oxygen concentration. In the model runs the areas of low oxygen, defined by all three thresholds increase as does the overall ocean N2Oflux, but the increases are gen- erally <1% (Table 4). This increase is smaller than the 3–4% change in N20 emissions estimated by Suntharalingam et al. [2012]. This reduction is consistent with the reduced magnitude of net atmospheric anthropogenic nitrogen inputs used here compared to those used bySuntharalingam et al. [2012]. N2O can also be produced by oxidation of ammonia and DON, and changes in the surface ocean cycling of these species as a result of atmospheric deposition could also change the ocean emissions of N2O [Loscher et al., 2012;Santoro et al., 2011]. Although there are substantial uncertainties associated with all aspects of the oceanic N2O cycle [Zamora and Oschlies, 2014], the small size of change in N2O emissions estimated here sug- gests that large changes in N2O because of atmospheric nitrogen deposition are unlikely.
7. Conclusions
The combination of lower atmospheric depositionfluxes estimated here compared to earlier studies, a rela- tively high estimated rate of nitrogenfixation, and ocean biogeochemical feedbacks leads to a prediction of a
smaller impact of increasing atmospheric nitrogen deposition on ocean biogeochemical cycles and carbon uptake than that ofDuce et al. [2008]. Our estimate of theflux offluvial nitrogen to the open ocean is larger.
The analysis and model calculations presented here highlight that this conclusion is very sensitive to four feedbacks which we identify—recycling of ammonia and organic nitrogen from seawater to the atmosphere, inhibition of nitrogenfixation by atmospheric nitrogen deposition, and the denitrification sink for nitrogen.
All these feedbacks undoubtedly occur, so the key, and very difficult, challenge is the quantification of the scale of these under realistic open ocean conditions.
The calculations here suggest that the impacts of atmospheric deposition on ocean biogeochemistry can result in a net increase in primary production and CO2uptake of 0.15 Pg C yr 1. However, the resulting reduc- tion in radiative forcing will be offset slightly by increases in N2O emissions from some regions of the oceans [Suntharalingam et al., 2012].
In some areas pulses of atmospheric nutrient deposition may be sufficiently large to have short-term (days) impacts on productivity [Guieu et al., 2014]. However, over most of the oceans the likely scale of short-term nitrogen inputs are relatively small compared to the existing background stock [Duce et al., 2008;Michaels et al., 1993]. This may not be the case for dust/iron deposition which can affect nitrogenfixation [Guieu et al., 2014;Moore et al., 2006].
The increases influvial nitrogen inputs to the ocean from human activity predominantly affect coastal systems leading to major environmental pressures [e.g.,Diaz and Rosenberg, 2008]. We suggest that a quar- ter offluvial inorganic nitrogen inputs are denitrified on the shelf, and the fate offluvial dissolved organic nitrogen is particularly uncertain. Our results suggest that the effects of shelf denitrification onfluvial dissolved inorganic nitrogenfluxes is strongly latitude dependent, and further increases in nitrogen use on land in equatorial regions may therefore have a disproportionately large impact on totalfluvial inputs to the open ocean. Where there are large losses offluvial inorganic nitrogen by denitrification on the shelf, this may result in excessfluvial P inputs to the open ocean (relative to N) which could then support nitrogenfixation.
In general, the impacts of atmospheric nitrogen deposition will be greatest where the ambient surface water column nitrogen concentrations are low and hence in the ocean gyres [Duce et al., 2008]. Atmospheric nitro- gen deposition has strong geographic gradients, and thus it is important to consider regions where the impacts of atmospheric deposition may be particularly strong or rather different from the general pattern.
We identify four such regions—the North Pacific, North Indian Ocean, Mediterranean, and tropical North Atlantic as explained below.
We predict (Figure 3) as previously [Duce et al., 2008] that the western North Pacific is likely to be a focus of increasing atmospheric deposition over coming decades, even if the total net nitrogen input to the oceans may not grow. Deposition in this region is already argued to be increasing ocean productivity regionally [I. N. Kim et al., 2014; T. W. Kim et al., 2014]. This regional impact may be extended beyond the regions of enhanced atmospheric deposition via ocean circulation transport of deposited nutrients, where this can occur relatively rapidly on time scales of decades or less [Ito et al., 2016].
In the northern Indian Ocean region, atmospheric deposition is already estimated to be contributing to new production [Singh et al., 2012] and is predicted to increase. This region also contains a major deep water oxygen minimum zone where denitrification and nitrification sustain very high N2Ofluxes. Here increasing nutrient inputs may lead to intensification of hypoxic conditions and increasedfluxes of the greenhouse gas N2O, making this area of particular interest [Naqvi et al., 2010;Suntharalingam et al., 2012]. The Bay of Bengal region has low subsurface oxygen concentrations but minimal water column denitrification and N2O production at present [Bristow et al., 2017]. Even modest increases in export production in the future could lead to substantial denitrification and N2O production.
The last areas we would highlight are the Mediterranean and North Atlantic subtropical gyre, which are both characterized by evidence of phosphorus limitation of primary production. This situation is enhanced by nitrogen deposition and may lead to accumulation of nitrogen in the water column and different biogeo- chemical impacts in such regions [Krom et al., 2010;Moore et al., 2009;Ward et al., 2013;Yang and Gruber, 2016;Zamora et al., 2010], compared to other ocean regions where nitrogen may be the proximate limiting nutrient [Moore et al., 2013].