Assessment of global phytoplankton growth inferred from satellite and physiological model-based analyses
Dissertation
in fulfillment of the requirements for the degree Dr.rer.nat.
of the Faculty of Mathematics and Natural Sciences at Christian-Albrechts-Universit¨at zu Kiel
submitted by
Lionel Alejandro Arteaga Quintero Kiel, 2015
First referee: Prof. Dr. Andreas Oschlies Second referee: Dr. Habil. Markus Pahlow Date of oral examination: 27.05.2015 Approved for publication: 27.05.2015 Signed: Prof. Dr. Wolfgang J. Duschl
Contents
Summary 7
Zusammenfassung 9
1 Introduction 11
1.1 The carbon cycle . . . 12
1.2 The biological carbon pump . . . 12
1.3 Modelling phytoplankton growth and marine primary production . . . 14
1.3.1 Satellite-based models . . . 14
1.3.2 Mechanistic models of phytoplankton growth . . . 18
1.3.3 Optimality-based models . . . 20
1.4 Thesis overview and author contributions . . . 23
References . . . 25
2 Thesis chapters 33 2.1 Chapter 1: Global patterns of phytoplankton nutrient and light colimitation inferred from an optimality-based model.. . . 33
2.2 Chapter 2: Global monthly sea surface nitrate fields estimated from remotely sensed sea surface temperature, chlorophyll, and modeled mixed layer depth. . . 49
2.3 Chapter 3: Contribution of phytoplankton to particulate organic carbon in the global ocean. . 61
2.4 Chapter 4: Nitrogen cycling driven by organic matter export in the South Pacific oxygen minimum zone. . . 85
3 Synthesis 93 3.1 Phytoplankton C:N:P: acclimation vs. adaptation . . . 93
3.2 Phytoplankton physiology and oceanic productivity . . . 95
3.3 Coupling an optimality-based phytoplankton formulation into an Earth system climate model 97 3.3.1 Model implementation . . . 97
3.3.2 Preliminary results . . . 100
3.4 Conclusions and future directions . . . 103
References . . . 106
Curriculum Vitae 111
Eidesstattliche Erkl¨arung 115
Summary
Prior to industrial times, the global carbon cycle is considered to have been roughly in a steady state, with no major net carbon fluxes between the different compartments of the Earth system. As a result of anthropogenic carbon emissions, fluxes as well as reservoirs have changed, and the ocean is now considered an important sink of carbon. Photosynthesis by phytoplankton constitutes the principal supply route of carbon into the marine ecosystem. Phytoplankton, hence, act as a major regulator of the carbon sink in the ocean. The main aim of this thesis is to evaluate the constraints of phytoplankton growth in the global ocean through a combination of satellite-based and novel physiological models. The broader goal of this work is to better describe and project biogeochemical cycles affected by the physiological regulation of phytoplankton elemental composition.
Chapter 1 of this thesis describes a global analysis of nutrient and light limitation of phytoplankton growth inferred from an optimality-based model. This analysis indicates strong nutrient limitation in the tropical and subtropical ocean, and light limitation in high latitudes, particularly in the Southern Ocean. Nutrient limitation is mainly due to nitrogen, while phosphorus acts as a secondary, co-limiting nutrient. Motivated by these results, a satellite- and model-based method to predict global surface nitrate variations was developed and is detailed in Chapter 2. This method is able to reproduce seasonal and interannual variations of in situ nitrate observations at four different stations: the Bermuda Atlantic Time Series, the Hawaii Ocean Time series, the California coast, and the southern New Zealand region. Chapter 3 combines the studies above to estimate global vertically integrated primary production rates and surface phytoplankton carbon concentration from an optimality-based model. Global patterns from this carbon-based model study show highest production rates in low latitudes, particularly in the Equatorial Pacific. Phytoplankton contribution to total particulate organic matter is also highest in tropical and subtropical regions (∼50 %), and decreases towards higher latitudes (∼ 15 %). Chapter 4 presents a study of nitrogen loss processes in the eastern tropical South Pacific oxygen minimun zone. The relevance of this work within the context of this thesis is the estimation of production and export rates combining bio-optical and satellite-based algorithms. The main conclusion from this work is that organic matter export regulates the lateral distribution and cycling of nitrogen in this oxygen minimun zone.
The results presented in this thesis show that optimality-based formulations can describe much of the vari- ability in phytoplankton stoichiometry. Moreover, formulations of phytoplankton physiological acclimation can produce distinct global marine primary production patterns according to different nutrient and light colimitation regimes. Ongoing work evaluates the effects of coupling an optimality-based formulation into
changes in phytoplankton elemental composition, and its consequences on marine primary production and carbon export.
Zusammenfassung
In vorindustrieller Zeit war der globale Kohlenstoffkreislauf ¨uberwiegend im Gleichgewicht, ohne dass es sig- nifikante netto Kohlenstofffl¨usse zwischen den verschiedenen Bereichen des Erdsystems gab. In heutiger Zeit haben sich die Kohlenstofffl¨usse und -reservoirs als Folge anthropogener Kohlenstoffemissionen ver¨andert;
der Ozean wird nunmehr als wichtige Senke f¨ur Kohlenstoff angesehen. Kohlenstoff wird gr¨otenteils durch die Photosynthese von Phytoplankton in das marine ¨Okosystem eingebracht. Marines Phytoplankton reguliert somit einen Groteil der ozeanischen Kohlenstoffsenke. Das Hauptziel der vorliegenden Dissertation ist es, die Wachstumsbedingungen von Phytoplankton im globalen Ozean durch eine Kombination von satelliten- basierten und neuen, physiologischen Modellen zu analysieren, und dadurch die biogeochemischen Kreisl¨aufe, die durch die phytoplanktische Elementzusammensetzung beeinflusst werden, besser zu beschreiben und vo- rauszuberechnen.
Kapitel 1 der Dissertation analysiert die globalen N¨ahrstoff- und Lichtlimitierungen auf das Phytoplank- tonwachstum abgeleitet von einem optimalit¨atsbasierten Modell. Die Analyse deutet auf starke N¨ahrstofflimi- tierung im tropischen und subtropischen Ozean, sowie Lichtlimitierung in den hohen Breitengraden, ins- besondere im Antarktischen Ozean, hin. Die N¨ahrstofflimitierung resultiert dabei prim¨ar aus limitierter Stickstoffverf¨ugbarkeit, w¨ahrend Phosphor als sekund¨arer, co-limitierender N¨ahrstoff fungiert. Basierend auf diesen Ergebnissen wurde in Kapitel 2 eine satelliten- und modelbasierte Methode entwickelt, welche global die Variationen von Nitrat im Oberfl¨achenwasser berechnet. Die Methode vermag es, die in situ Nitrat Beobachtungen von vier verschiedenen Messstationen vorherzusagen: von der Bermuda Atlantik Zeitreihe, der Hawaii Ozean Zeitreihe, der Kalifornischen K¨uste, sowie der Region s¨udlich von Neuseeland. Kapitel 3 kombiniert die genannten Studien, um global die vertikal-integrierten Prim¨arproduktionsraten, sowie die Konzentration des Phytoplanktonkohlenstoffs im Oberfl¨achenwasser mit einem optimalit¨atsbasierten Mod- ell abzusch¨atzen. Diese kohlenstoffbasierte Modellstudie zeigt global den Trend h¨ochster Produktionsraten in den niederen Breitengraden, insbesondere im ¨aquatorialen Pazifik. Auch der Anteil von Phytoplank- ton am gesamten partikul¨aren organischen Material ist in den tropischen und subtropischen Regionen am h¨ochsten ( 50 %) und nimmt in Richtung h¨oherer Breitengrade ab ( 15 %). Kapitel 4 pr¨asentiert eine Un- tersuchung der Stickstoffverlustprozesse in der Sauerstoffminimumzone des tropischen S¨udostpazifiks. Die Bedeutung dieser Untersuchung im Zusammenhang der vorliegenden Dissertation ist die Absch¨atzung von Produktions- und Exportraten durch die Kombination von bio-optischen und satellitenbasierten Algorith- men. Die Hauptaussage ist, dass der Export von organischem Material die laterale Verteilung von Prozessen des Stickstoffkreislaufs in der Sauerstoffminimumzone reguliert.
Phytoplankton-St¨ochiometry beschreiben k¨onnen. Darueberhinaus k¨onnen Modelle der physiologischen An- passung des Phytoplanktons an verschiedene N¨ahrstoff- und Lichtverh¨altnisse bestimmte globale Trends mariner Prim¨arproduktion, entsprechend der gegebenen Co-Limitierung, produzieren. Eine noch laufende Studie bewertet den Effekt der Eingliederung einer optimalit¨atsbasierten Modelle in ein Erdsystem-Modell.
Diese Arbeit wird es erlauben, die Empfindlichkeit mariner biogeochemischer Kreisl¨aufe auf Ver¨anderungen in phytoplanktischer Elementzusammensetzung, sowie deren Folgen f¨ur die marine Prim¨arproduktion und den Kohlenstoffexport abzusch¨atzen.
Dissertation, Lionel Arteaga Introduction
1 Introduction
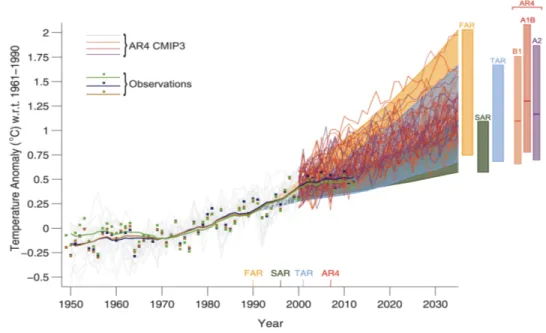
Over the last decades, there has been an increasing interest in understanding the fluxes and distribution of the major elements that regulate life on Earth. A great part of this interest is due to the realization that global biogeochemical cycles can be altered by human activities, resulting in changes in the balance of radiative energy of the Earth (Broecker,1975), and hence global surface temperature (Fig. 1). However, the flux of elements between the different compartments of the planet (atmosphere, ocean, and land) also occurs under natural circumstances (i.e., not induced by human activities) (Broecker and Henderson,1998), and these cycles regulate the composition of elements of the different compartments of Earth, as well as the overall temperature of the planet.
Figure 1: Estimated changes in the observed globally and annually averaged surface temperature anomaly relative to 1961-1990 (in◦C) since 1950 compared with the range of projections from the previous assess- ments of the Intergovernmental Panel on Climate Change (IPCC), taken fromCubasch et al.(2013). Values are harmonized to start from the same value in 1990. Observed global annual mean surface air temperature anomaly, relative to 1961-1990, is shown as squares and smoothed time series as solid lines (National Aero- nautics and Space Administration (NASA) (dark blue), National Oceanic and Atmospheric Administration (NOAA) (warm mustard), and the UK Hadley Centre (bright green) reanalyses). The coloured shading shows the projected range of global annual mean surface air temperature change from 1990 to 2035 for models used in the First Assessment Report (FAR), Second Assessment Report (SAR), Third Assessment Report (TAR). For the Fourth Assessment Report (AR4) results are presented as single model runs of the third Coupled Model Intercomparison Project (CMIP3) ensemble for the historical period from 1950 to 2000 (light grey lines) and for three scenarios (A2, A1B and B1) from 2001 to 2035 (seeCubasch et al.(2013) for details). The bars at the right-hand side of the graph show the full range given for 2035 for each assessment report.
1.1 The carbon cycle
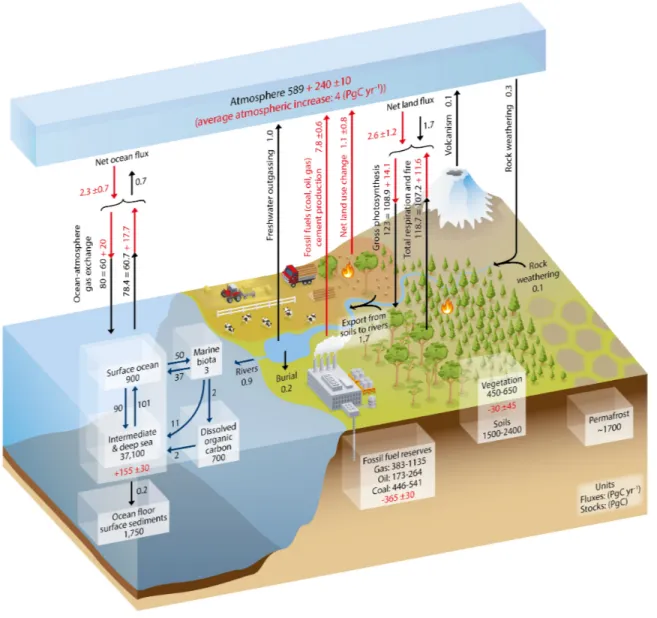
Carbon dioxide (CO2) is among the most important gases affecting the radiative properties of the atmosphere, despite only comprising less than 1 % of the Earth’s atmosphere (Cubasch et al., 2013). The global carbon (C) cycle can be conceptually divided into two domains characterized by the C turnover time of each domain. The “fast exchange domain” includes carbon stored in the oceans, atmosphere, surface sediments, land vegetation, as well as freshwater sources, and is characterized by turnover times from years to decades and millennia. The “slow exchange domain” is the largest one, it includes carbon stored in rocks and deep sediments, and its turnover times are around 10,000 years or longer (Ciais et al., 2013). Carbon exchange between the two domains is relatively small (<0.3 Pg C y−1), and it occurs through volcanism, chemical weathering, and sedimentation (Ciais et al.,2013). However, due to fossil fuel extraction and combustion, the amount of carbon released from geological reservoirs into the atmosphere has increased strongly over the Industrial Era, resulting in an accumulation of CO2 in the atmosphere (Canadell et al.,2007) (Fig. 2).
The oceans constitute the largest reservoir of carbon within the “fast exchange domain”, with about 38,000 Pg C (Sundquist, 1985, 1993). Most of this carbon reservoir (∼98 %) is in the form of dissolved inorganic carbon (DIC), while∼700 Pg C are estimated to be in the form of dissolved organic carbon (DOC) (Hansell et al.,2009). Prior to industrial times, the carbon cycle was considered to be roughly in a steady state, with the sum of all fluxes in and out of each reservoir being close to zero. As a result of anthropogenic carbon emissions, fluxes and reservoir sizes have changed (Seigenthaler and Sarmiento, 1993). The ocean is now considered to be an important sink of carbon. The average amount of C taken up by the ocean since the beginning of the industrial revolution has been estimated to be ∼ 1 Pg C y−1 (Tans et al., 1990; Sabine et al.,2004). Carbon is transported into the ocean by gas transfer, which is mainly regulated by changes in temperature and salinity of the surface ocean, and the CO2partial pressure (pCO2). Carbon is then further carried into the deep ocean through water convection driven by the global oceanic circulation. The overall mechanism of C sink into the ocean controlled mainly by physical processes is known as the Physical (or Solubility) Carbon Pump.
1.2 The biological carbon pump
The transport of carbon into the marine environment is also regulated by a set of processes carried out by living microorganisms, which constitute about 3 Pg C out of the total pool of 38,000 Pg C resident in the world’s oceans. This rather small amount of biomass represents∼0.2 % of global primary producer biomass, but is nonetheless responsible for about 50 % of the total C fixed into organic matter in the planet (Field,
Dissertation, Lionel Arteaga Introduction
Figure 2: Simplified schematic of the global carbon cycle. Numbers represent reservoir mass in Pg C and annual carbon exchange fluxes (in Pg C yr-1). Black numbers and arrows indicate reservoir mass and exchange fluxes estimated for the time prior to the Industrial Era, about 1750. Red arrows and numbers indicate annual anthropogenic fluxes averaged over the 2000-2009 time period. These fluxes are a perturbation of the carbon cycle during Industrial Era post 1750. The uptake of anthropogenic CO2 by the ocean and by terrestrial ecosystems, often called carbon sinks, are the red arrows part of Net land flux and Net ocean flux. Red numbers in the reservoirs denote cumulative changes of anthropogenic carbon over the Industrial Period 1750-2011. By convention, a positive cumulative change means that a reservoir has gained carbon since 1750. Uncertainties are reported as 90 % confidence intervals. Taken fromCiais et al.(2013).
1998). The set of processes by which C is fixed into organic (or inorganic) matter and eventually transferred to the deeper layers of the ocean is known as the Biological Carbon Pump. This biological pump is divided into: the organic or soft tissue pump driven by the formation of organic matter through photosynthesis; and the inorganic carbon pump, which results in the formation of inorganic carbon compounds and is driven by calcareous organisms. Both pumps have different immediate and long term consequences on the overall carbon cycle and CO2in particular. From here on, the term “biological carbon pump” will only refer to the organic carbon pump.
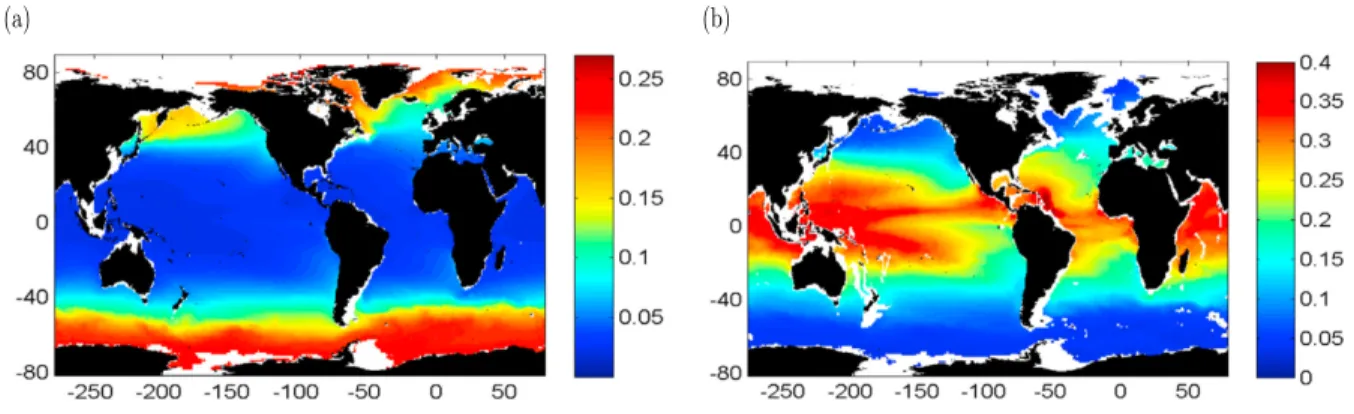
The biological carbon pump is a key process that transports photosynthetically fixed organic carbon from the sunlit surface layer to the deep ocean. Photosynthesis by phytoplankton constitutes the principal supply route of carbon into the marine ecosystem, contributing substantially to global biogeochemical fluxes, and hence acting as a major regulator of carbon sink in the ocean (Raven and Falkowski,1999). The efficiency of the biological pump depends on how much of the carbon fixed by phytoplankton sinks into the deep ocean, and is prevented from immediate release back to the atmosphere. The efficiency of this carbon pump varies in different parts of the ocean (Fig. 3), and depends on physical properties as well as the overall trophic structure of the ecosystem (Martin et al.,1987;Laws et al.,2000;Henson et al.,2012).
The efficiency and strength of the biological pump is believed to have varied over geological time scales, influencing, for example, the development of glacial/interglacial cycles (Sigman and Boyle, 2000). Part of this variability is attributed to alterations of phytoplankton primary production (PP) and changes in nutrient availability and utilization (Sigman and Boyle, 2000; Martin, 1990). In the same manner, simulations of the future ocean predict a decrease in global primary production induced by changes in the availability of nutrients and light, mainly as a result of increased stratification of the surface ocean (Sarmiento et al.,2004;
Bopp et al.,2013).
1.3 Modelling phytoplankton growth and marine primary production
1.3.1 Satellite-based models
Global marine primary production is∼50 Pg C y−1(Chavez et al.,2011). Global estimates of marine PP are mainly obtained through satellite-based models. These models are founded on either idealized relationships between net photosynthesis and irradiance or measurements of net primary production (Behrenfeld and Falkowski, 1997a). These algorithms depend on remotely sensed global observations of chlorophyll (Chl) and irradiance. The spatial and temporal resolution obtained from remote sensing methods has not yet been achieved by any other observation system. Satellite-based algorithms have been used to estimate
Dissertation, Lionel Arteaga Introduction
(a) (b)
Figure 3: Global patterns in carbon export efficiency as shown inHenson et al.(2012). a) Particule export efficiency, defined as the ratio of particulate organic carbon (POC) at 100m to primary production (PP) (POC at 100m:PP). b) Transfer efficiency, defined as the fraction of exported organic carbon that reaches the deep ocean (flux of organic C at 2000m:POC export at 100 m).
global marine production rates from Coastal Zones Color Scanner data (CZCS) (Longhurst et al., 1995;
Antoine et al., 1996; Behrenfeld and Falkowski, 1997b), the Sea-viewing Wide Field-of-view Sensor data (SeaWiFS) (Behrenfeld et al.,2001), and recently also from Moderate Resolution Imaging Spectroradiometer data (Behrenfeld et al.,2005;Westberry et al.,2008).
There is a wide range of bio-optical algorithms. The various models differ in the number and kind of environmental variables that they employ to estimate PP, the description of the vertical distribution of these properties within the euphotic zone, the number of parameters they use, and the general complexity of the models (Campbell et al., 2002). However, satellite-based models of marine PP are overall constrained by five main variables: surface phytoplankton biomass (Csurf), a photoadaptive variable (Poptb ), euphotic depth (Zeu), an irradiance dependent function (I), and daylenght or photoperiod (D) (Behrenfeld and Falkowski, 1997a). Beyond this general structure, there is no clear difference in the ability of models to estimate PP,
independently of the mathematical construction or complexity of the algorithms (Campbell et al.,2002).
One of the most commonly used PP satellite algorithms is the Vertical Generalized Production Model (VGPM, Behrenfeld and Falkowski,1997b). The VGPM serves as a good example of a general bio-optical model. The VGPM estimates primary production integrated over the euphotic depth (P Peu) via,
P Peu=Poptb ·0.66125· E0
E0+ 4.1·Zeu·Copt·D (1)
whereE0 is the sea surface daily photosynthetic active radiation (PAR) (mol quanta m−2), andCopt is the
Chl concentration (mg Chl m−3) atPoptb (mg C mg Chl−1h−1) (commonly taken as surface concentration).
Zeu has units of meters (m), andD is the photoperiod in decimal hours. Behrenfeld and Falkowski (1997b) reached the conclusion that expanding the VGPM to explainP Peuat each vertical level does not significantly increase the explanatory power of the model, and that the algorithm performance in estimating P Peu is critically dependent on the ability to accurately represent spatial (i.e., horizontal) and temporal variability in Poptb . Once Zeu, Chl concentration, and D were accounted for, PP could be adequately modeled with a simple formulation of an empirically determined, variable, light-dependent term (EE0
0+4.1) (Behrenfeld and Falkowski,1997b).
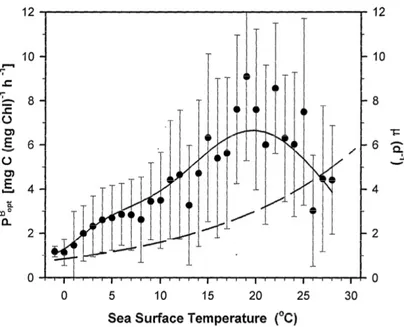
A key variable characteristic of each bio-optical algorithm is the description of how light-saturated pho- tosynthetic efficiency varies in the environment (Campbell et al., 2002; Carr et al., 2006). In the VGPM, this is described by Poptb , which represents the maximum C fixation rate in the water column. Poptb varies exclusively as a function of sea surface temperature (SST) (Fig. 4). AsPoptb is mechanistically related to the Chl-normalized maximun rate of C fixation Pmaxb (mg C mg Chl−1 h−1), the dependence of Poptb on SST is justified from a physiological perspective. Maximum photosynthetic rates are controlled by the capacity of Calvin cycle reactions and proportional to the number of functional photosynthetic reaction centers and their turnover rates (Falkowski,1980;Sukenik et al.,1987;Orellana and Perry,1992). However, the relation betweenPoptb and SST also describes the global general connection between warmer waters, shallower surface mixing depths and higher surface radiation. These conditions favor high-light acclimated phytoplankton, leading to higher photosynthetic rates as SST increases. There is nonetheless a countering effect, as warm ocean areas are also generally accompanied by low surface nutrient concentrations, inducing nutrient limi- tation of phytoplankton growth. Poptb starts to decrease beyond 20◦C (Fig 4). This decline is attributed to nutrient stress effects on phytoplankton (Behrenfeld and Falkowski,1997b).
Most satellite-based PP models infer phytoplankton biomass from surface Chl concentrations. An important drawback of these models is that they do not account for the acclimation of phytoplankton to changes in the environment via the chlorophyll to carbon ratio (Chl:C). This simplification implies that variations in phytoplankton C biomass can be linearly derived from Chl concentrations, which is not generally true (Geider et al.,1986;Armstrong,2006). Chl-based models, like the VGPM, show a global pattern of marine productivity with high PP rates in high latitudes and upwelling regions (∼ 800 mg C m2 d−1), and low PP (< 200 mg C m2 d−1) in tropical and subtropical regions, except for the Equatorial Pacific, where production rates are also high (Fig. 5a). Over recent years, optical models capable of estimating production rates based on carbon (instead of Chl) have been developed, showing important differences in the global
Dissertation, Lionel Arteaga Introduction
Figure 4: Measured (black dots,±standard deviation) and modeled (continuous line) photoadaptive parame- ter,Poptb , as a function of sea surface temperature (as presented inBehrenfeld and Falkowski,1997b). Dashed curve indicates the theoretical maximum specific growth rate,µ(d−1), of photoautotrophic unicellular algae described byEppley (1972).
distribution of oceanic PP (Behrenfeld et al.,2005;Westberry et al.,2008). These C-based models estimate higher production rates in low latitudes, particular over the Equatorial Pacific, Atlantic, and Indian Ocean (Fig. 5b). The differences and implications between the two approaches (Chl and C-based) will be further discussed in Chapter 3.
Satellite-based models are driven by the understanding of how photosynthetic rates vary as a function of biomass, temperature, and light. However, these formulations are inherently empirical and do not describe the physiological processes that lead to phytoplankton growth and carbon fixation. Oceanic primary pro- duction rates can also be inferred via the mechanistic description of the processes that limit phytoplankton growth. These kind of formulations are commonly combined with circulation models in order to project changes and trends in marine primary productivity and the future carbon cycle.
40oS 0o
40oN
80oS 80oN
mg C m−2 d−1
0 200 400 600 800 1000
40oS 0o
40oN
80oS 80oN
mg C m−2 d−1
0 200 400 600 800 1000
(a) (b)
Figure 5: Global mean PP for 2005 estimated with a Chl-based (VGPM,Behrenfeld and Falkowski,1997b) and a C-based model (Westberry et al., 2008).
1.3.2 Mechanistic models of phytoplankton growth
Nutrient limited phytoplankton growth is commonly represented by an hyperbolic function described by the Monod equation (Eq. 2, Fig. 6) (Monod,1949),
µ=µmax· S
K+S (2)
K"
S"
μ"
μ
max"μ
max/2"Figure 6: Schematic view of the rate of growth (µ) of phytoplankton as a function of nutrient concentration (S), as described by the Monod equation (Monod,1949). µmax is the maximun growth rate under nutrient replete conditions, andKis the half-saturation constant.
where µ is the growth rate,µmax is the maximun growth rate under nutrient replete conditions, K is the concentration of the nutrient at which µis half of µmax (i.e. half-saturation constant), and S is substrate or extracellular nutrient concentration. The Monod equation is identical the Michaelis-Menten equation
Dissertation, Lionel Arteaga Introduction
which describes enzyme kinetics. The Monod equation describes bacterial (and phytoplankton) growth as a function of one (limiting) nutrient. The treatment of multiple limiting nutrients is commonly dealt with by additive, multiplicative or threshold functional forms (O’Neill et al., 1989).
The maximum growth rate (µmax) is obtained under replete nutrient and light conditions. In the ocean, the amount of available light is controlled by diverse factors such as the latitudinal position, time of the day, cloud coverage, as well as the attenuation of light in the water column caused by the absorption and scattering by particulates and dissolved organic matter (Sathyendranath and Platt,1989). The response of photosynthesis (P) to irradiance (I) is described by the P–I curve (Fig. 7). The P–I curve looks somewhat similar to the Monod curve (Fig. 6). The P–I curve has been represented by a number of analytical expressions, some of which are similar to Eq. 2 (Platt and Jassby, 1976). Nutrient and light limited phytoplankton growth is commonly described by combining a formulation for P–I and Eq. 2.
I"
P"
Pmax"
Photoinhibi(on)
Figure 7: Schematic view of the rate of photosynthetic activity (P) as a function of irradiance (I). Pmax is the maximum photosynthetic rate. The P–I curve is similar to the Monod curve. A noticeable difference in the P–I curve is the final decrease in P as a product of photoinhibition due to excessive irradiation levels.
Phytoplankton growth is commonly simulated as a function of the most limiting nutrient employing Eq. 2.
Nitrogen (N) is considered the most limiting nutrient in the global ocean, particularly over the tropical and subtropical areas, seconded by Phosphorus (P) (Moore et al., 2013). Iron has also been identified as a limiting micronutrient in some marine environments such as the Equatorial Pacific (Behrenfeld et al.,1996) and the Southern Ocean (Martin et al., 1990). C-fixation rates are simulated by assuming a fixed cellular stoichiometric ratio among major limiting nutrients N, P, and C (Redfield ratio, Redfield, 1934). While the inference of constant elemental stoichiometry seems to hold on average for particulate organic matter (POM) in the global ocean, there is evidence of important variations across different latitudinal regimes (Martiny et al., 2013a). The assumption of constant stoichiometry is at odds with observed temporal and regional variations of elemental composition of phytoplankton and associated biogeochemical fluxes (Geider
and La Roche, 2002; K¨ortzinger et al., 2001). C:N:P ratios are observed to vary widely among different groups of phytoplankton (Quigg et al., 2003;Klausmeier et al.,2004) and in response to nutrient and light limitation (Flynn,2010). Furthermore, variations in the strength of the biological carbon pump resulting from phytoplankton acclimation to different nutrient and light regimes, or carbon fertilization induced via ocean acidification, cannot be assessed with models that do not allow for phytoplankton flexible stoichiometry.
An alternative way of modelling growth and carbon uptake by phytoplankton is employing cell-quota and optimality-based models. Cell-quota models (e.g., Droop, 1983) are capable of decoupling C, N, and P, while optimality-based models of phytoplankton growth offer the potential to understand the interrelations between phytoplankton stoichiometry and primary production in the ocean (Smith et al.,2011).
1.3.3 Optimality-based models
The inclusion of several nutrients commonly uses multiplicative or threshold formulae to combine the re- spective individual limiting effects on phytoplankton growth. The application of several Michaelis-Menten equations to describe multiple nutrient limitation tends to overestimate the uptake rate of non-limiting nu- trients when applied to data from chemostat experiments (Droop,1974;Rhee,1974). Most models account for multiple independent nutrient limitation (Saito et al.,2008), but do not fully describe the physiological effects of multiple-nutrient colimitation on phytoplankton growth. Several cell-quota and optimality-based models have been described yielding more accurate uptake rates for non-limiting nutrients, as well as a better description of the acclimation of photosynthetic cells to diverse light and nutrient regimes (Droop, 1973;Geider et al.,1998;Pahlow,2005;Armstrong,2006;Smith and Yamanaka,2007;Pahlow et al.,2013).
The kinetics of nutrient uptake are thought to resemble enzyme reactions (Lehninger, 1971). K, and the maximum uptake rate for a given nutrient (Vmax), are often assumed to be meaningful biological parameters able to describe competitive ability at low nutrient concentrations. Nevertheless, several studies have shown that nutrient uptake rates vary from nutrient limited (faster uptake) to nutrient replete (slower uptake) conditions (Syrett, 1956; Goldman et al., 1981). This suggests that phytoplankton can adapt its resource utilization rate accordingly to alterations in the ambient. Thus, the parameters setting the rate of nutrient uptake (K andVmax) must also vary as a function of the environmental conditions.
Nutrient uptake is an active processes that moves a certain nutrient (ion) from the surrounding environment to inside the cell. This process depends among other factors on the number of uptake sites (n), the area of uptakes sites (A), the handling time (h), and the velocity of transfer or mass transfer coefficient (v). Aksnes
Dissertation, Lionel Arteaga Introduction
and Egge (1991) related some of these factors toK andVmax through a common parameter, α.
α=Vmax
K =n·A·v (3)
Aksnes and Egge (1991) concluded that the application of the Michaelis-Menten model for nutrient uptake (Vn) is a particular case of a more elaborate equation (Eq. 4),
Vn= n·h−1·N
(A·v·h)−1+N (4)
in whichn,A,handv(and henceKandVmax) are constant. This new formulation was modified byPahlow (2005) in order to include a scheme for the optimal allocation of resources between nutrient uptake and nutrient turnover within the nutrient uptake apparatus. This optimization is achieved by describing α as a function of a maximum nutrient uptake affinity (α0) and an allocation parameter, fA, representing the amount of N-quota employed for nutrient uptake and enzyme activity (1-fA).
α=α0·fA (5)
The optimality-based model ofPahlow (2005) combines theoretical derivations of nutrient uptake (Aksnes and Egge, 1991) as well as photosynthesis and photoacclimation (Baumert, 1996) into an unifying theory where phytoplankton cells maximize their growth rate by optimally allocating their limited nutrient and energy resources among competing metabolic requirements.
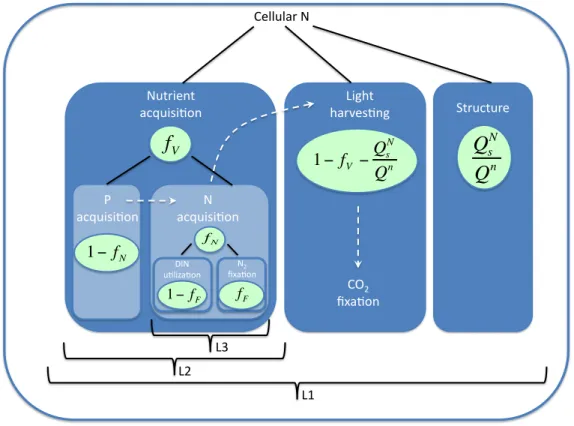
Pahlow and Oschlies (2009) extended the formulations of Pahlow (2005) in order to include nitrogen and phosphorus colimitation. This new formulation describes the integrated effects of N and P on phytoplankton physiology and growth. A further allocation level,fV, was later introduced by (Pahlow et al.,2013), which optimizes resource utilization between the nutrient acquisition and light harvesting apparatus. fV varies between 0 (all internal N-quota allocated for nutrient uptake) and 1 (internal N-quota fully allocated for photochemical machinery and enzyme activity). fV is optimized in order to achieve the maximum possible growth rate under given nutrient and light conditions (Fig. 8). The model of (Pahlow et al., 2013) also describes a multiple allocation scheme which includes a partition level that subdivides cellular N used for dissolved inorganic nitrogen (DIN) uptake and N2 fixation (Pahlow et al.,2013) (Fig. 9).
Enzymes(
Ion(channels(
Nutrients(
Low(nutrients(6>(more(
uptake(sites((large((((()( High(nutrients(6>(more(
enzymes((small(((((()(
€
f
V€
f
V€
f
V€
µopt
€
µ
€
fVopt
Figure 8: Schematic view of the optimal allocation of resources between nutrient uptake and photochemically- related enzyme activity viafV, and its effect onµ. µoptis the maximun growth rate given by the optimization offV (fVopt).
Cellular N
Nutrient
acquisi/on Light
harves/ng Structure
€
Q
sNQ
n€
1 − f
V− Q
sNQ
nCO2 fixa/on P
acquisi/on N
acquisi/on
€
1 − f
N€
f
V€
fN
DIN u/liza/on
N2
fixa/on
€
1− fF
€
fF
L3 L2
L1
Figure 9: Schematic view of the multiple allocation scheme in the model of Pahlow et al. (2013). Level 1 encompasses the whole cell and divides cellular N into 3 fractions, devoted to nutrient acquisition (fV), structural protein (QNs/QN), and light harvesting (1-fV-QNs/QN). Level 2 partitions nutrient acquisition into P and N-acquisition compartments, described by the allocation factor fN. Level 3 partitions the N acquisition branch into compartments responsible for dissolved inorganic nitrogen (DIN) uptake and N2
fixation via allocation factor fF. Dashed arrows indicate the chain of interactions among P, N, and C acquisition (adapted fromPahlow et al.,2013).
Dissertation, Lionel Arteaga Introduction
1.4 Thesis overview and author contributions
The motivation of this thesis is the understanding of the physiological regulation of phytoplankton growth with the goal to better describe and project biogeochemical cycles affected by phytoplankton stoichiometry.
With this aim, the constraints of phytoplankton growth in the global ocean are assessed through a combi- nation of satellite and model-based analysis. Satellite-derived products are used to drive the physiological plankton model, and to obtain new products of major biogeochemical significance. Most of the model anal- yses described in this thesis were carried out using the optimality-based model ofPahlow et al.(2013). This thesis begins with a novel analysis of nutrient and light colimitation of phytoplankton growth in the global ocean (Chapter 1). Motivated by the results of this study, a method to infer global surface marine nitrate concentrations was developed and evaluated against in situ observations and previous methods (Chapter 2).
Chapter 3 merges the results described in the previous chapters in order to estimate global production rates and C biomass of primary producers by allowing physiological acclimation of phytoplankton stoichiometry.
A study of processes controlling nitrogen loss in the Pacific Ocean is presented in Chapter 4. This study is based on satellite analyses to estimate production and carbon export and its relation to nitrogen loss in oxygen minimum zones. The thesis ends with a general discussion of the main results obtained and future directions, including an initial examination of the integration of optimality-based formulations in an Earth Sytem Climate model.
Chapter 1. Global patterns of phytoplankton nutrient and light colimitation inferred from an optimality- based model. Lionel Arteaga, Markus Pahlow, and Andreas Oschlies. The original idea and experimental design were developed by LA, MP, and AO. Modeling work and data analysis were carried out by LA.
The final manuscript was prepared by LA, with comments and corrections from MP and AO. This chapter describes the inference of variable phytoplankton cell-quotas employing an optimality-based model. Cell- quotas are used as a base to calculate nitrogen, phosphorus, and light limitation indices, and obtain global patterns of phytoplankton nutrient and light colimitation. The main results indicate that nitrogen is the major limiting nutrient in the tropical and subtropical ocean, with a secondary co-limiting interaction with phosphorus. Light limitation dominates in high latitudes. Predicted latitudinal patterns of C:P and N:P ratios agree to some extent with observed trends in stoichiometry of particulate organic matter.
Chapter 2. Global monthly sea surface nitrate fields estimated from remotely sensed sea surface temper- ature, chlorophyll, and modeled mixed layer depth. Lionel Arteaga, Markus Pahlow, and Andreas Oschlies.
Original idea was developed by LA. Experimental design was constructed by LA, MP, and AO. Modeling work and data analysis were carried out by LA. The final manuscript was prepared by LA, with comments and corrections from MP and AO. This chapter describes a novel method to estimate surface nitrate fields in the global ocean. Multiple local linear regressions between satellite-inferred Chl, SST and model-derived mixed layer depth (MLD) are employed on a 1◦ by 1◦ grid to asses the variability of surface nitrate on a monthly-basis. This method is able to predict nitrate concentrations at four different oceanographic sta- tions distributed in the Atlantic, Pacific and Southern Ocean, based on independent in situ observations.
This satellite-based approach can be employed for continuous monitoring of surface ocean nutrient variations.
Chapter 3. Contribution of phytoplankton to particulate organic carbon in the global ocean. Lionel Arteaga, Markus Pahlow, and Andreas Oschlies. Original idea was developed by LA. Experimental design was con- structed by LA, MP, and AO. Modeling work and data analysis were carried out by LA. The final manuscript was prepared by LA, with comments and corrections from MP and AO. This chapter describes the estima- tion of global primary production rates employing an optimality-based model of phytoplankton growth and satellite-derived estimates of surface ocean Chl and particulate organic carbon. Global production rates are compared with bio-optical models of PP based on the inference of phytoplankton Chl and C. An assessment of the contribution of phytoplankton to total carbon biomas in the global ocean is presented. Phytoplankton contributes to about 60 % of total POC in low latitudes, and about 15 % in higher latitudes.
Chapter 4. Nitrogen cycling driven by organic matter export in the South Pacific oxygen minimum zone.
Tim Kalvelage, Gaute Lavik, Phyllis Lam, Sergio Contreras, Lionel Arteaga, Carolin R. L¨oscher, Andreas Oschlies, Aureli´en Paulmier, and Marcel M. M. Kuypers. TK, GL and MMMK. designed the study. TK, GL, SC and AP performed15N-labelling experiments. TK, GL and PL analysed the data. CRL carried out functional gene analyses. LA and AO modelled export production rates. LS provided CTD and ADCP data.
TK, GL, PL and MMMK. wrote the manuscript with input from all co-authors. This chapter describes an analysis of anammox and denitrification rates in the oxygen minimum zone of the South Pacific Ocean. The relation of this study with the overall context of this thesis is the calculation of production and export rates of organic matter with bio-optical and satellite-based algorithms. This work concludes that export rates of organic matter regulate nitrogen loss from oxygen minimun zones.
Dissertation, Lionel Arteaga Introduction
References
Aksnes, D. J., and J. K. Egge (1991), A theoretical model for nutrient uptake in phytoplankton, Marine Ecology Progress Series,70, 65–72.
Antoine, D., J. M. Andr´e, and A. Morel (1996), Ocean primary production 2. Estimation at global scale from satellite (Coastal Zone Color Scanner) chlorophyll,Global Biogeochemical Cycles,10(1), 57–69.
Armstrong, R. (2006), Optimality-based modeling of nitrogen allocation and photoacclimation in photosyn- thesis,Deep Sea Research Part II: Topical Studies in Oceanography,53(5-7), 513–531, doi: 10.1016/j.dsr2.
2006.01.020.
Baumert, H. (1996), On the theory of photosynthesis and growth in phytoplankton. part I: Light limitation and constant temperature, Internationale Revue der gesamten Hydrobiologie und Hydrographie, 81(1), 109–139, doi: 10.1002/iroh.19960810113.
Behrenfeld, M. J., and P. G. Falkowski (1997a), A consumer’s guide to phytoplankton primary productivity models,Limnology and Oceanography,42(7), 1479–1491, doi: 10.4319/lo.1997.42.7.1479.
Behrenfeld, M. J., and P. G. Falkowski (1997b), Photosynthetic rates derived from satellite-based chlorophyll concentration,Limnology and Oceanography,42(1), 1–20, doi: 10.4319/lo.1997.42.1.0001.
Behrenfeld, M. J., A. J. Bale, Z. S. Kolber, J. Aiken, and P. G. Falkowski (1996), Confirmation of iron limitation of phytoplankton in the equatorial Pacific Ocean,Nature,383, 508–511, doi: 10.1038/383508a0.
Behrenfeld, M. J., J. T. Randerson, C. R. McClain, G. C. Feldman, S. O. Los, C. J. Tucker, P. G. Falkowski, C. B. Field, R. Frouin, W. E. Esaias, D. D. Kolber, and N. H. Pollack (2001), Biospheric primary produc- tion during an enso transition,Science,291(5513), 2594–2597, doi: 10.1126/science.1055071.
Behrenfeld, M. J., E. Boss, D. A. Siegel, and D. M. Shea (2005), Carbon-based ocean productivity and phy- toplankton physiology from space,Global Biogeochemical Cycles,19, GB1006, doi:10.1029/2004GB002299.
Bopp, L., L. Resplandy, J. C. Orr, S. C. Doney, J. P. Dunne, M. Gehlen, P. Halloran, C. Heinze, T. Ilyina, R. S´ef´erian, J. Tjiputra, and M. Vichi (2013), Multiple stressors of ocean ecosystems in the 21st century:
projections with cmip5 models,Biogeosciences,10(10), 6225–6245, doi: 10.5194/bg-10-6225-2013.
Broecker, W. S. (1975), Climatic change: Are we on the brink of a pronounced global warming?, Science, 189(4201), 460–463, doi: 10.1126/science.189.4201.460.
Broecker, W. S., and G. M. Henderson (1998), The sequence of events surrounding termination ii and their implications for the cause of glacial-interglacial CO2 changes,Paleoceanography,13(4), 352–364, doi:
10.1029/98PA00920.
Campbell, J., D. Antoine, R. Armstrong, K. Arrigo, W. Balch, R. Barber, M. Behrenfeld, R. Bidigare, J. Bishop, M.-E. Carr, W. Esaias, P. Falkowski, N. Hoepffner, R. Iverson, D. Kiefer, S. Lohrenz, J. Marra, A. Morel, J. Ryan, V. Vedernikov, K. Waters, C. Yentsch, and J. Yoder (2002), Comparison of algorithms for estimating ocean primary production from surface chlorophyll, temperature, and irradiance, Global Biogeochemical Cycles,16(3), 9–1–9–15, doi: 10.1029/2001GB001444.
Canadell, J. G., C. Le Qur, M. R. Raupach, C. B. Field, E. T. Buitenhuis, P. Ciais, T. J. Conway, N. P. Gillett, R. A. Houghton, and G. Marland (2007), Contributions to accelerating atmospheric CO2 growth from economic activity, carbon intensity, and efficiency of natural sinks, Proceedings of the National Academy of Sciences,104(47), 18,866–18,870, doi: 10.1073/pnas.0702737104.
Carr, M., M. Friedrichs, M. Schmeltz, M. Noguchiaita, D. Antoine, K. Arrigo, I. Asanuma, O. Aumont, R. Barber, and M. Behrenfeld (2006), A comparison of global estimates of marine primary production from ocean color, Deep Sea Research Part II: Topical Studies in Oceanography, 53(5-7), 741–770, doi:
10.1016/j.dsr2.2006.01.028.
Chavez, F. P., M. Messi´e, and J. T. Pennington (2011), Marine primary production in relation to climate variability and change,Annual review of marine science,3, 227–260, doi: 10.1146/annurev.marine.010908.
163917.
Ciais, P., C. Sabine, G. Bala, L. Bopp, V. Brovkin, J. Canadell, A. Chhabra, R. DeFriesa, J. Galloway, M. Heimann, C. Jones, C. L. Quere, R. Myneni, S. Piao, and P. Thornton (2013), Carbon and Other Biogeochemical Cycles. In, Climate Change 2013: The Physical Science Basis. Contribution of Working Group I to the Fifth Assessment Report of the Intergovernmental Panel on Climate Change, Cambridge University Press, Cambridge, United Kingdom and New York, NY, USA.
Cubasch, U., D. Wuebbles, D. Chen, M. Facchini, D. Frame, N. Mahowald, and J.-G. Winther (2013), Introduction. In, Climate Change 2013: The Physical Science Basis. Contribution of Working Group I to the Fifth Assessment Report of the Intergovernmental Panel on Climate Change, Cambridge University Press, Cambridge, United Kingdom and New York, NY, USA.
Dissertation, Lionel Arteaga Introduction
Droop, M. R. (1973), Some thoughts on nutrient limitation in algae, Journal of Phycology, 9(3), 264–272, doi: 10.1111/j.1529-8817.1973.tb04092.x.
Droop, M. R. (1974), The nutrient status of algal cells in continuous culture,Journal of the Marine Biological Association of the United Kingdom,54, 825–855, doi: 10.1017/S002531540005760X.
Droop, M. R. (1983), 25 Years of algal growth kinetics a personal view, Botanica Marina, XXVI, 99–112, doi: 10.1515/botm.1983.26.3.99.
Eppley, R. W. (1972), Temperature and phytoplankton growth in the sea,Fishery Bulletin,70(4), 1063–1085.
Falkowski, P. (1980), Light-shade adaptation in marine phytoplankton, in Primary Productivity in the Sea, Environmental Science Research, vol. 19, edited by P. Falkowski, pp. 99–119, Springer US, doi: 10.1007/
978-1-4684-3890-1 6.
Field, C. B. (1998), Primary Production of the Biosphere: Integrating Terrestrial and Oceanic Components, Science,281(5374), 237–240, doi: 10.1126/science.281.5374.237.
Flynn, K. J. (2010), Do external resource ratios matter?, Jounal of Marine Systems, 83, 170–180, doi:
10.1016/j.jmarsys.2010.04.007.
Geider, R., and J. La Roche (2002), Redfield revisited: variability of C:N:P in marine microalgae and its biochemical basis,European Journal of Phycology,37(1), 1–17, doi: 10.1017/S0967026201003456.
Geider, R. J., T. Platt, and J. Raven (1986), Size dependence of growth and photosynthesis in diatoms: a synthesis,Marine Ecology Progress Series,30, 93–104.
Geider, R. J., H. L. MacIntyre, and T. Kana (1998), A dynamic regulatory model of phytoplanktonic acclimation to light, nutrients, and temperature,Limnology and Oceanography, 43(4), 679–694, doi: 10.
4319/lo.1998.43.4.0679.
Goldman, J., C. Taylor, and P. Glibert (1981), Nonlinear Time-Course Uptake of Carbon and Ammonium by Marine Phytoplankton ,Marine Ecology Progress Series,6, 137–148, doi: 10.3354/meps006137.
Hansell, D., C. Carlson, D. Repeta, and R. Schlitzer (2009), Dissolved Organic Matter in the Ocean: A Controversy Stimulates New Insights,Oceanography,22(4), 202–211, doi: 10.5670/oceanog.2009.109.
Henson, S. A., R. Sanders, and E. Madsen (2012), Global patterns in efficiency of particulate organic carbon export and transfer to the deep ocean,Global Biogeochemical Cycles,26(1), doi: 10.1029/2011GB004099.
Klausmeier, C., E. Litchman, T. Daufresne, and S. Levin (2004), Optimal nitrogen-to-phosphorus stoichiom- etry of phytoplankton,Nature, 429, 171–174, doi: 1.1029/2001GL014649.
K¨ortzinger, A., W. Koeve, P. K¨ahler, and L. Mintrop (2001), C : N ratios in the mixed layer during the productive season in the northeast Atlantic Ocean, Deep-Sea Research Part I, 48(3), 661–688, doi: 10.
1016/S0967-0637(00)00051-0.
Laws, E. A., P. G. Falkowski, W. O. Smith, H. Ducklow, and J. J. McCarthy (2000), Temperature effects on export production in the open ocean, Global Biogeochemical Cycles, 14(4), 1231–1246, doi: 10.1029/
1999GB001229.
Lehninger, A. L. (1971),Bioenergetics, Benjaming/Cummings, New York.
Longhurst, A., S. Sathyendranath, T. Platt, and C. Caverhill (1995), An estimate of global primary produc- tion in the ocean from satellite radiometer data,Journal of Plankton Research,17(6), 1245–1271.
Martin, J. (1990), Glacial-interglacial CO2 change: The iron hypothesis, Paleoceanography, 5, 1–13, doi:
10.1029/PA005i001p00001.
Martin, J., R. M. Gordon, and S. E. Fitzwater (1990), Iron in Antartic waters, Nature, 345, 156–158, doi:10.1038/345156a0.
Martin, J. H., G. A. Knauer, D. M. Karl, and W. W. Broenkow (1987), Vertex: carbon cycling in the northeast pacific, Deep Sea Research Part A. Oceanographic Research Papers, 34(2), 267 – 285, doi:
http://dx.doi.org/10.1016/0198-0149(87)90086-0.
Martiny, A. C., C. T. a. Pham, F. W. Primeau, J. a. Vrugt, J. K. Moore, S. a. Levin, and M. W. Lomas (2013a), Strong latitudinal patterns in the elemental ratios of marine plankton and organic matter,Nature Geoscience,6, 279–283, doi: 10.1038/ngeo1757.
Monod, J. (1949), The growth of bacterial cultures, Annual Review of Microbiology, 3(1), 371–394, doi:
10.1146/annurev.mi.03.100149.002103.
Moore, C. M., M. M. Mills, K. R. Arrigo, I. Berman-Frank, L. Bopp, P. W. Boyd, E. D. Galbraith, R. J.
Geider, C. Guieu, S. L. Jaccard, T. D. Jickells, J. La Roche, T. M. Lenton, N. M. Mahowald, E. Mara˜n´on, I. Marinov, J. K. Moore, T. Nakatsuka, A. Oschlies, M. A. Saito, T. F. Thingstad, A. Tsuda, and O. Ulloa (2013), Processes and patterns of oceanic nutrient limitation,Nature Geoscience,6, doi: 10.1038/ngeo1765.
Dissertation, Lionel Arteaga Introduction
O’Neill, R., D. DeAngelis, J. Pastor, B. Jackson, and W. Post (1989), Multiple nutrient limitations in ecological models,Ecological Modelling,46(34), 147 – 163, doi: http://dx.doi.org/10.1016/0304-3800(89) 90015-X.
Orellana, M. V., and M. J. Perry (1992), An immunoprobe to measure Rubisco concentrations and maximal photosynthetic rates of individual phytoplankton cells,Limnology and Oceanography,37(3), 478–490, doi:
10.4319/lo.1992.37.3.0478.
Pahlow, M. (2005), Linking chlorophyll-nutrient dynamics to the Redfield N:C ratio with a model of optimal phytoplankton growth,Marine Ecology Progress Series,287, 33–43, doi: 10.3354/meps287033.
Pahlow, M., and A. Oschlies (2009), Chain model of phytoplankton P, N and light colimitation, Marine Ecology Progress Series,376, 69–83, doi: 10.3354/meps07748.
Pahlow, M., H. Dietze, and A. Oschlies (2013), Optimality-based model of phytoplankton growth and dia- zotrophy,Marine Ecology Progress Series,489, 1–16, doi: 10.3354/meps10449.
Platt, T., and A. D. Jassby (1976), The relationship between photosynthesis and light for natural assemblages of coastal marine phytoplankton, Journal of Phycology, 12(4), 421–430, doi: 10.1111/j.1529-8817.1976.
tb02866.x.
Quigg, A., Z. V. Finkel, A. J. Irwin, Y. Rosenthal, T.-Y. Ho, J. R. Reinfelder, O. Schofield, F. M. M.
Morel, and P. G. Falkowski (2003), The evolutionary inheritance of elemental stoichiometry in marine phytoplankton.,Nature, 425, 291–294, doi: 10.1038/nature01953.
Raven, J. a., and P. G. Falkowski (1999), Oceanic sinks for atmospheric CO2,Plant, Cell and Environment, 22(6), 741–755, doi: 10.1046/j.1365-3040.1999.00419.x.
Redfield, A. (1934), On the proportions of organic derivatives in sea water and their relation to the compo- sition of plankton,James Johnstone Memorial Volume,University Press of Liverpool, 176–192.
Rhee, G.-Y. (1974), Phosphate uptake under nitrate limitation by scenedesmus sp. and its ecological impli- cations,Journal of Phycology,10(4), 470–475, doi: 10.1111/j.1529-8817.1974.tb02742.x.
Sabine, C. L., R. a. Feely, N. Gruber, R. M. Key, K. Lee, J. L. Bullister, R. Wanninkhof, C. S. Wong, D. W. R. Wallace, B. Tilbrook, F. J. Millero, T.-H. Peng, A. Kozyr, T. Ono, and A. F. Rios (2004), The oceanic sink for anthropogenic CO2,Science,305, 367–71, doi: 10.1126/science.1097403.
Saito, M. A., T. J. Goepfert, and J. J. Ritt (2008), Some thoughts on the concept of colimitation: Three definitions and the importance of bioavailability,Limnololy and Oceanography,53(1), 276–290.
Sarmiento, J. L., R. Slater, R. Barber, L. Bopp, S. C. Doney, A. C. Hirst, J. Kleypas, R. Matear, U. Miko- lajewicz, P. Monfray, S. V., S. A. Spall, and R. Stouffer (2004), Response of ocean ecosystems to climate warming,Global Biogeochemical Cycles,18, GB3003, doi:10.1029/2003GB002134.
Sathyendranath, S., and T. Platt (1989), Computation of aquatic primary production: Extended formalism to include effect of angular and spectral distribution of light,Limnology and Oceanography,34(1), 188–198, doi: 10.4319/lo.1989.34.1.0188.
Seigenthaler, U., and J. L. Sarmiento (1993), Atmospheric carbon dioxide in the ocean,Nature,363, 119–125, doi: 10.1038/365119a0.
Sigman, D. M., and E. A. Boyle (2000), Glacial/interglacial variations in atmospheric carbon dioxide,Nature, 407(6806), 859–869, doi: 10.1038/35038000.
Smith, S. L., and Y. Yamanaka (2007), Optimization-based model of multinutrient uptake kinetics,Limnology and Oceanography,52(4), 1545–1558, doi: 10.4319/lo.2007.52.4.1545.
Smith, S. L., M. Pahlow, A. Merico, and K. W. Wirtz (2011), Optimality-based modeling of planktonic organisms,Limnology and Oceanography,56(6), 2080–2094, doi: 10.4319/lo.2011.56.6.2080.
Sukenik, A., J. Bennett, and P. Falkowski (1987), Light-saturated photosynthesis, limitation by electron transport or carbon fixation?, Biochimica et Biophysica Acta (BBA) - Bioenergetics, 891(3), 205 – 215, doi: http://dx.doi.org/10.1016/0005-2728(87)90216-7.
Sundquist, E. T. (1985),The Carbon Cycle and Atmospheric CO2: Natural Variations Archean to Present, 5–59 pp., American Geophysical Union, Washington, DC, USA.
Sundquist, E. T. (1993), The global carbon dioxide budget, Science, 259(5097), 934–941, doi: 10.1126/
science.259.5097.934.
Syrett, P. J. (1956), The assimilation of ammonia and nitrate by nitrogen-starved cells of chlorella vulgaris, Physiologia Plantarum,9(1), 19–27, doi: 10.1111/j.1399-3054.1956.tb08988.x.
Tans, P. P., I. Y. Fung, and T. Takahashi (1990), Observational constrains on the global atmospheric CO2 budget,Science,247(4949), 1431–1438, doi: 10.1126/science.247.4949.1431.
Dissertation, Lionel Arteaga Introduction
Westberry, T., M. J. Behrenfeld, D. A. Siegel, and E. Boss (2008), Carbon-based primary productivity modeling with vertically resolved photoacclimation, Global Biogeochemical Cycles, 22, GB2024, doi: 10.
1029/2007GB003078.
Dissertation, Lionel Arteaga Chapter 1
2 Thesis chapters
2.1 Chapter 1: Global patterns of phytoplankton nutrient and light colimita- tion inferred from an optimality-based model.
Lionel Arteaga, Markus Pahlow, and Andreas Oschlies.
Published article: Arteaga, L., M. Pahlow, and A. Oschlies (2014), Global patterns of phytoplankton nu- trient and light colimitation inferred from an optimality-based model,Global Biogeochemical Cycles,28(7), 648–661, doi: 10.1002/2013GB004668
Global Biogeochemical Cycles
RESEARCH ARTICLE
10.1002/2013GB004668
Key Points:
• Description of phytoplankton growth colimitation by nutrients and light
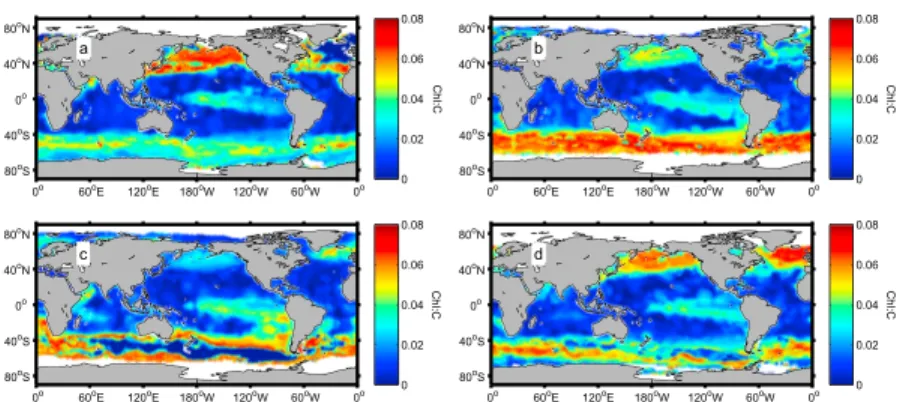
• Prediction of phytoplankton cellular quotas of N, P, and Chl
Correspondence to:
L. Arteaga, larteaga@geomar.de
Citation:
Arteaga, L., M. Pahlow, and A. Oschlies (2014), Global patterns of phytoplank- ton nutrient and light colimitation inferred from an optimality-based model,Global Biogeochem. Cycles,28, doi:10.1002/2013GB004668.
Received 5 JUN 2013 Accepted 11 JUN 2014 Accepted article online 13 JUN 2014
Global patterns of phytoplankton nutrient and light colimitation inferred from an optimality-based model
Lionel Arteaga1, Markus Pahlow1, and Andreas Oschlies1
1GEOMAR Helmholtz Centre for Ocean Research Kiel, Kiel, Germany
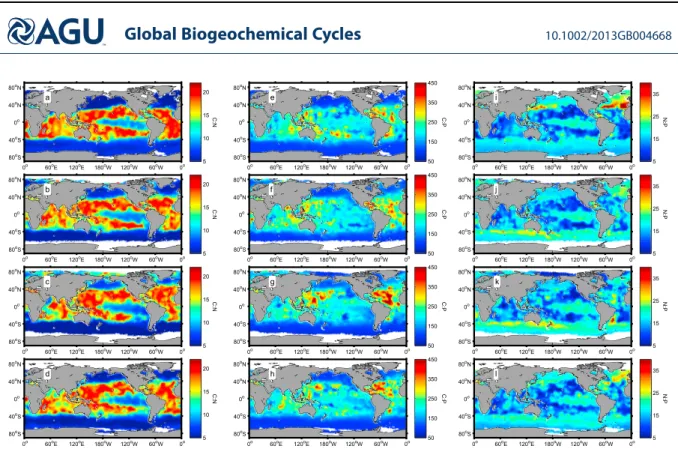
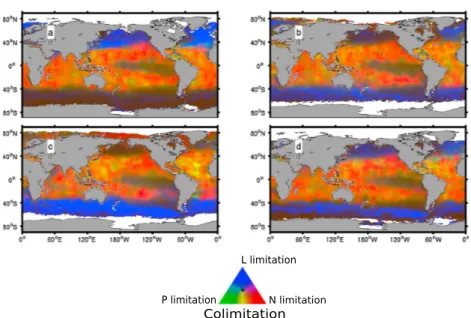
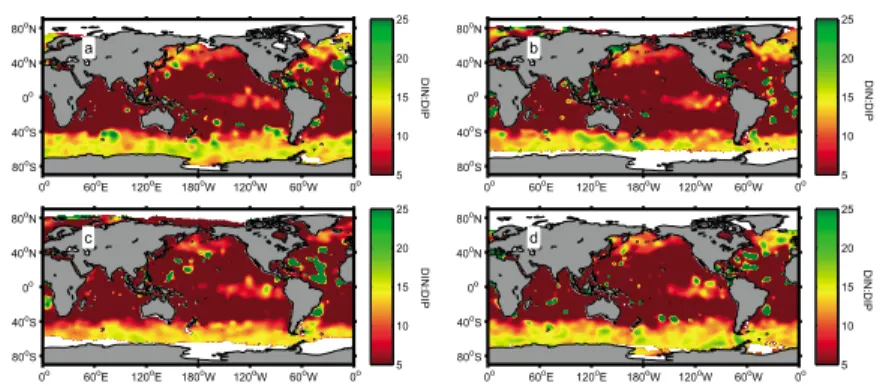
AbstractThe widely used concept of constant ”Redfield” phytoplankton stoichiometry is often applied for estimating which nutrient limits phytoplankton growth in the surface ocean. Culture experiments, in contrast, show strong relations between growth conditions and cellular stoichiometry with often substantial deviations from Redfield stoichiometry. Here we investigate to what extent both views agree by analyzing remote sensing and in situ data with an optimality-based model of nondiazotrophic phytoplankton growth in order to infer seasonally varying patterns of colimitation by light, nitrogen (N), and phosphorus (P) in the global ocean. Our combined model-data analysis suggests strong N and N-P colimitation in the tropical ocean, seasonal light, and N-P colimitation in the Northern Hemisphere, and strong light limitation only during winter in the Southern Ocean. The eastern equatorial Pacific appears as the only ocean area that is essentially not limited by N, P, or light. Even though our optimality-based approach specifically accounts for flexible stoichiometry, inferred patterns of N and P limitation are to some extent consistent with those obtained from an analysis of surface inorganic nutrients with respect to the Redfield N:P ratio.
Iron is not part of our analysis, implying that we cannot accurately predict N cell quotas in high-nutrient, low-chlorophyll regions. Elsewhere, we do not expect a major effect of iron on the relative distribution of N, P, and light colimitation areas. The relative importance of N, P, and light in limiting phytoplankton growth diagnosed here by combining observations and an optimal growth model provides a useful constraint for models used to predict future marine biological production under changing environmental conditions.
1. Introduction
Attempts to construct a synthesis of global marine production and its impacts on global biogeochemi- cal cycles often rely on the assumption of constant elemental stoichiometry of phytoplankton (Redfield stoichiometry, [Redfield, 1934]). While convenient and roughly consistent with globally averaged relations inferred from biogeochemical tracer distributions [Fanning, 1992], the assumption of constant elemen- tal stoichiometry is at odds with observed temporal and regional variations of elemental composition of phytoplankton and associated biogeochemical fluxes [Geider and LaRoche, 2002;Körtzinger et al., 2001].
Carbon:nitrogen:phosphorus (C:N:P) ratios are observed to vary widely among different groups of phyto- plankton [Quigg et al., 2003;Klausmeier et al., 2004] and in response to nutrient and light limitation [Flynn, 2010;Healey, 1985;Laws and Bannister, 1980].
There is no clear physiological reason why C:N:P ratios of phytoplankton should strictly adhere to any partic- ular stoichiometry (e.g., Redfield stoichiometry, [Geider and LaRoche, 2002]). Although the molar Redfield N:P ratio of 16 is commonly used as a threshold indicating either N or P limitation [Fanning, 1992;Goldman et al., 1979], we are not aware of any direct evidence that a N:P ratio of 16 separates N and P limitation of phyto- plankton growth. On the contrary, chemostat experiments suggest that the transition from N to P limitation occurs at N:P supply ratios of about 30 [Rhee, 1978]. This leads to the conclusion that previous methods for inferring N or P limitation in the surface ocean may need to be revised.
The ratio of dissolved inorganic N:P (DIN:DIP) in the ocean (mainly NO−3, NH+4, and PO3−4 ) results from the balance of nutrient supply from below and differential utilization by phytoplankton and bacteria within the euphotic zone. Shifts in phytoplankton optimal N:P will likely induce alterations in the DIN:DIP ratio [Weber and Deutsch, 2012]. Empirical cell quota models [Droop, 1983] are capable of decoupling C, N, and P, while optimality-based models of phytoplankton growth offer the potential to help understand the interrelations between phytoplankton stoichiometry and primary production in the ocean [Smith et al., 2011]. Recently,
ARTEAGA ET AL. ©2014. American Geophysical Union. All Rights Reserved. 1