1. Introduction
As phytoplankton play a fundamental role in marine food webs and biogeochemical cycling, their commu- nity structure and taxonomic composition have been widely investigated in recent decades through vari- ous observational methods and ecological modeling (e.g., Falkowski et al., 2003; IOCCG, 2014; Le Quéré
Abstract
First, we retune an algorithm based on empirical orthogonal functions (EOFs) for globally retrieving the chlorophyll a concentration (Chl-a) of phytoplankton functional types (PFTs) from multisensor merged ocean color (OC) products. The retuned algorithm, referred to as EOF-SST hybrid algorithm, is improved by: (i) using 23% more matchups between the updated global in situ pigment database and satellite remote sensing reflectance (Rrs) products, and (ii) including sea surface temperature (SST) as an additional input parameter. In addition to the Chl-a of the six PFTs (diatoms, haptophytes, dinoflagellates, green algae, prokaryotes, and Prochlorococcus), the fractions of prokaryote and Prochlorococcus Chl-a to total Chl-a (TChl-a), are also retrieved by the EOF-SST hybrid algorithm.Matchup data are separated for low and high-temperature regimes based on different PFT dependences on SST, to establish SST-separated hybrid algorithms which demonstrate further improvements in performance as compared to the EOF-SST hybrid algorithm. The per-pixel uncertainty of the retrieved TChl-a and PFT products is estimated by taking into account the uncertainties from both input data and model parameters through Monte Carlo simulations and analytical error propagation. The algorithm and its method to determine uncertainties can be transferred to similar OC products until today, enabling long-term continuous satellite observations of global PFT products. Satellite PFT uncertainty is essential to evaluate and improve coupled ecosystem-ocean models which simulate PFTs, and furthermore can be used to directly improve these models via data assimilation.
Plain Language Summary
Phytoplankton in the sunlit layer of the ocean contribute approximately 50% to global primary production. They act as the base of the marine food web fueling fisheries, and also regulate key biogeochemical processes such as exporting carbon to the deep ocean.Phytoplankton contain various taxonomic groups that function differently in the marine ecosystem. The global phytoplankton can be observed from space by analyzing the signal leaving from the water surface recorded by the ocean color (OC) sensors onboard the satellites. Based on an updated large global data set, satellite data from different OC sensors, and sea surface temperature data, we adapted our previous approach to improve the quantification of the biomass of the main six phytoplankton groups on a global scale. The uncertainty of the satellite products of the phytoplankton groups is calculated by considering the errors propagated from the satellite data and the model parameters. This approach for quantifying different phytoplankton groups, together with the uncertainty assessment, can be extended to other similar OC satellite data which cover different time periods, to ultimately generate long-term global distribution maps of multiple phytoplankton groups. This information will help the modelers to predict better the phytoplankton changes in the future.
© 2021. The Authors.
This is an open access article under the terms of the Creative Commons Attribution-NonCommercial License, which permits use, distribution and reproduction in any medium, provided the original work is properly cited and is not used for commercial purposes.
Using Multisensor Ocean Color and Sea Surface Temperature Satellite Products
Hongyan Xi1 , Svetlana N. Losa1,2, Antoine Mangin3, Philippe Garnesson3,
Marine Bretagnon3, Julien Demaria3, Mariana A. Soppa1, Odile Hembise Fanton d'Andon3, and Astrid Bracher1,4
1Alfred Wegener Institute, Helmholtz Centre for Polar and Marine Research, Bremerhaven, Germany, 2Shirshov Institute of Oceanology, Russian Academy of Sciences, Moscow, Russia, 3ACRI-ST, Sophia Antipolis Cedex, France,
4Institute of Environmental Physics, University of Bremen, Bremen, Germany Key Points:
• An algorithm for globally retrieving multiple phytoplankton functional types (PFTs) is retuned by including sea surface temperature data
• Improved satellite PFT products are provided using the GlobColour merged ocean color products
• The per-pixel uncertainty of the satellite PFT products is assessed in detail by accounting for errors from input data and model parameters
Supporting Information:
Supporting Information may be found in the online version of this article.
Correspondence to:
H. Xi,
Hongyan.Xi@awi.de
Citation:
Xi, H., Losa, S. N., Mangin, A., Garnesson, P., Bretagnon, M., Demaria, J., et al. (2021). Global chlorophyll a concentrations of phytoplankton functional types with detailed uncertainty assessment using multisensor ocean color and sea surface temperature satellite products. Journal of Geophysical Research: Oceans, 126, e2020JC017127. https://doi.
org/10.1029/2020JC017127 Received 23 DEC 2020 Accepted 10 APR 2021
et al., 2005). With a vast amount of quality-controlled ocean color (OC) remote sensing data now available, methods to infer the dominance or fraction of phytoplankton groups, size classes (PSCs) and phytoplankton functional types (PFTs) on a large scale both in space and time have evolved. Retrieval algorithms for phy- toplankton composition have generally been developed based on both in situ measurements and satellite products, the former providing the ground truth information at specific time and location, but with the latter regularly repeated, high spatial resolution observations can be achieved.
Radiance or reflectance signals leaving the ocean surface and measured by a satellite radiometer contain phytoplankton pigment information that can be related to community structure and size classes (Brach- er et al., 2017; Mouw et al., 2017). Therefore, spectral-based approaches have been developed to retrieve the concentrations of phytoplankton chlorophyll, pigments, and multiple PFTs from space (e.g., Alvain et al., 2005, 2008; Bracher et al., 2009; Correa-Ramirez et al., 2018; Lange et al., 2020; Werdell et al., 2014;
Xi et al., 2020). One such approach that has proven efficient is based on the empirical orthogonal function (EOF) analysis on the spectral Rrs or water-leaving radiance. By reducing the high dimensionality of the spectral data, the dominant signals that best describe the variance of the structures lying in the spectra can be assessed to establish statistical models for predicting OC metrics, including various phytoplankton pigment and PFT chlorophyll a concentrations (Chl-a) (e.g., Bracher et al., 2015; Craig et al., 2012; Lange et al., 2020; Lubac & Loisel, 2007; Soja-Woźniak et al., 2017; Taylor et al., 2013; Xi et al., 2020). Approaches based on EOF analysis also exhibited equivalent skill with a little downgrading of the performance when applied to reduced spectral resolution (Bracher et al., 2015), enabling their wide applicability to previous (e.g., SeaWiFS and MERIS) and current (e.g., MODIS, VIIRS, and OLCI) multispectral OC sensors and their merged products. In addition, as these approaches are usually trained to retrieve OC metrics and PFT information directly from the satellite spectral data, no prior knowledge of the phytoplankton biomass or inherent optical properties (IOPs) is required in its application. This makes the implementation of such approaches straightforward and practical for satellite OC products.
The EOF-based approach proposed by Xi et al. (2020) has been shown to provide reliable Chl-a retrievals of multiple PFTs on the global scale, through intercomparisons with other satellite-derived PFT and PSC products. However, PFT retrievals by Xi et al. (2020) showed rather low performance for prokaryotic phyto- plankton. Incorporation of additional environmental parameters which are globally available from satellite measurements, such as optical depth, sea surface temperature (SST), wind stress, and light availability, have the potential to improve PSC prediction accuracy. For instance, Brewin et al. (2015) investigated the influ- ence of light in the mixed layer on the parameters of the three-component PSC model (abundance-based model) of Brewin et al. (2010), and modified the model to better describe the relationship between phyto- plankton size structure and total chlorophyll with varying light conditions. Ward (2015) and Brewin, Ciavat- ta, et al. (2017) both incorporated temperature dependence into the three-component model and improved the model’s ability in representing Chl-a concentrations in all three PSCs using satellite estimates of SST and total Chl-a concentration. Moore and Brown (2020) assessed the impact of separately including SST and estimates of light level in the surface mixed-layer on the skill of abundance-based PSC models. Lange et al. (2020) also considered SST in their spectral-based algorithm using principal component regressions to estimate the surface abundance of picophytoplankton across the Atlantic Ocean.
There has been an emerging trend of the combined use of in situ data, satellite observations, ecosystem modeling (Losa et al., 2019), as well as PFT or PSC data assimilation (Pradhan et al., 2020; Xiao & Frie- drichs, 2014), to allow comprehensive monitoring and predictions of phytoplankton community structure.
Satellite-derived phytoplankton group-specific products are also expected to be useful for validation of eco- system model results (e.g., de Mora et al., 2016; Dutkiewicz et al., 2015; Hirata et al., 2013; Holt et al., 2014;
Pradhan et al., 2019; Ward et al., 2012). One major challenge of fulfilling these tasks is associating the uncertainty with the satellite-derived PFT products (Bracher et al., 2017). Uncertainty estimates have been well formulated and generated for other common OC algorithms that use satellite radiance and reflectance data to derive OC products such as Chl-a concentration, diffuse attenuation coefficient, and IOPs (McKin- na et al., 2019; Werdell et al., 2018). Though various approaches have been proposed to globally estimate satellite phytoplankton group products (Mouw et al., 2017), only the study by Brewin, Ciavatta, et al. (2017) has provided estimates of uncertainty on a per-pixel basis for the North Atlantic Ocean. Uncertainty assess- ment can be carried out via two methods: validation through comparison of the satellite retrievals with in
situ data (e.g., Antoine et al., 2008; Sathyendranath et al., 2019), or error propagation by accounting for the uncertainties in the inputs and model parameters. Due to the sparse distribution of in situ measurements that restricts validation for the uncertainty estimation (Mélin & Franz, 2014), error propagation analysis has now been widely used not only to un- derstand the sensitivity of model inputs and parameters to model out- puts, but also to estimate pixel-by-pixel uncertainty (e.g., Brewin, Til- stone, et al., 2017; Kostadinov et al., 2016; Lee et al., 2010; Maritorena et al., 2010; Qi et al., 2017).
In this study, we improve the previously developed EOF-based algorithm of Xi et al. (2020) for global retrievals of multiple PFT quantities by (1) including more matchup data between the in situ pigment data set and satellite Rrs data from merged OC products, (2) accounting for the SST in the retrieval scheme, and (3) investigating the influence of SST on the model parameters and retrieved PFTs with the goal of establishing a set of EOF-SST hybrid algorithms to improve the retrievals of TChl-a, Chl-a of six PFTs and the fractions of two prokaryotic phytoplankton. By apply- ing the hybrid algorithms to the merged OC products, we generate global distribution maps of the satellite-retrieved PFT quantities, and present a method to derive the per-pixel uncertainty propagated from both the inputs and retrieval model for each PFT quantity by combining Monte Carlo (MC) simulations and an analytical approach.
2. Data and Methods
2.1. Data Sets
2.1.1. In Situ Data Set of Phytoplankton Pigments and Data Screening
We updated the large global and open ocean (water depth >200 m) phytoplankton pigment data set (span- ning 2002–2012) from Losa et al. (2017) used in Xi et al. (2020) analyzed by High-Performance Liquid Chromatography (HPLC), by adding recently published HPLC pigment data (as of February 2020) from Sea- BASS, PANGAEA, British Oceanographic Data Centre (BODC), and Open Access to Ocean Data (AODN) from Australia (data sources in Table S1). All collected data were quality controlled following the method by Aiken et al. (2009); only pigment concentrations greater than the HPLC detection limit of 0.001 mg m−3 were included. In the database, all required pigments for the PFT Chl-a calculation were used (fucoxanthin, peridinin, 19′hexanoyloxy-fucoxanthin, 19′butanoyloxy-fucoxanthin, alloxanthin, total chlorophyll b, ze- axanthin, and divinyl chlorophyll a, reference to Section 2.1.3.1). While investigating the pigment data set, we found that data collected from the Palmer Long-Term Ecological Research (LTER, https://pal.lternet.
edu/) in the west of the Antarctic Peninsula showed very high zeaxanthin concentrations (up to 2.7 mg m−3) for multiple years during 2002–2012 compared to data from the other cold waters in the Southern Ocean.
We considered these distinct zeaxanthin measurements from Palmer LTER as nonrepresentative in the Southern Ocean and screened the pigment samples which had zeaxanthin concentration higher than the mean (0.013 mg m−3) of zeaxanthin concentration in the other waters in the Southern Ocean. Details of the data screening and supporting references and communications are provided in the supporting information (Text S1 and Figures S1–S3). A total of 8,840 sets of pigment data were finally used in this study and their distribution is shown in Figure 1.
2.1.2. Satellite Data
2.1.2.1. Satellite Ocean Color Products
GlobColour (http://www.globcolour.info/) has provided various OC products from different sensors, in- cluding SeaWiFS, MODIS-Aqua, MERIS, VIIRS-NPP, and Sentinel-3A OLCI. In this study, we used the Sea- WiFS-MODIS-MERIS merged normalized remote sensing reflectance (Rrs) Level-3 (L3) product (hereafter referred to as merged product) which covers the period from July 2002 to April 2012 from the GlobColour Figure 1. Distribution of total chlorophyll a concentration (TChl-a, the
sum of monovinyl chlorophyll a, divinyl chlorophyll a, chlorophyll a allomers, chlorophyll a epimers, and chlorophyllide a) from the quality- controlled in situ pigment database (2002–2012) used in this study (n = 8,840).
data archive (more details in ACRI-ST GlobColour Team et al. [2017]).
As in Xi et al. (2020), the daily merged product with 4-km resolution was used for matchup extraction and the monthly merged product with 25- km resolution was used for algorithm application. Since this study fo- cuses mainly on oceanic waters, shelf and coastal waters (<200 m) were masked out in the OC products following Hirata et al. (2011) using the ETOPO1 bathymetry (Amante & Eakins, 2009).
2.1.2.2. Sea Surface Temperature Data
The SST product used in this study was CMEMS OSTIA (Operational SST and Ice Analysis) reprocessed analysis product, which is quality-con- trolled and available on the CMEMS (Copernicus Marine Environment Monitoring Service, https://marine.copernicus.eu/) platform, referenced as SST_GLO_SST_L4_REP_OBSERVATIONS_010_011. The CMEMS OSTIA reprocessed analysis product is an interpolated product based on in situ measurements and satellite observations from both infra-red and microwave data on a global regular grid at 0.05° resolution (Donlon et al., 2012; Worsfold et al., 2020). The daily SST product from July 2002 to April 2012 was acquired and gridded to 4-km resolution. As for Rrs, monthly mean SST from 2002 to 2012 with 25-km resolution were also processed as input for deriving global satellite PFT products.
2.1.3. Input Data for PFT Retrieval Algorithm
2.1.3.1. In Situ PFT Chl-a and Fraction Derived From Diagnostic Pigment Analysis
As described in Xi et al. (2020), Chl-a of PFTs based on in situ pigment data were derived using an updated diagnostic pigment analysis (DPA) method (Losa et al., 2017; Soppa et al., 2014), that was originally devel- oped by Vidussi et al. (2001), adapted in Uitz et al. (2006) and further refined by Hirata et al. (2011) & Brew- in et al. (2015). We used pigment concentrations from the in situ database mentioned in Section 2.1.1 to derive the Chl-a of six PFTs—diatoms, dinoflagellates, haptophytes, green algae, prokaryotes, and Prochlo- rococcus, with fucoxanthin, peridinin, 19′hexanoyloxy-fucoxanthin, total chlorophyll b, zeaxanthin and di- vinyl chlorophyll a as their diagnostic pigment (DP), respectively. The partial coefficients of the DPs used in the updated DPA method were derived using a large global pigment data set as detailed in Table S1 in Losa et al. (2017), which were shown to be in good agreement with previous studies. We used these coeffi- cients rather than determining new ones because the majority (∼80%) of the in situ pigment data used in this study are a subset of the global data from 1988 to 2012 compiled in Losa et al. (2017). Due to the weak retrieval performance of prokaryote and Prochlorococcus Chl-a in Xi et al. (2020), in this study, we included the fractions of prokaryotes (f-prokaryotes) and Prochlorococcus (f-Prochlorococcus) to TChl-a, attempting to get improved retrievals of these two PFTs. PFT Chl-a lower than 0.005 mg m−3 were excluded due to high uncertainty (Xi et al., 2020) and the corresponding fractions of prokaryotes and Prochlorococcus were also excluded.
2.1.3.2. Matchups Between Satellite SST and In Situ PFT Data
SST matchups were extracted by matching data that were spatially colocalized and temporally (on a daily basis) coincident with the in situ PFT measurements. A 3×3 macro-pixel centered on the in situ measure- ment was considered. If the standard deviation compared to the mean value within this macro-pixel was lower than 25%, then the macro-pixel was considered suitable for the matchup. The arithmetic median of the macro-pixel was defined as the SST value for the in situ site.
2.1.3.3. Matchups of Rrs Merged Product to In Situ PFT and Satellite SST Data
Matchups of satellite Rrs to in situ PFT and satellite SST data were extracted from global 4-km daily merged products. The same extraction, averaging, and quality control protocol as followed in Xi et al. (2020) was used to derive matchups. As described in Xi et al. (2020), due to more matchup points and equivalent re- trieval performance compared to 3×3 matchups, single-pixel matchups were used as the input data for the final retrieval approach (Figure 2). Matchup data with the nine spectral bands of 412, 443, 490, 510, 531, Figure 2. Geographical locations of single-pixel matchups of GlobColour
merged Rrs at nine bands with in situ PFT and satellite SST data. PFT, phytoplankton functional type; SST, sea surface temperature.
547, 555, 670, and 678 nm from the merged products were chosen as the algorithm input data (Table 1). A total of 483 sets of matchup data cover- ing the global ocean were extracted (Figure 2).
2.2. Algorithm Retuning
The EOF-based PFT retrieval algorithm development and performance assessment were detailed in Xi et al. (2020). Using the updated matchup data, the Xi et al. (2020) algorithm was retuned and statistically assessed as detailed below. Figure 3 shows the scatterplots of the matchup data of SST to TChl-a, the six PFT Chl-a, and the two PFT fractions. Generally, TChl-a, Chl-a of diatoms, haptophytes, dinoflagellates, and green algae show a decrease with increasing SST. However, Prokaryote and Prochlo- rococcus Chl-a and their fractions show positive correlation with SST.
The statistically significant correlations indicate that introducing SST as an additional term into the Xi et al. (2020) algorithm (see Section 2.2.1) might improve the algorithm’s performance. With a 10-point running mean applied to the data, there is a noticeable shift in the trends of most PFT quantities as a function of SST at approximately 13 °C. This further led us to establish for SST < 13 °C a different EOF-SST hybrid algorithm than for SST ≥ 13 °C (see Section 2.2.2). Prochlorococcus data, as an exception from other PFTs, are rarely recorded in high latitudes with low temperature. Our final match- up data set compiled in Section 2.1.3.3 contained few (n = 2) divinyl chlorophyll a (a marker pigment of Prochlorococcus) measurements with low concentrations (0.001 mg m−3) when SST < 10 °C, which is in agreement with the observations by Flombaum et al. (2013). Therefore, we excluded the regions where SST is below 10 °C and did not consider a different EOF-SST hybrid algorithm with SST < 13 °C for the Chl-a and fraction retrievals of Prochlorococcus.
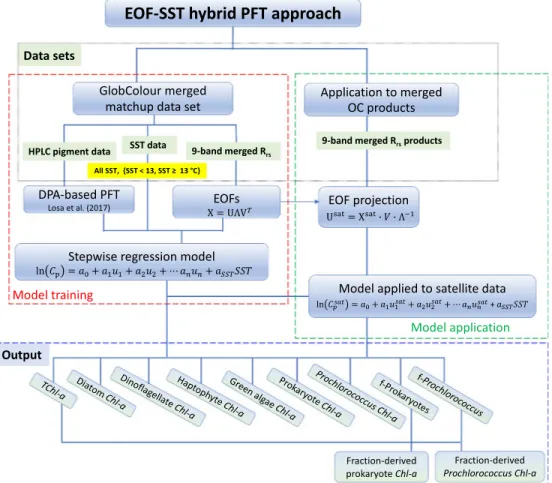
2.2.1. Adapted EOF-SST Hybrid PFT Algorithm Based on the Whole Data Set
The input data set used in the EOF-SST hybrid algorithm was the matchup data set that included the collo- cated nine-band Rrs from the merged products, satellite SST data, and in situ PFT data. Figure 4 depicts the flowchart of the EOF-SST hybrid algorithm, in which the EOF analysis remained unchanged by still using singular value decomposition (SVD) to decompose the (standardized) Rrs spectra into the EOF scores (U), singular values (Λ), and EOF loadings (V) as in Xi et al. (2020). Now, when formulating the regression mod- els of PFTs, we introduced SST as an additional term together with the column vectors u1,2,..,n in U. Similar to Xi et al. (2020), we applied a stepwise routine to obtain the smaller regression model by removing least significant variables in U through minimization of the Akaike information criterion (AIC). The adapted regression model is expressed as
p 0 1 1 2 2 ln C a a u a u a un n a SSTSST
(1) where a0 is the intercept, a1,2,…n, and aSST are the regression coefficients for the selected EOF scores and SST, respectively. With the adapted regression model, the same steps for cross-validation and model assessment of Xi et al. (2020) were carried out to test the robustness of the fitted model: the whole collocated data set was randomly split into two subsets—the first subset containing 80% of the data was used for model fitting/
training and the rest 20% was used for prediction. The procedure was run for 500 permutations to (1) record for each permutation the model parameters for further uncertainty assessment, and (2) generate a final statistical assessment based on the statistics of the model performance derived from each permutation.
For the model assessment, we considered the slope (S) and the intercept (a) of the generalized linear model (GLM) regression and coefficient of determination (R2), which were based on the log-scaled PFT predic- tions against the log-scaled in situ PFT data. We also considered the root-mean-square difference (RMSD), the median percent difference (MDPD), and the bias that were based on the non-log-transformed concen- tration data. These metrics were expressed as
Sensors
Center wavebands (nm)
412 443 490 510 531 547 555 670 678
SeaWiFS × × × × × ×
MODIS × × × × × × × ×
MERIS × × × × ×* ×
Note. *There was no band at 555 nm for MERIS itself, but the GlobColour Team provided for MERIS the 555 nm through an interspectral conversion made by using: Rrs (555) = Rrs (560) * (1.02542 − 0.03757 * y − 0.00171 * y2 + 0.0035 * y3 + 0.00057 * y4), where y = log10(CHL1) and CHL1 is the total Chl-a concentration estimated by OC4 (ACRI-ST GlobColour Team et al., 2017). With this conversion, Rrs at 555 nm for MERIS were also included in our study.
Table 1
List of the Nine Bands From Sensors SeaWiFS, MODIS, and MERIS Used in the GlobColour Merged Products
2
RMSD 1 ,
Ni Cpi Coi
(2)N
MDPD Median of pi oi 100 , 1,.... ,
oi
C C
i N
(3)C
1
bias 100 N pi oi ,
i oi
C C
N C
(4) Figure 3. Scatterplots of in situ TChl-a, PFT Chl-a, and fractions of prokaryotes and Prochlorococcus versus collocated satellite SST data. The correlation coefficient (R) was calculated based on the 10-point running mean (red curve). PFT, phytoplankton functional type; SST, sea surface temperature.
where N is the number of observations of PFTs (Co) and the corresponding predictions (Cp). Meanwhile, the cross-validation statistics (R2cv, RMSDcv, and MDPDcv), representing both the model robustness and compromised model performance, were also determined by taking the mean of the statistical parameters R2, RMSD, and MDPD from all permutations, respectively.
2.2.2. SST-Separated Hybrid PFT Algorithms
Given the difference in SST-PFT relationships between the two data sets (SST < 13 °C and SST ≥ 13 °C, Figure 3), for all PFT quantities (excluding Prochlorococcus Chl-a and f- Prochlorococcus), we separated the matchup data set at 13 °C as a divide and established two specific EOF-SST hybrid algorithms using the two data sets (referred to as SST-separated hybrid algorithms) following Section 2.2.1 (Figure 4). Note that the performance of the SST-separated hybrid algorithms was evaluated statistically based on all the predictions and in situ data to be consistent with that for the EOF-SST hybrid algorithm.
2.2.3. Application of Algorithms
The established algorithms were applied to the satellite Rrs data from the merged products (Section 2.1.2) to retrieve PFTs globally (Figure 4). By projecting the satellite Rrs data onto the EOF loadings (V), a new set of EOF scores (Usat) was derived and was then used for the global PFT prediction together with SST as an additional term in the fitted model in Equation 1, where a0 and a1,2,…n were obtained in the step of model training.
Figure 4. Flowchart illustrating the EOF-SST hybrid algorithm and the SST-separated hybrid algorithms for predicting TChl-a, Chl-a of six PFTs, and two fractions with GlobColour merged product. The red dashed-line box depicts the model training with the pigment-satellite matchup data; the green dashed-line box depicts the model application to satellite products and the blue dashed-line box shows model outputs (i.e., the predicted PFT quantities). EOF, empirical orthogonal function; PFT, phytoplankton functional type; SST, sea surface temperature.
As various categories of data sets were compiled in Section 2 for different analyses regarding PFT global retrieval algorithms and uncertainty assessment, Table 2 summarizes the details of the data sets compiled for this study. It should be noted that the numbers of the data points indicated in Table 2 are based on valid TChl-a data. This may be lower for specific PFT data sets (indicated in Figures 5 and 6 and Tables 4 and 5 in Section 3.1) as PFTs can be absent in some samples.
2.3. Uncertainty Assessment of PFT Retrieval
To quantify the uncertainty of the satellite PFT retrievals, we considered the uncertainties propagated from the input satellite Rrs (σRrs) and SST (σSST), and the uncertainty of the model/algorithm parameters (σa).
Other uncertainty sources exist, that is, in situ HPLC pigment measurement error and uncertainties in the DPA-derived PFT data resulting from incorrect assignment of PFTs from marker pigments. In the current study, we could not quantify the combined uncertainty from HPLC measurements and the DPA-derived PFTs due to limited information and therefore did not include this error source in the uncertainty assess- ment, although this error source should still be kept in mind even though they could not be quantified in this study. Detailed discussion regarding this aspect has been elaborated in Section 3.3.4 following the results of PFT uncertainty.
All computations of the uncertainties in this study were based on the logarithmic transformed data follow- ing conventional practice in the field of OC (Sathyendranath et al., 2020). However, we used natural loga- rithms instead of the common (base 10) logarithms, as our algorithm was developed based on the natural logarithms. For comparison with other studies, the common logarithmic uncertainty can be obtained by dividing our uncertainty by ln(10), that is, approximately a factor of 2.3. For brevity only the uncertainty derived based on the whole EOF-SST hybrid algorithm is presented as a general approach to quantify and consolidate the PFT uncertainty from different error sources.
2.3.1. Structure of the Uncertainty Propagation
With the EOF-SST hybrid retrieval models expressed in Equation 2, the retrieval model applied to the satel- lite data can be written in the following form:
,
,
ln
Psat o 1 1sat 2 2sat n nsat SSTy a u Rrs SST C a a u a u a u a SST
(5) where a represents all the model coefficients and u represents all the EOF score vectors derived from Rrs
data. Each u component can be expressed as:
sat
ui f Rrs
(6)
Type of data set Purpose of use Subsection Number
Data involved HPLC
pigments
TChl-a and DPA-derived
PFTs SST
Rrs at nine bands
In situ pigment database Original in situ database Section 2.1.3.1 8,840 ×
Collocated SST and PFTs PFT dependence on SST Section 2.1.3.2 8,840 × ×
Matchups of PFTs, SST, and Rrs EOF-SST hybrid algorithm Section 2.1.3.3 483 × × ×
Matchups of PFTs, SST, and Rrs SST-separated algorithm for waters with SST≥13 °C Section 2.2.1 368 × × × Matchups of PFTs, SST, and Rrs SST-separated algorithm for waters with SST<13 °C Section 2.2.2 115 × × ×
Training data set from matchups Monte Carlo simulations Section 2.3.2 242 × × ×
Test data set from matchups Uncertainty validation Section 2.3.3 241 × × ×
Table 2
Summary of Data Sets Included in Section 2 for Various Analyses/Usages
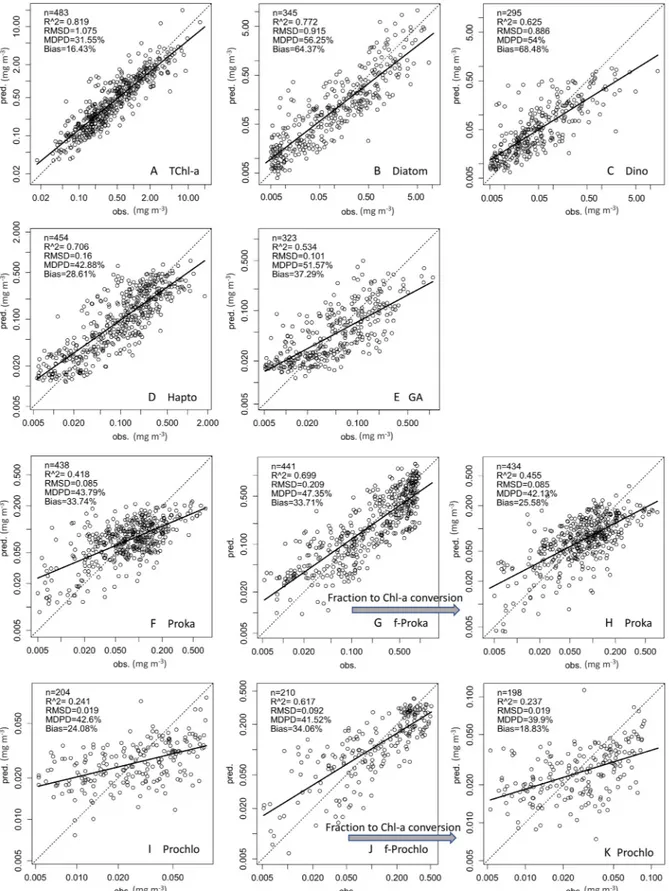
Figure 5. Regressions between observed (x-axis, obs.) and predicted (y-axis, pred.) PFT quantities using EOF-SST hybrid algorithm: (a) TChl-a, (b) diatoms, (c) dinoflagellates, (d) haptophytes, (e) green algae, (f) prokaryotes, (g) f-Prokaryotes, (h) fraction-derived prokaryote Chl-a, (i) Prochlorococcus, (j) f-Prochlorococcus, and (k) fraction-derived Prochlorococcus Chl-a. EOF, empirical orthogonal function; PFT, phytoplankton functional type; SST, sea surface temperature.
To estimate the final uncertainty of the retrieved PFTs, y, we assume that the uncertainties due to a, u, and SST in Equation 5 are not correlated with each other. According to the Guide to Uncertainty in Measurement (JCGM, 2008), the combined uncertainty of different sources could be estimated based on the law of propagation of uncertainty. Using the partial differences, the uncertainty of the PFT retrievals is presented theoretically as:
2 2 2
2 2 2 2 2 2
y y Rrs y a y SST iN1 i Rrsi in0 i ai SST.
y y y
Rrs a SST
(7) Figure 6. Combined regressions between observed (x-axis, obs.) and predicted (y-axis, pred.) PFT quantities from two sets of EOF-SST hybrid algorithms based on different SST ranges: (a) TChl-a; Chl-a of (b) diatoms, (c) dinoflagellates, (d) haptophytes, (e) green algae, and (f) prokaryotes; (g) f-Prokaryotes and (h) fraction-derived prokaryote Chl-a. The dotted black line shows the 1:1 line and the solid black line indicates the regression based on the whole data set. EOF, empirical orthogonal function; PFT, phytoplankton functional type; SST, sea surface temperature.
Since the uncertainties propagated from errors of model parameters (σy(a)) and SST (σy(SST)) are both linear, they can be analytically derived and expressed together as:
2 2
2 2 2 2 2 2
1 .
N sat
i a a sst SST
y a y SST i u i SST sst a
(8) where SST = 0.46 °C (Worsfold et al. [2020] for the OSTIA SST product); ai and aSST were determined during the cross-validation procedure as described in Section 2.2.1. To further illustrate how ai and aSST were determined, Figure S4 shows the distributions of the coefficients derived from all 500 permutations in the cross-validation, using diatoms as an example. As the coefficient distributions followed the normal distribution, the uncertainty of each coefficient was determined by calculating the corresponding standard deviation. The uncertainties of the model coefficients for all other PFT quantities were also determined in the same manner.
Since the fraction-derived prokaryotes and Prochlorococcus Chl-a were calculated by multiplying their frac- tions and the TChl-a together, the corresponding uncertainties were determined by the uncertainties of TChl-a and that of f-Prokaryotes (f-Prochlorococcus). Using yproka_conv, y1, and y2 to denote the fraction-de- rived prokaryote Chl-a, TChl-a, and f-Prokaryotes, the uncertainty of the fraction-derived prokaryote Chl-a,
yproka conv_ , can be determined by the uncertainty of TChl-a (y1) and f-Prokaryotes (y2) through the fol- lowing equation:
yproka conv_ y212y2 2 y1 y2r12,
(9) where r12 is the correlation coefficient between y1 and y2 (as both depend on SST-related uncertainties).
Equation 9 also applies for the uncertainty of the fraction-derived Prochlorococcus Chl-a.
Among all uncertainty components in Equation 7, the uncertainty propagated from errors in the satellite Rrs
spectra, y Rrs , is the challenging part to quantify, as it is nonlinear and not as straightforward as the other two uncertainty sources, due to the EOF analysis performed with the spectra. We therefore used an MC simulation-based approach to estimate the y Rrs as detailed in the following section.
2.3.2. Rrs Uncertainty Propagation
Based on the uncertainty of the water leaving radiance for SeaWiFS, MODIS-Aqua, and MERIS report- ed in Maritorena et al. (2010), Rrs absolute uncertainties for these sensors were derived and used in the GlobColour product. In our study, we took the root mean square (RMS) of the common bands from two or three sensors as the uncertainty of the merged products (Table 3). Using the matchup data for the merged products at nine bands, the following steps were carried out to fulfill the uncertainty propagation from Rrs to the PFTs.
Wavebands (nm) 412 443 490 510 531 547 555 670 678
MODIS σRrs 0.00071 0.00063 0.00049 – 0.00024 0.00019 – 0.000055 0.000030
MERIS σRrs 0.00066 0.00059 0.00047 0.00033 – – 0.00023 0.00010 0.000098
SeaWiFS σRrs 0.00072 0.00064 0.00050 0.00036 – – 0.00025 0.000075 –
RMS σRrs 0.00070 0.00062 0.00049 0.00035 0.00024 0.00019 0.00024 0.000080 0.000072 Note. The root mean square (RMS) was taken as the uncertainty of the merged products.
Table 3
Absolute Uncertainties of Rrs (σRrs, Sr−1) for Different Sensors in the Merged Products Derived Based on Maritorena et al. (2010)
1. The 483 Rrs matchup spectra were randomly divided equally into two data sets—50% as the training data set (in a total of 242), and the other 50% as the testing data set (in a total of 241). The corresponding matchups of in situ PFT and retrieved PFT data were also divided accordingly (Table 2).
2. For the training data sets, we performed 10,000 MC simulations to randomly introduce for each band the Rrs uncertainty (σRrs) to each spectrum in the training data set (in a total of 2,420,000 simulated spectra).
3. The MC simulated Rrs spectra were applied to the EOF-SST hybrid algorithm to estimate the PFTs with Rrs uncertainty taken into account. For each sample, 10,000 estimates of the PFT were generated from the 10,000 MC simulated Rrs, so that the uncertainty (standard deviation, σMC-PFT) of the PFTs were de- termined based on these 10,000 estimates for each sample.
4. When the σMC-PFT for all samples in the training data set were determined through Step 3, a look-up table (LUT) was built for each PFT by fitting σMC-PFT as a function of the retrieved PFT.
5. The LUT for each PFT was applied to the testing data set for the uncertainty validation, and also to the satellite PFT products to derive per-pixel uncertainty of the satellite PFT due to Rrs, y Rrs , which was combined with uncertainties from the other sources via Equation 7 to derive the final uncertainty of PFT satellite retrievals.
N MDPD (%) RMSD (mg m−3) R2 MDPDcv(%) RMSDcv (mg m−3) R2cv
EOF-SST hybrid model
TChl-a 483 31.55 1.08 0.82 31.51 1.14 0.81
Diatoms 345 56.25 0.92 0.77 57.71 0.98 0.76
Dinoflagellates 295 54.00 0.89 0.62 54.68 0.71 0.60
Haptophytes 454 42.88 0.16 0.71 43.63 0.17 0.69
Green algae 323 51.57 0.10 0.53 52.96 0.11 0.51
Prokaryotes 438 43.79 0.09 0.42 45.44 0.09 0.38
f-Prokaryotes 441 47.35 0.21a 0.70 47.72 0.21a 0.68
Fraction-derived prokaryotes 434 42.13 0.09 0.46
Prochlorococcus 204 42.60 0.02 0.24 44.97 0.02 0.17
f-Prochlorococcus 210 41.52 0.09a 0.62 43.99 0.09a 0.57
Fraction-derived Prochlorococcus 198 39.90 0.02 0.24
Original EOF-based algorithm
TChl-a 394 37.41 1.24 0.76 37.08 1.27 0.75
Diatoms 306 73.70 1.21 0.65 74.74 1.29 0.63
Dinoflagellates 272 55.32 0.93 0.62 57.29 0.72 0.59
Haptophytes 387 47.16 0.22 0.64 48.62 0.24 0.61
Green algae 262 55.81 0.11 0.51 56.26 0.11 0.48
Prokaryotes 367 53.70 0.13 0.15 55.08 0.13 0.11
Prochlorococcus 142 39.65 0.02 0.24 42.68 0.02 0.18
Note. N is the number of valid matchups for each parameter. Cross-validation was not applied for the fraction-derived prokaryotes and Prochlorococcus Chl-a because they are the results of the multiplication between their fractions and the TChl-a. As a comparison, the statistics of the previous EOF-based algorithm (without SST) by Xi et al. (2020) for the TChl-a and six PFT Chl-a are also presented (lower panel). Bold marks the improved (or same) statistics.
Abbreviations: EOF, empirical orthogonal function; MPDP, median percent difference; OC, ocean color; PFT, phytoplankton functional type; RMSD, root- mean-square difference; SST, sea surface temperature.
aThe unit (mg m−3) of RMSD does not apply to f-Prokaryotes and f-Prochlorococcus which have a range of 0–1.
Table 4
Statistics of Regression Models for TChl-a, Six PFT Chl-a, Fractions of Prokaryotes and Prochlorococcus and the Corresponding Fraction-Derived Chl-a Using SST and EOF Modes Based on the Nine-Band Rrs Matchups From Merged OC Products (Upper Panel)
2.3.3. Assessment of the Per-Pixel PFT Uncertainty
With the steps in Section 2.3.2, the uncertainty propagated from the Rrs to the satellite retrieved PFTs (the term 2y Rrs in Equation 7) was determined by applying the LUT to each pixel of the satellite-derived PFT products. Together with the other two terms, 2y a and 2y SST which were calculated analytically through Equation 8, the combined PFT uncertainty y of each pixel from different sources was ultimately obtained.
3. Results and Discussion
3.1. EOF-SST Hybrid Algorithms for PFT Retrievals
3.1.1. EOF-SST Hybrid Algorithm Based on the Whole Matchup Data Set
Before setting up the EOF-SST algorithm, we first updated the original SST-independent EOF-based algo- rithm of Xi et al. (2020) using the larger input data set used in this study. The performance of the updated algorithm showed nearly identical performance as compared to the original one presented in Xi et al. (2020) (details not shown), suggesting that the original algorithm can be hardly improved by purely enlarging the training data set. We then applied the EOF-SST hybrid algorithm developed in the current study to derive the TChl-a, PFT Chl-a, and the fractions of two PFTs based on the regression models built using the EOF scores derived from the nine-band Rrs data, SST, and the in situ PFT data. As presented in Table 4 and Fig- ures 5a–5f and 5h, compared to the original algorithm in Xi et al. (2020), the EOF-SST hybrid algorithm shows significant improvements for all predicted quantities except for Prochlorococcus where weak per- formance still remains. For TChl-a and Chl-a of diatoms, haptophytes, dinoflagellates, and green algae, R2 increased from a range of 0.51–0.76 to a range of 0.53–0.82 and R2cv increased from a range of 0.48–0.75 to a range of 0.51–0.81. MDPD reduced from its range in Xi et al. (2020) of 37%–74% to a range of 32%–56%, while MDPDcv reduced from 37%–75% to a range of 32%–58%. RMSD and RMSDcv values are also signifi- cantly lower in the EOF-SST hybrid algorithm compared to the previous results.
To further improve the prediction of prokaryote and Prochlorococcus Chl-a, the hybrid algorithm was also trained to retrieve the fractions of prokaryotes and Prochlorococcus to TChl-a. This was motivated because prokaryotes dominate in low TChl-a midlatitude to low-latitude waters, so generally their Chl-a is low. By using their fraction instead of Chl-a, a better spread of the data is achieved that enhances the signal to be retrieved which is beneficial for application in abundance-based PSC retrievals (e.g., Brewin et al., 2010). As expected, the prediction models for the two fractions performed well with R2 > 0.62 and MDPD within 47%
(Table 4). Though the overall performance of the fraction retrieval for the two PFTs had been improved, the regression between the predicted and observed f-Prochlorococcus (Figure 5j) show that higher discrepancies exist in low fraction values, indicating that it is still difficult to accurately derive Prochlorococcus Chl-a from the fraction when f-Prochlorococcus < 0.2. Using predicted TChl-a, the fractions were further converted to Chl-a for the two PFTs. Table 4 shows that the fraction-derived prokaryote Chl-a retrieval displays im- proved performance compared to the directly retrieved prokaryotes (R2 of 0.46 vs. 0.42, MDPD of 42% vs.
44%, and with equivalent RMSD of 0.08 mg m−3), but is downgraded compared to the f-Prokaryotes (Fig- ure 5g). The fraction to Chl-a conversion scheme shows little improvement in predicting Prochlorococcus Chl-a (Table 4 and Figure 5k vs. Figure 5i). Though f-Prochlorococcus is overall better predicted compared to the direct retrieval of Prochlorococcus Chl-a, by using the conversion, R2, and RMSD of the fraction-derived Prochlorococcus Chl-a estimation deteriorate due to the low signal-to-noise ratio in the retrieved TChl-a and f-Prochlorococcus. The MDPD and bias are however slightly improved. Weak prediction performance of the fraction-derived Prochlorococcus Chl-a reveals that it is still challenging to enhance their retrieval accuracy to the same level as other PFTs due to the low concentrations and small variability (Xi et al., 2020).
3.1.2. SST-Separated Hybrid Algorithms for Different SST Regimes
As described in Section 2.2.2, SST-separated hybrid algorithms were developed to retrieve the PFT quanti- ties respectively for the two temperature regimes. Table S2 summarizes the coefficients fitted in the stepwise regression models based on the whole data set, data set with SST ≥ 13 °C, and data set with SST < 13 °C, respectively. EOF modes chosen for different PFTs vary with different data sets, such that SST as an addi- tional regression term may not always been used in the final prediction models due to different levels of
correlation with PFTs in different SST regimes. The SST term had been identified as insignificant within the stepwise minimization method rou- tine performed in the model regression procedure if the contribution of SST to the PFT estimation was neglectable. Moreover, the weighting coef- ficient fitted on the SST term changed when different data sets were used.
For instance, aSST fitted in the prediction models for prokaryote Chl-a us- ing the whole data set was 0.088, and increased to 0.117 for the data set with SST < 13 °C, but was not used in the prediction model for the data set with SST ≥ 13 °C which is also consistent with the SST-PFT relation- ship (Figure 3). The 10-point running mean trend showed that SST had a distinct positive correlation with the prokaryote Chl-a but the correlation turned insignificant when SST was higher than 13 °C.
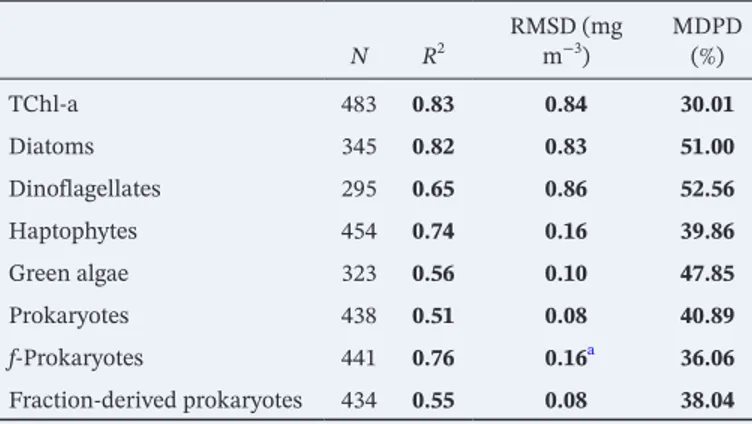
Table 5 shows the combined statistics of the regression models from SST-separated hybrid algorithms for the two temperature regimes, while Table S3 displays separately the statistics for the two regimes. Generally, Table S3 shows that TChl-a and the eukaryotic PFT Chl-a are better re- trieved for the data set with SST ≥ 13 °C though RMSD is higher simply because their Chl-a spanned a wider range than in cold waters (Figure 6).
In contrast, both direct and fraction-derived prokaryote Chl-a retrievals show significantly improved performance for the data set with SST <
13 °C, suggesting that better estimations for prokaryotes can be achieved by considering the strong correlation between prokaryote Chl-a and SST in cold waters. For a global PFT retrieval scheme in this study, we focused more on the combined statistics and the overall performance of the SST-separated hybrid algorithms. As shown in Table 5 and Figure 6, the improvement for TChl-a estimated from the SST-separated algorithms is rather small, indicating that responses in the TChl-a concentration to different SST regimes are relatively stable. For predictions of Chl-a of all PFTs, except Prochlorococcus for which the separation of SST does not apply, the SST-separated algorithms perform considerably better, indicated by improved statistics in terms of R2, RMSD, and MDPD (Table 5). Prokaryotes, both in terms of Chl-a and fraction, show the most promising improvement compared to that from the non-separated EOF-SST hybrid algorithm. With good performances in retrieving the f-prokaryotes and TChl-a, the prokaryote Chl-a is more accurately derived by converting the fraction to concentrations (Figure 6h) compared to the directly retrieved prokaryote Chl-a (Figure 6f), with an increase of R2 from 0.51 to 0.55 and reduced MDPD from 40.89% to 38.04%. Though prokaryotes retrieval is still not as good as the other PFTs such as diatoms and haptophytes, it is equivalent to the green algae retrieval with even lower MDPD. Compared to the prokaryote retrieval in Xi et al. (2020), this result is a significant improvement after a series of experiments by including SST in the retrieval model, establishing separated models based on SST regimes, and retrieving first the fraction and performing the conversion.
Our global in situ PFT data with SST around the threshold 13 °C located roughly between 35 and 45°N or
°S, correspond well to the findings of Ward (2015): Their SST-dependent PSC models show a general decline in picophytoplankton biomass polewards of 40°N or °S, contrary to the overall trends for TChl-a, microphy- toplankton, and nanophytoplankton biomass. Our Figure 3 shows the same declining trend for prokaryote (picophytoplankton) Chl-a in high latitude waters with SST < 13 °C, while Chl-a of diatoms, dinoflagellates (corresponding to microphytoplankton), and haptophytes (corresponding to nanophytoplankton) in cold waters are generally higher than in waters of SST ≥ 13 °C. Similarly, Brewin, Ciavatta, et al. (2017) chose a relatively higher SST value (15 °C) to partition their data set into two subsets with roughly equal numbers in the North Atlantic Ocean, and also found significantly different model parameters for high and low tem- peratures. Coincidentally, Moore & Brown (2020) analyzed the trends in parameters of PSC fraction models for the whole Atlantic Ocean, and found that the different model parameter changes occurred in the SST ranges of 5 °C–15 °C, 15 °C–25 °C, and > 25 °C, respectively. All these similar behaviors in models incor- porating SST for PFT or PSC estimations suggest ecological connections. Mouw et al. (2019) have investi- gated the ecological drivers for phytoplankton size distribution. Among the nine considered environmental parameters (e.g., eutrophic depth, TChl-a, SST, mixed layer depth, etc.), they found that the euphotic depth
N R2 RMSD (mg
m−3) MDPD
(%)
TChl-a 483 0.83 0.84 30.01
Diatoms 345 0.82 0.83 51.00
Dinoflagellates 295 0.65 0.86 52.56
Haptophytes 454 0.74 0.16 39.86
Green algae 323 0.56 0.10 47.85
Prokaryotes 438 0.51 0.08 40.89
f-Prokaryotes 441 0.76 0.16a 36.06
Fraction-derived prokaryotes 434 0.55 0.08 38.04 Note. Improved (or same) parameters are marked as bold, by comparing to those from the hybrid algorithm without separating SST (Table 3).
Abbreviations: MPDP, median percent difference; RMSD, root-mean- square difference; SST, sea surface temperature.
aNote that the unit (mg m−3) of RMSD does not apply to f-Prokaryotes.
Table 5
Combined Statistics of the Regression Models From the SST-Separated Hybrid Algorithms for Matchup Data With SST ≥13 °C and With SST <13 °C
is the most important parameter driving the variability of percent microphytoplankton (Sfm) on a global scale, covering the central gyres and the majority of the high-latitude ocean. However, in other regions, Sfm distribution is driven by a balance of light and mode of nutrient delivery. In summary, SST and other environmental parameters always covary with each other and have compound effect on PFT abundance and variability, and different PFTs behave differently both in time and space. Though it is still challenging to clearly explain the ecological connections behind these phenomena, a number of indications provided by the studies above lead to some potential directions to be investigated in future.
3.2. Global Maps of PFT Quantities From Merged Rrs Products
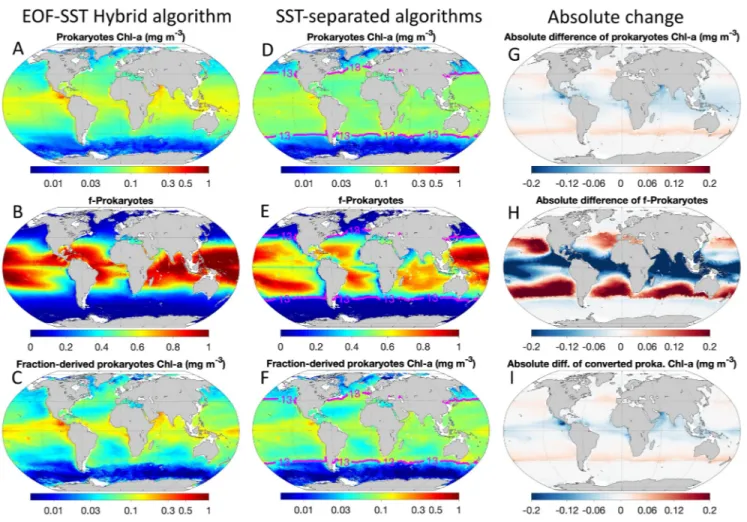
The improved EOF-SST hybrid algorithms from both Sections 3.1.1 and 3.1.2 were applied to the merged Rrs products and SST data to derive the global TChl-a, PFT Chl-a, and the fractions (see Figure 4, part model application). To illustrate the global distribution of the PFTs, Figures 7 and 8 show the annual mean generated from the derived monthly PFT quantities (except Prochlorococcus) for the year 2011 using the EOF-SST hybrid algorithm (established in Section 2.2.1) and the SST-separated algorithms (established in Section 2.2.2), respectively, with the absolute difference between the two products. Since Prochlorococcus barely exist at cold temperatures (see Section 2.2), global maps of Prochlorococcus Chl-a and f-Prochlorococ- cus are generated only for regions with SST ≥ 10 °C (Figure 9).
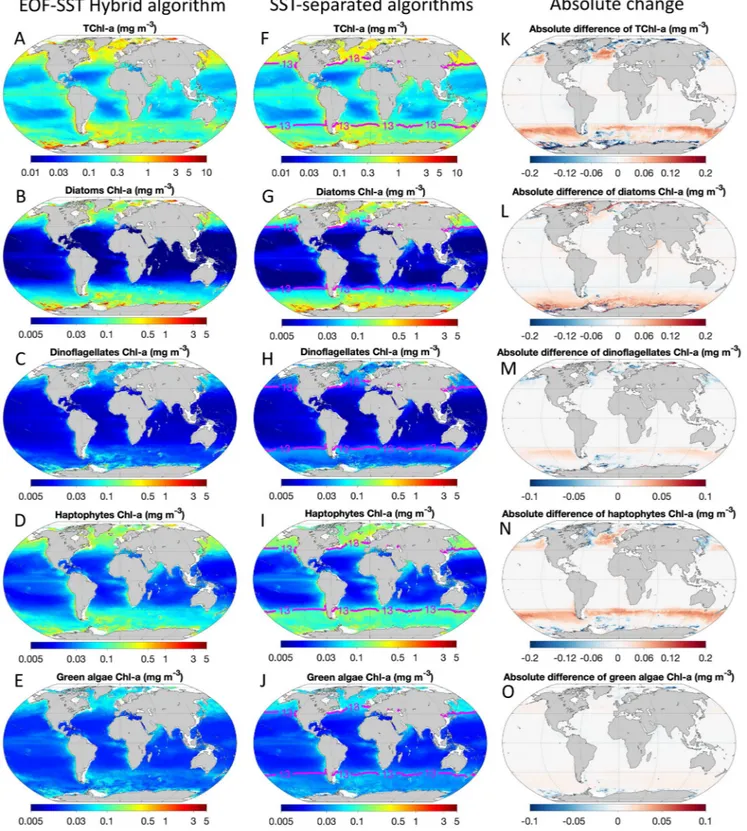
In general, distribution patterns of the retrieved TChl-a and the four eukaryotic PFTs from the EOF-SST hy- brid algorithm are consistent with those from the combination of the SST-separated algorithms (Figure 7).
However, distinct differences between the retrievals from the two approaches are found in latitudes higher than 40°N/S (Figures 7k–7o). Compared to TChl-a derived from the EOF-SST hybrid algorithm (Figure 7a), TChl-a derived from SST-separated algorithms (Figure 7f) are elevated in the North Pacific and Atlantic Oceans, as well as in most regions between 40°S and 60°S of the Southern Ocean, while decreased in most of the high latitude marginal seas and in the Arctic except for the Barents Sea (Figure 7k). Diatom Chl-a from the SST-separated approach is enhanced in high latitudes and coastal waters (Figure 7g vs. Figure 7b).
Haptophyte Chl-a is enhanced mostly in the moderately high latitudes (e.g., 45°S–60°S near-polar fronts) and decreased in very high latitudes and marginal seas using the SST-separated algorithms (Figure 7n).
Changes in Chl-a for dinoflagellates and green algae generally follow the changes in haptophyte Chl-a but are much milder (Figures 7m and 7o). Compared to the retrievals of Xi et al. (2020), satellite-derived PFTs from the SST-separated algorithms are in better agreement with the equivalent products from other global studies (e.g., Brewin et al., 2015; Hirata et al., 2011; Losa et al., 2017).
The retrievals of prokaryote Chl-a, f-prokaryotes and the fraction-derived prokaryote Chl-a using SST-sep- arated algorithms present generally lower values globally except in the regions around 20°S–40°S in the southern hemisphere, 20°N–40°N in the north Pacific Ocean and between 30°N and 45°N in the north Atlantic Ocean (Figures 8g–8i). The fraction-derived Chl-a shows more reasonable global distribution (Fig- ures 8c and 8f) compared to the direct retrievals (Figures 8a and 8d), given the improved performance via fraction conversion for prokaryotes in Section 3.1. The EOF-SST hybrid algorithm derived f-prokaryotes is saturated (up to 1) in the gyres or their adjacent regions (Figure 8b). This saturation is remarkably reduced by the SST-separated algorithms (Figure 8e) thanks to the better description of the prokaryotes’ dependency on the temperature in the algorithm, resulting in that fraction-derived prokaryote Chl-a from SST-separated algorithms (Figure 8f) has the most reliable retrieval quality among all prokaryote Chl-a retrievals shown in Figure 8. Compared to the prokaryote retrieval in Xi et al. (2020), where the original EOF-based algorithm overestimates the prokaryote Chl-a dramatically, the fraction-derived prokaryote Chl-a in this study shows better agreements with previous studies (Hirata et al., 2011; Losa et al., 2017) but is relatively lower in the polar regions.
Regarding Prochlorococcus, although the fraction-derived Chl-a showed no distinct improvement in model performance compared to the direct Chl-a retrieval (Section 3.1.1), the global retrieval depicts an overall de- crease in the fraction-derived Chl-a (Figure 9c) compared to the direct retrieval (Figure 9a), and is in closer agreement with in situ observations and other satellite retrievals (Alvain et al., 2008; Hirata et al., 2011).
The conversion to Chl-a is restricted by the high uncertainty at low TChl-a and also the low variability of Prochlorococcus Chl-a (Xi et al., 2020).
Figure 7. Satellite-derived estimates of annual (2011) mean surface TChl-a, Chl-a of diatoms, dinoflagellates, haptophytes, and green algae. Panels (a–e):
EOF-SST hybrid algorithm with non-separated SST. Panels (f–j): Combined estimates from SST-separated hybrid algorithms for SST ≥ 13 °C and SST < 13 °C, respectively. The magenta curve indicates the isotherm of 13 °C. Panels (k–o): Absolute difference between the combined estimates from SST-separated algorithms and that from EOF-SST hybrid algorithm, that is, panels (f–j) minus panels (a–e). EOF, empirical orthogonal function; PFT, phytoplankton functional type; SST, sea surface temperature.
The general geographic patterns of Chl-a for the six PFTs, using the algorithms proposed in this study, are consistent with current knowledge (e.g., Bracher et al., 2020; Brewin et al., 2015; Hirata et al., 2011; Losa et al., 2017). It also indicates that spectral-based approaches have the capability to derive PFT information equivalently to or better than abundance-based approaches. Though TChl-a has been considered as an ef- fective first-order predictor of absorption spectra (Cael et al., 2020), PFTs that have different assemblages of accessory pigments, in addition to chlorophyll a, are extractable from spectral measurements with the aid of environmental parameters. The improvements obtained in our study also agree well with previous studies that incorporated SST to their PSC models. Ward (2015) reported increases of microphytoplankton and na- nophytoplankton Chl-a and decreases of picophytoplankton Chl-a in cold polar regions using the temper- ature-dependent functions compared to the temperature-independent functions. Moore & Brown (2020), Figure 8. Same as in Figure 7 but for annual (2011) mean surface Chl-a of prokaryotes, f-Prokaryotes, and the fraction-derived prokaryote Chl-a.
Figure 9. Satellite-derived estimates of annual (2011) mean surface (a) Chl-a of Prochlorococcus, (b) f-Prochlorococcus, and (c) fraction-derived Prochlorococcus Chl-a using the EOF-SST hybrid algorithm.
though only focused on the temperate to tropical zones of the Atlantic Ocean, noted that picophytoplankton abundance estimated by the SST-included models was lower in the gyres and temperate zones and higher in equatorial region than that from the baseline model without SST incorporation. These changes are also observed in the PFTs retrieved by our EOF-SST hybrid algorithms. For instance, compared to our original algorithm in Xi et al. (2020), the EOF-SST hybrid algorithms show much more realistic distributions: they generate higher Chl-a in polar waters and lower Chl-a in midlatitude to low-latitude for diatoms and hapto- phytes; much lower prokaryote Chl-a in polar waters and gyres, and higher prokaryote Chl-a in equatorial region. The prokaryotic phytoplankton distributions particularly show more contrasting patterns between gyre and non-gyre regions. Our improved retrievals show higher TChl-a in the Southern Ocean where sat- ellite derivations from conventional algorithms are often underestimated (e.g., Johnson et al., 2013; Soppa et al., 2014). PFT quantities are better retrieved by the SST-separated algorithms which account for the effect of SST more accurately in the statistical models by separating cold and warm waters than the hybrid algorithm, suggesting that subtle model configurations of such environmental parameters help to describe phytoplankton community variability more precisely. Nevertheless, validation with in situ pigment and/or PFT data is always favorable when more measurements are available.
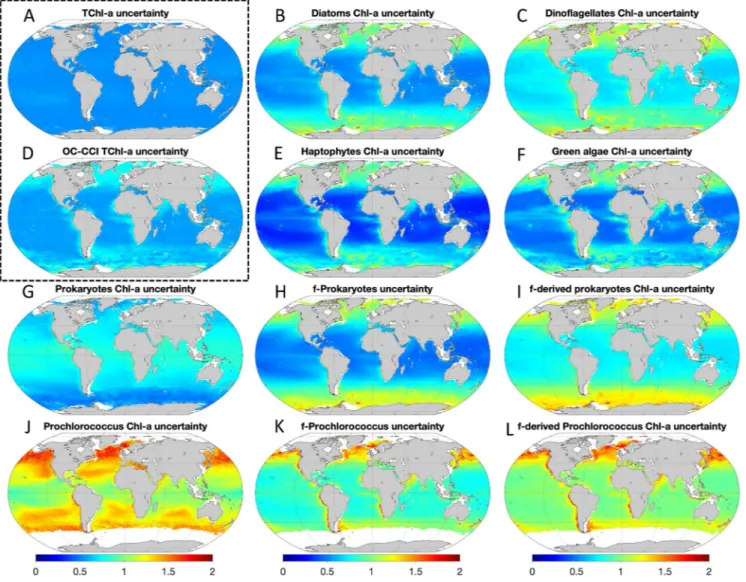
3.3. PFT Uncertainty
3.3.1. Look-up Table for Uncertainty due to Rrs
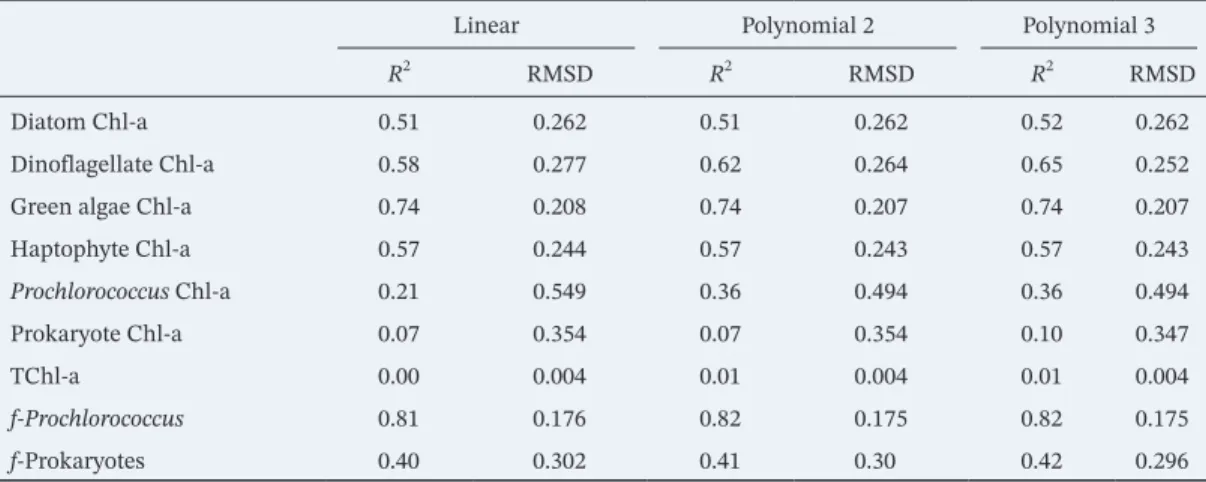
Following the steps listed in Section. 2.3.2 to build the LUT for quantifying PFT uncertainty propagated from Rrs uncertainty, Figure 10 and Table 6 show the regressions and the statistical results of σMC-PFT against the originally predicted PFT quantities. Higher R2 and lower RMSD are achieved in general when higher degree of polynomial is used (Table 6). However, the difference between different regressions is rather small except for dinoflagellates, which is caused by their few data points at higher concentrations with corresponding lower MC-derived uncertainties (Figure 10c). Distinct differences between polynomial re- gressions also exist in those PFTs whose correlations to σMC-PFT are weak (e.g., Figures 10a, 10f and 10g). To be conservative, linear regressions were taken as the final LUT functions to determine y Rrs .
It is noted that y Rrs can not always be well defined by fitting a linear function. For example, the uncer- tainty from MC simulation for TChl-a shows little variation (0.495–0.525) (Figure 10a), indicating that the uncertainty is not dependent on TChl-a and does not change much with TChl-a (R2 = 0). Uncertainties as- sociated with prokaryotic phytoplankton (prokaryotes and Prochlorococcus) Chl-a are not well correlated to their retrievals either (R2 < 0.21). The uncertainties of their fractions are however highly dependent on the fraction retrievals with an inverse correlation (R2 > 0.40); the retrieval of higher fractions thus bears lower uncertainty. The derived regressions imply that the LUTs quantify well the PFT uncertainty propagated from Rrs uncertainty for the non-prokaryotic PFT Chl-a and the fractions of the prokaryotic phytoplankton but not for the prokaryotic Chl-a. TChl-a uncertainty is relatively stable and not related to the retrieved TChl-a.
3.3.2. Validation of PFT Uncertainty
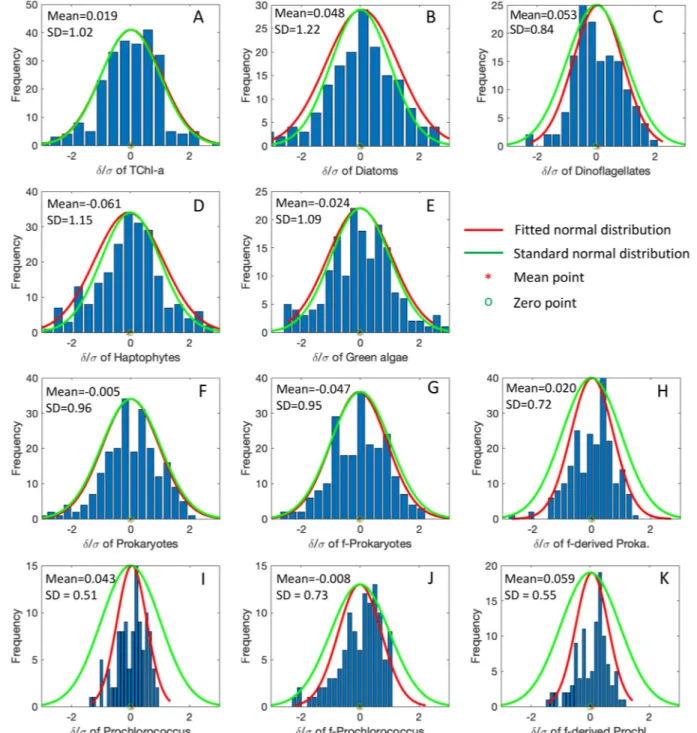
The linear LUTs were applied to the retrieved PFT quantities in the testing data set to determine the cor- responding y Rrs . The final consolidated uncertainties of the retrieved PFTs from the testing data set, y, were then estimated using Equation 5. With matchup data from the testing data set (Step 1 of Section 2.3.2), it is possible to assess whether or not the estimated uncertainties for the PFT products are accurate by comparing them to the actual error, δy, defined as δy = ln(cp)−ln(co). If the uncertainty y is truly represent- ative of its standard deviation and thus is reliable, the distribution of the actual errors normalized by the estimated errors δy/σy should, to some extent, follow a standard centered normal distribution (Maritorena et al., 2010). Therefore, to validate the estimated PFT uncertainty y, the testing data set was compared to the corresponding δy. Note that σy and δy are both natural-logarithmic based.
Figure 11 shows the histograms of δy/σy distribution derived from the testing data set for all PFT quantities.
The corresponding normal distributions determined by the mean and SD are also displayed in comparison with the centered standard normal distribution. For the majority of PFT quantities, the δy/σy distribution coincides well with the standard normal distribution, with mean values close to zero and the SD vary-
ing from 0.84 to 1.22. Diatoms, haptophytes, and green algae present slightly lower modeled uncertainty compared to the actual errors (SD > 1.09). Relatively lower SD (<0.8) are found for Prochlorococcus Chl-a and fraction, and the fraction-derived Chl-a both for prokaryotes and Prochlorococcus. The fraction-derived prokaryote Chl-a presents higher modeled uncertainty (i.e., lower SD of δPFT/σPFT in Figure 11h) compared to the direct retrieval of prokaryote Chl-a (Figure 11f), even though the former shows better prediction performance (Table 3). This result suggests the possible underestimation of the actual errors in the direct retrieval for prokaryotes. Prochlorococcus Chl-a and fraction show overall higher modeled uncertainties compared to the actual error (SD ≤ 0.73, Figures 11i–11k). However, a skewed distribution of δy/σy is found for the direct retrieval of Prochlorococcus Chl-a and f-Prochlorococcus (Figures 11i and 11j) whereas the fraction-derived Chl-a shows milder skewness in their δy/σy (Figure 11k). This result suggests the modeled uncertainty is better described for the fraction-derived Prochlorococcus Chl-a than the direct Chl-a retriev- als. The validation of the PFT uncertainty indicates that our modeled uncertainty is in general close to the Figure 10. Scatterplots of σPFT based on the MC simulations versus originally retrieved (natural-logarithmic based) PFTs. Regression lines of linear (red), polynomial fittings with degrees of 2 (green) and 3 (blue) are also shown. MC, Monte Carlo; PFT, phytoplankton functional type.