II. AMPLIFIER N SIMULATION
The noise factor F of a two port network is described by [6]
Noise-Bandwidth Tradeoff in the Design of the Pixel Preamplifiers for the M AGIC II Telescope
Camera
P. Antoranz1, M. V. Fonseca2, M. Asensio2, J. A. Barrio2, M. Camara2, J. L. Contreras2, R. de los Reyes2, M. Lopez2, J. M. Miranda1, I. Oya2, for the MAGIC collaboration3
Abstract—MAGIC II camera demands preamplifiers for their pixels with bandwidths close to 1 GHz in order to avoid noticeable distortion and delay of the 1 ns pulses supplied by the photodetectors. This specification largely overcomes the one fulfilled by the preamplifiers of MAGIC I camera, which have bandwidths close to 300 MHz. The increase of the bandwidth in the preamplifier design is usually accomplished by reducing the sensitivity, since the dominant noise source coming out the photodetector is white. A Monte Carlo based simulation has been performed to estimate the optimum specifications for the preamplifier noise figure. This simulation makes use of real input pulses and the measured scattering parameters of the preamplifier to build up a time domain representation of the output pulse polluted with the noise contributions coming from both the input signal and the preamplifier noise. As a result, an accurate representation of the pulse distortion and noise degradation is obtained. It is confirmed that the optimum noise figure is strongly dependent on the expected peak voltage levels of the input signal, as well as on the amount of tolerable pulse distortion.
Index Terms—Amplifier noise, Lossy circuits, Simulation software, Stability
I. INTRODUCTION
HE first MAGIC telescope was built with the aim of detecting High Energy (HE) and Very High Energy (VHE) gamma-rays (E>30 GeV) from astrophysical sources [1], [2]. It was inaugurated on October 2003, and after the completion of its commissioning phase, regular observations started on September 2004. MAGIC I capabilities have recently been demonstrated with the detection of different sources [3], [4], and the construction of a second telescope at the ORM site is presently in progress. MAGIC II will be an
improved clone of the first telescope and will allow the stereoscopic reconstruction of the air showers, providing important improvements in terms of flux sensitivity, energy reconstruction and angular resolution [5].
1 Dpto. Física Aplicada III, Universidad Complutense de Madrid, Av.
Complutense s/n 28020 Madrid, SPAIN (e-mail: antoranz@gae.ucm.es).
2 Dpto. Física Atómica, Molecular y Nuclear, Universidad Complutense de Madrid, Av. Complutense s/n 28020 Madrid, SPAIN.
3 Full list of authors is at http://magic.mppmu.mpg.de
One of the major issues to be addressed in the design of MAGIC II camera is to achieve a significant increase of the detection bandwidth without a severe loss of sensitivity. In order to accurately identify an optimum noise-bandwidth tradeoff, a software tool has been developed. It exploits MATLAB environment and makes use of the Monte Carlo simulation to provide a full description of the detected pulse signals polluted with noise. This work illustrates how this tool was used to design a preamplifier stage for the photodetectors of the camera.
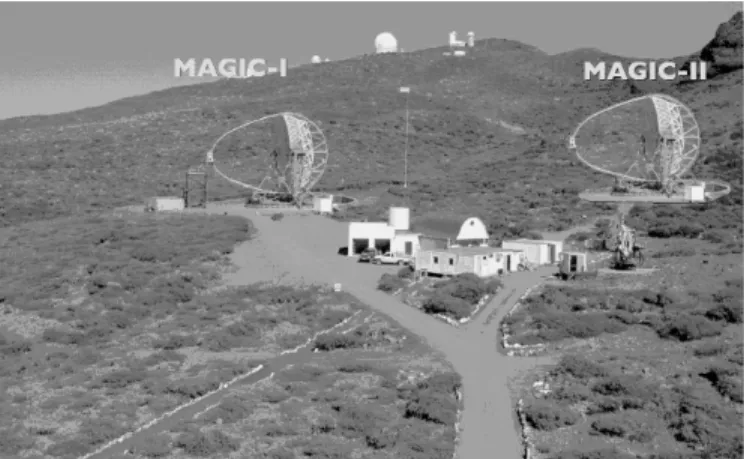
Fig 1. Location of MAGIC I and II Telescopes. In the center of the picture can be seen the Counting House, from where the Telescopes are controlled.
OISE
( )
ii a i a i
i i o
o i i
GN GN N N
S N
S +
GN N GS N
F S =
= +
= (1)
T
where S / N , So / No are the input and output signal to noise
the te
T
Te (2)
he standard deviation of the probability density function of
i i
ratios, respectively, and G the network power gain. F is usually called “noise figure” (NF) when expressed in dB.
The equivalent noise temperature, Te represents mperature at the input of the network that would generate a noise equivalent to the one generated by the amplifier
(
1)
0 −
= F T
the voltage noise generated by the amplifier is given by:
2 BG kTe
σ = (3)
he simulation of the output signal polluted by the am
tors m
noise pulse preamplifiers have been de
e tested prototypes are based on Microwave Monolithic
vices are Infineon BGA616 and A
f devices like BGA616 allows the ca
lse no
Fig Dependence of the pulse noise with the bandwidth. Straight line: input
ig. 3 shows the dependence of the output pulse noise with th
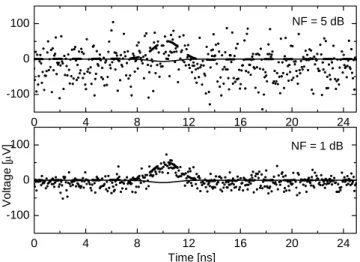
Fig Dependence of the pulse noise with amplifier’s noise figure. Straight
III. EFFECTS OF A DISSIPATIVE PAD BETWEEN THE
Photodetectors usually have internal impedances which lead T
plifier noise has been made by means of the Monte Carlo method, where the key input data are the noise factor and the scattering (S) parameters of the amplifier. These data are usually provided by the manufacturers of the active devices [7], [8], or can easily be measured in a laboratory with a microwave noise meter and a vectorial network analyzer.
The design of a suitable preamplifier for the photodetec ust take into account other parameters (stability, reflection losses, pulse ringing, etc.) to achieve a feasible prototype.
Therefore, the simulation has been integrated in a general purpose software tool which provides a full description of the output signals [9].
Integrated low
signed for the photodetectors. The influence of the bandwidth on the sensitivity has been investigated by applying filters to the amplifier transducer gain, whereas the influence of the noise factor was studied by changing the corresponding σ.
Th
Integrated Circuit Amplifiers (MMIC). This devices present optimum characteristics for the amplification of nanosecond- range, weak pulses: 50 Ω broadband matching and low noise figure from DC to 2-3 GHz. Therefore, bandwidths up to 2 GHz are possible without a remarkable increase of the overall noise. The reduced size of MMICs simplifies their integration into the boards next to the photodetectors inside the camera, thus avoiding the delay, attenuation and distortion produced by cables and connectors.
Some of the tested de
gilent MSA0886. The BGA616 presents a gain of 17 dB at 1 GHz, and a 3 dB bandwidth of 2 GHz, while the NF is below 3 dB from DC to well above 2 GHz. It is, in addition, unconditionally stable. The gain of the MSA0886 is 26 dB for low frequencies and the 3 dB bandwidth is 400 MHz. The MSA0886 also presents a slightly higher noise than the BGA616 (about 3.5 dB).
The low noise figure o
scaded configuration of two amplifiers, thus increasing
considerably the gain but still maintaining high sensitivity.
Fig. 2 shows the dependence of the amplifier output pu ise with the bandwidth. An ideal filter with the specified bandwidth has been used in the simulations. High bandwidth increases the system noise, while low bandwidth can distort the pulse shape. In the simulations, a NF of 3 dB has been used for the amplifier.
0 4 8 12 16 20 24
-100 0 0
. 2.
signal. Dashed line: ideal output signal for a noiseless amplifier. Circles:
simulated output for a noisy amplifier (BGA616), for a given bandwidth.
F
e NF of the amplifier. This factor is assumed to be variable while the scattering parameters are kept constant. The bandwidth used in the simulations is 3 GHz.
. 3.
line: input signal. Dashed line: ideal output signal for a noiseless amplifier.
Circles: simulated output for a noisy amplifier (BGA616) with a given NF.
PHOTOSENSOR AND THE AMPLIFIER 10
100
0 4 8 12 16 20 24
-100 0
BW = 2GHz
Time [ns]
Voltage [µV] BW = 200MHz
0 4 8 12 16 20 24
- 0 0
100 10
0 4 8 12 16 20 24
0 0 0
-10 10
Time [ns]
NF = 5 dB
Voltage [µV] NF = 1 dB
to
) Use of an amplifier where the input reflection coefficient is
plifier with m
he second option is easier. With the pad we relax the de
Reduction of mismatch effects
dissipative pad with an attenuation factor A reduces the vo
high reflection coefficients. As a result secondary (echo) pulses are obtained due to mismatches. This problem is commonly addressed by following two different approaches:
1
low. This needs to be done at the expense of noise figure increase, since minimum noise and optimum broadband coupling cannot be obtained simultaneously [10].
2) Use of a dissipative pad between an am
oderate reflection losses and the photodetector. It can be implemented with a T resistive network or with a coaxial discrete component, which has almost the same size of a connector.
T
mands for low S11 in the amplifier design and there is no loss in bandwidth. In addition, the amplitude of pulse echoes is attenuated and the stability improved. However, we need to know what price must be paid in terms of sensitivity.
A.
A
ltage standing wave ratio (VSWR) in a fairly broad band of frequencies [11]. As a result, the ratio true-pulse-peak-voltage / secondary-pulse-peak-voltage increases by a factor of A1/2. The final VSWR (VSWR’) is related to the original one (VSWR) by
( )
(
1)
11 ' 1
+ +
−
− +
= +
A A VSWR
A A
VSWR VSWR (4)
0 4 8 12 16 20 24
-100 0 100 200 300 400 500
0 4 8 12 16 20 24
-100 0 100 200 300 400 500
0 4 8 12 16 20 24
-100 0 100 200 300 400 500
t [ns]
t [ns]
Voltage [µV] 6 dB2 dB
Voltage [µV]
0 dB
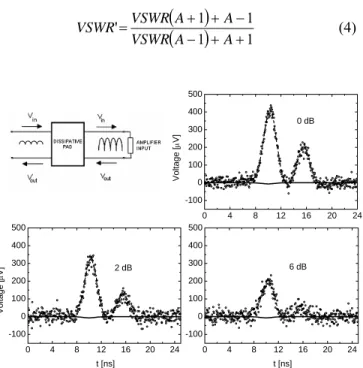
ig. 4. Dependence of the BGA616 amplifier output pulse on the attenuation
Stability improvement
ve pad to the amplifier also helps
F
factor of the dissipative pad. Mismatches between the photodetector and the amplifier are considered. The bandwidth is 3 GHz and the amplifier noise figure is 3 dB.
B.
The addition of a dissipati
to increase its stability, avoiding oscillations.
For a pad, consider the k-∆ criteria [12]. Unconditional stability is obtained if and only if k > 1 and ∆ < 1, where ∆ is the determinant of the S matrix and
21 12
2 2
2 S
S −
− 11 22 2 1
S
k S + ∆
= (5)
he pad tends to reduce the modulus of S11, S12 and S22,
im v
T
proving the amplifier stability for the typical alues of ∆.
Fig. 5 shows an example of the stability parameters measured for a monolithic pulse amplifier. Without any dissipative pad, this device is potentially unstable within the operating frequency band, since k<1 below 100 MHz and above 1.5 GHz. When the pad is added, the system becomes unconditionally stable at all the frequencies.
108 109
-1 0 1 0 1 2 3 4
∆
Frequency [Hz]
No attenuator 3dB attenuator
k
Stable Unstable
Fig. 5. Stability of a MMIC amplifier (MSA0886) mounted on coplanar transmission lines and with SMA terminals. The k parameter reveals that the
Increment of the noise
e Te,pad of a dissipative pad with
at
pad
e, −1
amplifier is unstable without the pad. A 3dB attenuator makes it unconditionally stable.
C.
h equivalent temperature T
tenuation factor A is
T =
(
A)
T (5)where T is the physical temperature of the pad. If this pad is connected to an amplifier input with gain G and equivalent temperature Te,amp the overall equivalent noise temperature is given by the Friis equation,
AT,
, + (6)
he new probability density function of the voltage noise ge
amp e pad e total
e T
T, = T
nerated by the amplifier and the pad is therefore
( )
[ ]
A AT A
T
kBT eamp
2
' −1 + ,
σ = (7)
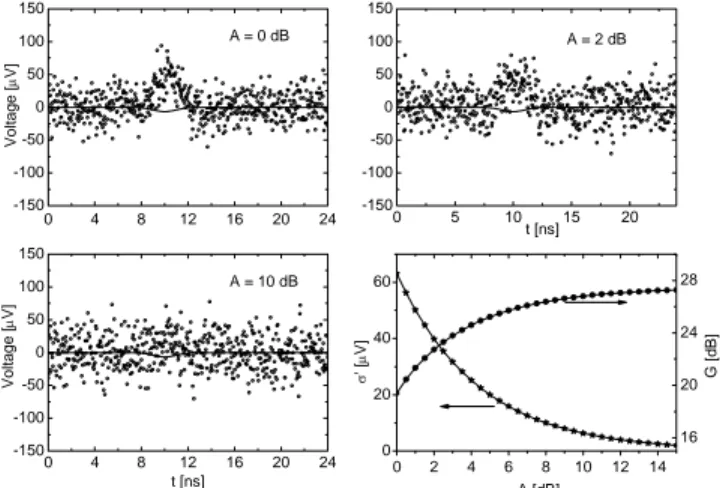
ig. 6 shows an example of the dependence of both pulse an
F
d noise amplitude with the variation of the attenuation A. It is noticeable that the increment of σ with A is weak for practical purposes. The bandwidth (BW) is 3 GHz and the amplifier noise figure is 3 dB. This NF corresponds to the one obtained for the designed amplifier. The BW has intentionally been chosen as the maximum one for practical sub ns pulse detection, in order to test an almost worst-case situation for the pad.
0 4 8 12 16 20 24
-150 -100 -50 0 50 100 150
0 5 10 15 20
-150 -100 -50 0 50 100 150
0 4 8 12 16 20 24
-150 -100 -50 0 50 100 150
0 2 4 6 8 10 12 14
0 20 40 60
16 20 24 28 A = 10 dB
A = 2 dB
Voltage [µV]
A = 0 dB
t [ns]
Voltage [µV]
t [ns]
σ' [µV]
A [dB]
G [dB]
Fig. 6. Dependence of the BGA616 amplifier output pulse on the pad
IV. CONCLUSIONS
Some concluding remarks which are worth a mention are th
o approach and the frequency domain re
the simulations presented here illustrate how a ful
s not possible to obtain op
tions presented here we have considered input da
V. R
EFERENCES[1] J.A. Barrio et al., “The MAGIC Telescope. Design study
[2] scope project”, Acta
[3] ery High Energy Gamma-ray
[4] scovery of very high energy gamma-
[5] ollaboration, ‘Status
[6]
[7] m
[8] t Technologies, “MSA0886 Datasheet”, (1997).
rio,
proceedings.
attenuation. The lower graph on the right shows the dependence of σ’ and overall gain on the attenuation factor
e following ones:
The Monte Carl
presentation of the amplifier high frequency properties were used to develop a software tool which provides valuable information for the design of broadband low noise pulse preamplifiers.
In particular,
l time domain representation of the signals that would be measured for a given photodetector output can be reproduced, once the amplifier S parameters and noise figure are known.
This representation has enabled us to have an accurate knowledge of what can be expected in terms of pixel sensitivity and amplifier bandwidth.
It can also be concluded that it i
timum figures of merit for a suitable preamplifier if one
does not have a previous knowledge of the minimum signal levels that the photodetector can generate with a reasonable signal to noise ratio. In our simulations we have intentionally used noiseless input pulses in order to better visualize the contributions of the amplifier noise. However, if the photodetector produces noise with standard deviations comparable to the ones calculated in this work, careful attention must be paid in selecting the proper gain and bandwidth of the preamplifier, since this device will amplify the input noise as well. Therefore, the limitations of an average photodetector cannot be fully compensated with the best amplifier.
In the simula
ta typical of the photodetectors that will be used in the MAGIC II camera, and bandwidths, gain and noise figures that have been obtained in the different preamplifier prototypes we have designed. However the models in which these simulations are based have a wider range of applications and will also be helpful in future upgrades of the MAGIC I pixel electronics. In addition the detailed knowledge of the expected noise that one should obtain at the preamplifier output will also help to identify and eliminate other sources of parasitic signals once the camera is mounted.
for the construction of a 17 m Cherenkov telescope for Gamma-Astronomy above 10 GeV”
M.V. Fonseca, “The MAGIC Tele Polonica B 30, 2331 (1999)
J. Albert et al., “Variable V
Emission from the Microquasar LSI +61 303”, Science 312, 1771 (2006)
J. Albert et al, “Di
rays from Markarian 180 triggered by an optical outburst”, ApJ Letters 648 (2006) L105 – 108
M.V. Fonseca for the MAGIC C
report of the 17 m telescope MAGIC’, these proceedings.
“Description of the Noise Performance of Amplifiers and Receiving Systems”, Sponsored by IRE subcommittee 7.9 on Noise, Proc. Of the IEEE, March, 1963, pp 436-442 Infineon Technologies, ‘BGA616, Silicon-Germaniu
Broadband MMIC Amplifier’, Preliminary datasheet, Apr.
2003.
Agilen
[9] P.Antoranz, M.V.Fonseca, M.Asensio, J.A.Bar M.Cámara, J.L.Contreras, R.de los Reyes, M.López, J.M.Miranda, I.Oya for the MAGIC Collaboration,
“Influence of Mismatch Effects on the Nanosecond-range Pulse Detection with the MAGIC II Telescope”, these
[10
Microondas y Técnicas Experimentales”, [12
etworks in terms of S ] D.M. Pozar, “Microwave Engineering”, 2nd Edition,
1998. Cap 11.
[11] J.M. Miranda, J.L. Sebastián, M. Sierra, J. Margineda,
“Ingeniería de
Ed. Pearson, 2002, pp 208.
] D. Woods, “Reappraisal of the unconditional stability criteria for active 2-port n
parameters”, IEEE Trans. Circuits Syst., vol. 23, (1976) 73–81.