Biomass Burning Event in the European Arctic (Ny ‐ Ålesund, Svalbard Islands)
B. Moroni1 , C. Ritter2, S. Crocchianti1, K. Markowicz3, M. Mazzola4 , S. Becagli5,4, R. Traversi5,4 , R. Krejci6 , P. Tunved6, and D. Cappelletti1
1Department of Chemistry, Biology and Biotechnology, University of Perugia, Perugia, Italy,2Alfred Wegener Institute, Helmoltz Centre for Polar and Marine Research, Potsdam, Germany,3Institute of Geophysics, Faculty of Physics, University of Warsaw, Warsaw, Poland,4Institute of Polar Science, The National Research Council of Italy, Bologna, Italy,
5Department of Chemistry, University of Florence, Sesto Fiorentino, Italy,6Department of Environmental Science and Analytical Chemistry (ACES), Stockholm University, Stockholm, Sweden
Abstract
This paper reports an exceptional biomass burning (BB) advection event from Alaska registered at Ny‐Ålesund from 10 to 17 July 2015 with particular interest on the influence of the airborne particle characteristics on the optical properties of the aerosol during the event. To this purpose we considered two DEKATI 12‐stage aerosol samples spanning the entire advection and analyzed them by scanning electron microscopy techniques. Aerosol chemical data and microphysical properties were also evaluated in order to correlate any change of individual particle characteristics with the bulk properties of the aerosol. The results of individual particle analysis depict a complex event characterized by afirst phase (P1) of massive input of BB carbonaceous particles (i.e., tar balls, popcorn refractory particles, and organic particles), and by a second phase (P2) dominated by inorganic salts. The peculiar feature of this BB event is the exceptionally large grain size of the subspherical organic particles at the beginning of the event with respect to the background. At these conditions a significant increase of the scattering efficiency may occur even for a small increase of the size parameter. Results of the simulation of the complex refractive indices (n‐ik) confirm this evaluation. Aerosol evolution during the event resulted from the combination of three distinct occurrences: (a) progressive rotation of air mass circulation toward non‐BB source areas, (b) development of a thick fog layer in the planetary boundary layer, and (c) sea salt spray direct advection of local/regional provenance.1. Introduction
In recent years wildfire activity has dramatically increased in different regions in the world as a consequence of global warming (Bowman et al., 2017; Jolly et al., 2015; Young et al., 2016). In particular higher large‐wildfire frequency, longer wildfire durations, and longer wildfire seasons have been registered in the midelevation Rocky Mountains and in Siberia (Ponomarev et al., 2016; Scasta et al., 2016; Westerling et al., 2006). As biomass burning (BB) emissions from forestfires in North America and Eurasia tundra regions can be transported into the Arctic by global atmospheric circulation (Stohl, 2006; Warneke et al., 2009) they may contribute significantly to climate change in that region as a source of particles which are able to alter the atmospheric chemistry and the Earth's radiation balance (e.g., Liu et al., 2014; Reid et al., 2005; Zhao et al., 2014).
Large forest fire BB events can inject large quantities of black carbon (BC), organic carbon (OC), and inorganic salts (ISs) into the atmosphere. While BC is a strong light‐absorbing agent and ISs are typically light‐scattering particles (Bergstrom et al., 2007; Reid et al., 2005), OC can exert a more complex optical behavior: It can have a dominant light‐scattering effect (Cooke & Wilson, 1996; Haywood & Ramaswamy, 1998; Liousse et al., 1996) or it can act as a variably absorbing agent (brown carbon, BrC; Andreae &
Gelencser, 2006) depending on its nature, mixing state, and composition (Wu et al., 2016). Better knowledge of the chemical, microphysical, and optical properties of BB particle types can improve our estimate of the radiative forcing of BB aerosols in the atmosphere and snow.
©2020. American Geophysical Union.
All Rights Reserved.
Key Points:
• The case study is an exceptional biomass burning advection event from Alaska registered in the Arctic in July 2015
• Results of analyses point at two distinct phases of the event dominated by organic carbon particles and inorganic salts, respectively
• Distinct aging effects involving organic carbon and inorganic salt particles at different relative humidity conditions are hypothesized
Correspondence to:
B. Moroni,
beatrice.moroni1@istruzione.it
Citation:
Moroni, B., Ritter, C., Crocchianti, S., Markowicz, K., Mazzola, M., Becagli, S., et al. (2020). Individual particle characteristics, optical properties and evolution of an extreme long‐range transported biomass burning event in the European Arctic (Ny‐Ålesund, Svalbard Islands).Journal of Geophysical Research: Atmospheres, 125, e2019JD031535. https://doi.org/
10.1029/2019JD031535
Received 20 AUG 2019 Accepted 12 FEB 2020
Accepted article online 13 FEB 2020
Individual particle characterization of BB aerosols at relatively short distance from the source revealed a great variety of physical and chemical properties depending on the type of biomass fuel, the combustion phase, the combustion conditions, and the aging effects (Adachi & Buseck, 2011; China et al., 2013; Li et al., 2003; Popovicheva et al., 2015; Posfai et al., 2003). The properties of BB aerosols can vary significantly during the transport of the smoke plumes due to aging and/or processing of the BB particles in the local atmospheres (Diapouli et al., 2014; Forrister et al., 2015; Hand et al., 2005; Nikonovas et al., 2015). Once they have reached the Arctic region, the BB particles can undergo further evolution and, possibly,final fate depending on the atmospheric mixing conditions. Namely, in the case of atmospheric stability the BB parti- cles can station at some height above ground where they can undergo aging effects while exerting a main action on the aerosol optical properties. At turbulent regimes, instead, the particles can more easily reach the ground and affect the albedo properties of snow and ice exposed surfaces even a long time after the BB transport event (Ruppel et al., 2017).
In this paper, we consider an exceptional BB event from Alaska registered at Ny‐Ålesund, Svalbard Islands, in July 2015. The transport event was very strong with remarkable direct effects on the atmospheric dynamics, regional radiative budget, optical properties, and weather forecast (Lisok et al., 2018;
Markowicz et al., 2016; Nikonovas et al., 2016; Ritter et al., 2018). In a previous paper (Moroni et al., 2017) the morphochemical characteristics of the aerosol particles were analyzed in a selected short time span in the central part of the event. The size, shape, mixing state, and the relative abundance of the particle types were evaluated to make some hypotheses on the origin and the aging of the particles before reaching the receptor site. The complexity and exceptionality of the event along with the persistence of the BB particles at some height above the planetary boundary layer (PBL) for a long time after the event required a long‐term detailed evaluation of the aerosol particle properties at Ny‐Ålesund for that period. In this paper we extend our study to the entire event with special interest on the evolution of the particle characteristics during the time. Thefinal aim is to correlate them with the optical properties of the BB aerosol.
2. Experimental
2.1. Sampling and Measurements
The summer of 2015 will go down in history as one of the busiestfire seasons ever recorded in Alaska with unusually large wildfires affecting the State from mid‐June to mid‐July [http://fire.ak.blm.gov/]. From 3 to 10 July, in particular, when 60 distinctfires were involving a large region of the Yukon‐Koyukuk state, the air masses intercepted the smoke plume and conveyed it across the Arctic ocean reaching Ny‐Ålesund in the afternoon of 9 July (Markowicz et al., 2016). Air mass back trajectories (Figure 1) revealed persistent advection from Alaska till 13 July. After that date, the air masses progressively moved toward the coastline of Siberia where they stayed for a long time (Moroni et al., 2017). The time span considered in this paper extends between 10 and 17 July.
Aerosol sampling and measurements were performed at the Gruvebadet observatory (GVB), an Italian infra- structure located at about 50 m above sea level, 800 m southwest from the Ny‐Ålesund village (78°55′N, 11°
56′E), Svalbard archipelago. The station is equipped with an extensive set of measurement and sampling devices. Aerosol optical properties are measured using a Particle Soot Absorption Photometer (PSAP; sensi- tivity 2 * 10−7m−1) and a Nephelometer (detection limit lower than 1 * 10−6m−1) both from Radiance Research. PSAP records the change in light attenuations through a loadedfilter at three wavelengths (467, 530, and 660 nm), which allows the calculation of the Ångström Absorption Exponent (AAE). The PSAP measurements have precision ranging between 20% and 25% for the absorption coefficient and 30–35% for the single scattering albedo (Lack et al., 2006). Corrections for multiple scattering and nonpurely absorbing aerosols were done following the methodology from Haywood and Osborne (2000). Nephelometer measures the scattering coefficient at the single wavelength of 530 nm (Müller et al., 2009), with an angular integration range of 10–170°. Corrections for nonideal illumination and truncation error were performed according to the description presented in Müller et al. (2009). Single scattering albedo (SSA) is derived from scattering and absorption coefficients. These optical data are complemented by the aerosol size distribution, recorded in the 10–487 nm range by a Scanning Mobility Particle Sizer (SMPS; TSI, 54 channels) and in the 523 nm to 20μm range by an Aerodynamic Particle Sizer (APS; TSI, 52 channels). The two systems work in a synchro- nized mode with the acquisition of one size spectrum every 10 min. The SMPS and APS instruments were
certified by the manufacturer. The calibration system meets the International Organization for Standardization (ISO)–9001:2000 certification requirements, the Quality Management Systems Requirements, and complies with the ISO 10012:2003 and Quality Assurance Requirements for Measuring Equipment. Typical single‐channel uncertainties in aerosol number distribution, in case of the SMPS and APS, are 20% and 18%, respectively (Buonanno et al., 2009).
GVB arranges different aerosol samplers operating with differentfilter media to provide a wide range of tools to aerosol bulk chemical speciation at different time resolution. A PM10low‐volume daily sequential sam- pler (TCR Tecora Skypost) with Teflonfilters is employed for the determination of ions and metals contents while a daily PM10medium‐volume sampler (TCR Tecora Echo PUF) with quartzfilters is employed for elemental carbon and OC determinations. In addition, a DEKATI 12‐stage (0.045–0.085–0.14–0.22–0.35–
0.58–0.76–1.06–1.66–2.68–4.08–8.5μm cutoff size ranges from 0.045 to >8.5μm) low volume impactor oper- ating with Kapton membranes is employed in the collection of samples dedicated to direct beam analysis.
Duration of the sampling interval, in this case, is 4 days in order to collect a sufficient quantity of aerosol on each stage. A full set of samples and measurements is available for the period from 28 February to 21 October 2015.
2.2. SEM
Individual particle characterization by scanning electron microscopy (SEM) was performed on two DEKATI 12‐stage, 4‐day aerosol samples on Kaptonfilters collected in the periods 10–13 July (sample P1) and 14–17 July (sample P2), 2015. Kapton membranes are particularly well suited for SEM analysis because they are very smooth and homogeneous. In addition, they show high transparency to X‐rays, high thermal stability, and good insulation properties. For this latter reason, no carbonfilm coating is necessary to provide electri- cal conductivity and to prevent charge buildup during the exposure to the electron beam. The Kaptonfilm supports from each stage were directly mounted on to SEM aluminum stubs using double‐sided carbon tape;
after that, the sustaining rings of the Kaptonfilms were removed so that thefilmsfitted the stubs exactly.
SEM imaging was performed using two different instruments, namely a Philips XL30 microscope equipped with a LaB6source electron gun, and a ZEISS Supra 25 microscope equipped with afield emission gun and a GEMINI column. Both instruments are available at the University of Perugia. The former was employed at Figure 1.Ten days long back‐trajectories describing the path that individual air particles starting at 0:00, 6:00, 12:00, and 18:00 in the periods 8–9 (a), 10–13 (b), and 14–17 (c) July 2015 (the position at 00:00 of thefirst,fifth, and tenth day of each trajectory is specified by the small number along the path).
15 kV acceleration voltage and lower magnification (5,000X to 40,000X) for basic observations while the latter was employed at a variable voltage (0.5 to 15 kV) and magnification (5,000X to 350,000X) to distinguish particle types and textural details.
Energy‐dispersive X‐ray spectroscopy (EDS) microanalyses were performed using the ZEISS instrument equipped with an X‐ray dispersive spectrometer (QUANTAX EDS microanalysis system coupled with the ESPRIT software for data treatment). EDS spectra (spot size 5, working distance 8.5 mm) were collected for 90 s live time and the elemental composition obtained after standardless matrix correction provided by the ESPRIT software. Values lower than 0.1 wt% (SEM detection limit) were omitted.
3. Results and Discussion
3.1. The BB Event
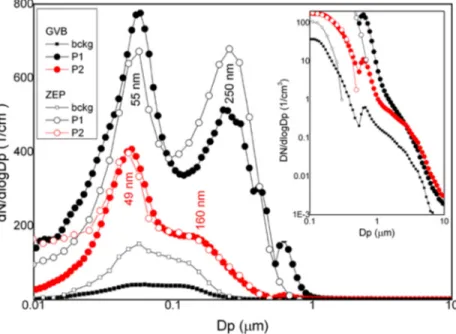
Compared to the background situation, the BB event at GVB is characterized by a sharp peak in the Aitken mode range at ~50 nm, and by a wider, much less intense peak in the accumulation mode at ~200 nm (Figure 2). The peak ratio is lower in thefirst phase (P1) than in the second phase (P2) of the event, while the position of the peaks is slightly set back in P2 with respect to P1 (Figure 2). A third, small maximum at ~400 nm is also present in P1. Comparison with the aerosol size distribution at Zeppelin station, 474 m above sea level (ZEP in Figure 2), shows a different ratio of the main peak heights in P1, a very similar trend in P2, a different background, and no peaks at ~ 400 nm. Considering the different heights of the two sta- tions, these observations point to a different vertical structure of the very low troposphere between P1 and P2, with significant rehomogenization of the particle size distribution in P2.
Cumulative values of the GVB particle number concentrations were calculated for the size ranges of 10–110 nm (Aitken mode, AM), 110 nm to 1μm (accumulation mode, AcM), and greater than 1μm (coarse mode, CM). The results for the AM (Figure 3a) show two strong pulses on 10 July and a wide modulating maximum extending from 11 to 13 July. In the same period the AcM and the CM trends show a sharp minimum in cor- respondence with thefirst AM pulse, a subsequent strong increase at the beginning of the second AM pulse followed by much lower, quite stable values, a sudden decrease at the beginning of the third AM maximum, and quite stable values till 13 July. The strong distinct pulses of AM and AcM/CM suggest that they belong to at least two distinct particle populations, while the symmetrical AM and AcM trends registered from 11 to 13 July in conjunction with the strong increase of atmospheric relative humidity (Figure 3b) point to individual growth of hygroscopic particles.
Starting from the afternoon of 13 July a new pattern of particle number concentration marks the transition to the second phase of the event (Figure 3a). This phase starts with a strong increase of the AM, followed by a fluctuating pattern between 14 and 15 July, and shows afinal decreasing trend from 16 to 17 July. In the same period increasing trends of the AcM and the CM are observed. Suchfluctuations may be related to the abrupt change of wind direction from SW to NE, leading to the entrainment/nucleation and growth of new particles.
Bulk geochemical patterns of daily samples collected at ground level (Figures 4 and 5) reveal a background characterized by fresh sea salt apportionment and a rapid transition to BB advection in P1 (e.g., peak levels of OC, BC, ammonia, nss‐K, and nss‐sulfate). In particular, the peak levels of BC aerosol mass concentration registered on 10 and 11 July are comparable with those obtained from aircraft measurements inside BB plumes (Sahu et al., 2012). The presence of ammonium and sulfate ions at high relative humidity conditions between 11 and 13 July suggest hygroscopic growth of ammonium sulfate in the presence of soluble dicar- boxylic acids (Wise et al., 2003) at the origin of the observed symmetrical AM and AcM trends registered on those days. A rapid transition to strong sea salt apportionment is evidenced in P2 (e.g., peak levels of Na+and Cl−). This latter feature along with the strong increase of the Cl−/Na+ratio in this phase suggest mixing between a long‐range transported aerosol enriched in BB particles and local/regional fresh sea salt spray. In addition the nss‐sulfate excess with respect to ammonium ion concentration (nss‐SO42−/NH4+
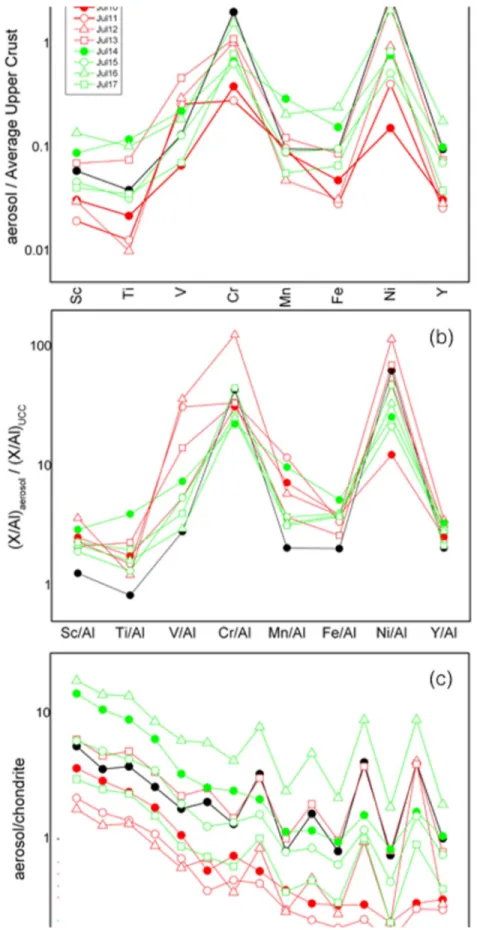
ratio exceeding 2.66; Figure 5) between 13 and 14 July, the increase of Sc, Ti, Mn, and Fe values registered after 12 July (Figure 6a) and the distinct pattern of enrichment factor values (Figure 6b) in the same period lead us to identify distinct sources for these chemical components. In particular, the high enrichment factor of V in the aerosol samples from P1 are consistent with a derivation from magnetite bearing ores, such those
outcropping in the Yukon‐Koyukuk region (https://thediggings.com/commodities/vanadium/usa/alaska) which is, in fact, the source of the BB event. On the other hand, the relatively higher Sc, Ti, Mn, and Fe amounts in P2 are compatible with a provenance from the limonitic weathering crust deposits of the Tomtor carbonatite, NE Russia (Williams‐Jones & Vasyukova, 2018). The elevated concentrations of the rare earth elements, including Sc, are a typical feature of these exploitable Sc deposts. All thesefindingsfit well with the observed change of direction and height of the air mass circulation during the event. The higher light rare earth elements values of 14 and 16 July (Figure 6c), in particular, are consistent with the descent of the BTs over Siberia observed on those days.
Values of the aerosol optical properties show a great variation during the event. In particular the hourly mean values of the scattering coefficient (μs) at 550 nm range from less than 1 to 133 Mm−1(Figure 7a), while those of the absorption coefficient (μa) at 467, 530, and 660 nm range from 0.25 to 21 Mm−1, from 0.25 to 17 Mm−1, and from 0.24 to 13 Mm−1, respectively (Figure 7b). Whileμsandμavalues measured in P2 are comparable to those in other polar regions, those collected during P1 are remarkably higher (Aaltonen et al., 2006; Tomasi et al., 2007; McNaughton et al., 2011; Ritter et al., 2016; Pakszys &
Zielinski, 2017). In particular data of 10 July are in good accordance with literature data of BB aerosol (e.g., Hopkins et al., 2007; Reid et al., 2005).
The SSA and AAE are presented in Figure 7c. From 10 till 16 July values of both optical properties are quite constant over time. While the AAE shows values around 1 with only slightly lowerfluctuations from 12 to 15 July, the SSA has values around 0.9. The variable absorption and scattering over time with almost constant values of AAE and SSA during the event suggest that the particle concentration is highlyfluctuating despite the BB event is quite homogeneous in terms of intensive optical properties SSA and AAE. Hence, the differ- ences in chemical composition between P1 and P2 only lead to a slightly reduced value of the AAE. In any case our values of AAE around 0.9 are quite low with respect to those of BB emissions from North America boreal forest (Reid et al., 2005), but consistent with the presence of variably aged BC (Liu et al., 2018).
3.2. Particle Types
Carbonaceous particles (CPs), inorganic salts (ISs), and mineral dust (MD) are the particle types present in the samples.
Figure 2.APS‐SMPS aerosol size distribution at ground level at Gruvebadet (GVB) and Zeppelin (ZEP) stations before the advection (bckg), from 10 to 13 July (phase P1) and from 14 to 17 July (phase P2) with corresponding peak positions (mean values). The aerosol number size distribution at ZEP is measured by a closed‐loop differential mobility particle sizer. The peak at ~630 nm present in all the GVB samples is an artifice of particle size measurement.
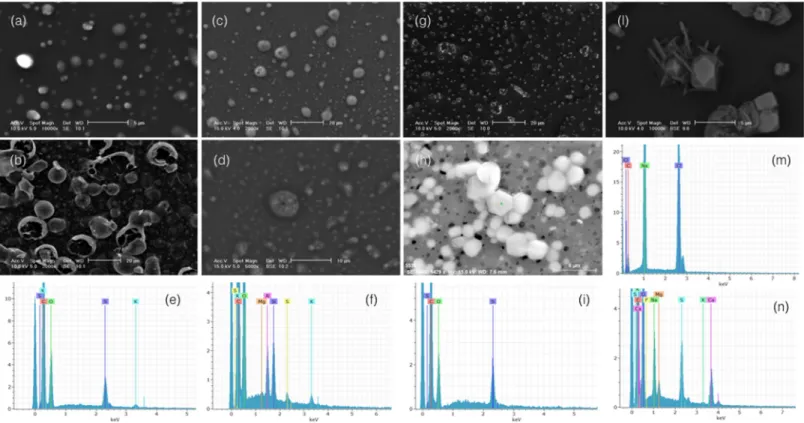
Three types of CPs have been distinguished. Thefirst type consists of spherical submicron (mean size 0.7μm) and supermicron (mean size 1.2μm) carbonaceous refractory particles with smooth surface. These particles are composed almost exclusively by carbon with a small amount of oxygen, they stand isolated within the particulate matter and show great stability under the electron beam (Figure 8a). All these features suggest that they are an original burning product rapidly formed inside the BB plume by heat shock of highly viscous fluids at increasing distance from the smoldering area (Adachi & Buseck, 2011; Hoffer et al., 2016; Posfai et al., 2003; Toth et al., 2014). They were, thus, passively transported to Ny‐Ålesund without any substantial modification of their structure and/or composition. According to Posfai et al. (2004), we define them tar balls (TBs) despite the larger mean particle size of our TBs with respect to them.
A small group of carbonaceous refractory particles exhibits very peculiar features. They share with common TBs the spherical shape, smooth surface, and refractory nature, but they are characterized by remarkably larger size and show a typical“popcorn”appearance with anμm‐thick fragile shell and hollow internal structure (Figure 8b). This typical structure, which derives from steam expansion inside a heated organic
“kernel,” is very common in coke where it derives from the polymerization of olefins conjugated with Figure 3.Trends of Aitken, accumulation and coarse mode fractions (a), temperature and relative humidity (b) of the aerosol at GVB during the BB event.
aromatics in the absence of oxygen (Wiehe, 2008). By analogy, our“popcorn”particles can be interpreted as the product of incomplete wood combustion and rapid cooling of highly viscous organic fluids inside the plume.
The third CP type consists of spheroidal particles with a rough surface and heterogeneous structure due to the presence of nanomicrometric to submicrometric IS and MD particle inclusions within them Figure 4.Temporal trends of elemental carbon (EC) and organic carbon (OC) aerosol mass concentrations (μg/m3) in the samples and corresponding value of OC/EC ratio (on the bars). Numbers over the bars are for black carbon (BC) aerosol mass concentrations (data from Zeppelin station, 475 m above sea level, 800 m south from Ny‐Ålesund).
Figure 5.Temporal trends of sodium (Na+), chloride (Cl‐), ammonium (NH4+), non‐sea salt potassium (nss‐K+) and non‐sea salt sulfate (nss‐SO42‐) ions aerosol mass concentrations (μg/m3) and values of the ratio Cl‐/Na+(solid symbols and line) and nss‐sulfate/ammonium (open symbols and dot line) in the samples. Lines of theoretical wt% ratios of sea water (Cl−/Na+= 1.81) and pure ammonium sulfate (SO42−/NH4+= 2.66) are reported for comparison.
Figure 6.Transition metal concentrations (a), enrichment factors (b), and rare earth element patterns (c) in the daily aerosol samples. Values are normalized to average upper continental crust and chondrite compositions (data from Taylor & McLennan, 1981).
(Figures 8c–8f). The carbonaceous material is highly unstable under the beam (Figures 8c and 8d) and the particles easily evaporate leaving a car- bonaceous tarry residue and isolated inclusions. This latter feature sug- gests that these particles are much less viscous and more volatile than TBs. They were, thus, likely generated by condensation outside theflam- ing area of thefire; they were transported to Ny‐Ålesund as hygroscopic fluid particles collecting water from atmospheric humidity, dissolving ions andfinally giving rise to internally mixed reactive drops. According to our previous paper (Moroni et al., 2017), we define them as organic particles (OPs).
ISs consist of potassium chloride (KCl), potassium sulfate (KSul), ammo- nium sulfate (ASul), sodium chloride (NaCl), and gypsum (Gy) particles.
KCl consists of small individual idiomorphic prismatic crystals micro- metric in size enclosed between the OC particles (Figure 8g). KSul is represented by small allotriomorphic angular shaped individual crystals.
EDS microanalysis revealed a kainite composition for the presence of both Cl and sulfate ion in many crystals.
ASul consists of micrometric to submicrometric particles in the orthor- hombic dipyramidal class symmetry shape typical of the ammonium sul- fate mascagnite. A significant amount of roundish to capsule‐shaped crystals resulting from their dissolution is also present in the sample (Figures 8h and 8i). The typical shape and the strict size segregation of these grains suggest direct precipitation and rapid growth of ASul crystals upon the samplingfilter just after collection.
NaCl mostly consists of cubic to prismatic crystals submicrometric to overmicrometric in size. A significant amount of large NaCl crystals has the typical orthorhombic dipyramidal shape simulating mascagnite (Figures 8l and 8m). This latter occurrence suggests some kind of substitu- tion of mascagnite by the sodium chloride halite. Gy is represented by idiomorphic acicular to platy crystals polymicrometric in size developing around the other IS particles (Figures 8l and 8n). This feature along with the mixed composition of the salt aggregates (involving Mg and K among other chemical elements) suggests chemical reaction with sulfate bearing aerosols at the origin of the Gy particles.
Mineral dust (MD) includes different classes of minerals such as silicates (quartz, feldspar, and sheet minerals), metal oxides (Fe and Ti oxides) and carbonates (calcite and dolomite). The particle size is highly variable from coarse to very fine in sample P1, and generally coarse in sample P2 (Figure 9). In thefirst case, the particles, whose shape is regular and the size is well in accordance with the cutoff size of the impactor, are gener- ally found adhered upon the OPs surface (Figure 8d). In the second case, the particles are mostly represented by rounded to irregular shaped individual crystals most of which are covered by sulfate coatings. The composition of the two particle groups is quite different, for example, those particles from thefirst phase of the advection mostly consist of silicates (Figure 8f) while those collected dur- ing the second phase of the advection contain a significant amount of carbonates and metal oxides, well in accordance with the bulk geochemistry of the aerosol (Figure 6). In the light of all these points, thefine‐
grained to veryfine grained silicates can be related to the original soil involved in the wildfire, while the coarse‐grained particles can be related to regional and/or long‐range transport from a different source area.
According to the aerosol bulk chemical composition, these latter particles are compatible with a provenance from Siberia which is, actually, the source area of the air masses in the second phase of the advection.
The general features of the particle types are consistent with those observed by Moroni et al. (2017) in the transition phase between P1 and P2, with some peculiarity. Namely, the size range of TBs is similar, but Figure 7.Trends of aerosol scattering at 530 nm (a), absorption coefficients
(b), single scattering albedo (SSA) at 530 nm (orange line, right scale) and absorption Angstrom exponent (AAE, gray line, left scale; c) of the aerosol at GVB during the BB event.
the relative proportion betweenfine and giant TBs tends to be inverted to the larger grain size. This fact along with the distinguishing presence of“popcorn”particles point to the massive transport of a strong BB event during P1. In addition the great amount of NaCl particles in P2 with respect to the transition phase points to the massive influence of sea salt spray deposition starting from 14 July.
3.3. Aerodynamic Versus Geometric Diameter and the Origin of Particle Types
Individual particle analysis on separate stages of the DEKATI‐12 impactor revealed distinct populations of the particle types at different cutoff size ranges in P1 and P2 (Figure 9). A clear mismatch between the geometric diameterdg, as revealed by SEM observations, and the aerodynamic dia- meterda, corresponding to the cutoff size ranges of the impactor stages, was evidenced for some particle types. Such a discrepancy is particularly evident in the case of OPs. These particles are present on almost every impaction stage starting from 0.045μm aerodynamic diameter. Particles on this stage, in particular, have a geometric diameter between 1–2μm and ~10 μm. Even assuming a mean diameter of the OPs of 2μm we obtain a particle density which is less than 0.1 compared to the unitary density of the particle model of the impactor. Such a density is, of course, incompatible with any kind of organic material. This fact suggests that such “large” OPs are the result of aggregation processes occurring on the impactor stages during their collection. The presence of small, well‐ sorted silicate particles whose size is compatible with the cutoff range of this stage and, what's more, the presence of ammonium sulfate coatings Figure 8.SEM micrographs of the particle types with EDS microanalyses: (a) TBs (sample P1, stage DK6, SE image); (b)“pop corn”particles (sample P1, stage DK4, SE image); (c) OPs (sample P1, stage DK3, SE image); (d–f) OPs (detail of (c), BSE image) with EDS spectra of mixed ammonium/potassium sulfate and mixed silicate‐ammonium/potassium sulfate coatings; (g) KCl‐KSul particles (sample P1, stage DK9, SE image); (h, i) idiomorphic partially dissolved mascagnite ASul crystals with EDS spectrum (sample P2, stage DK4, SE image); (l–n) halite (pseudomorph on mascagnite) and Gy (acicular) crystals with EDS spectra (sample P2, stage DK10, BSE image).
Figure 9.Distribution of the particle types in the DK 12 stages of sample P1 (gray bars) and sample P2 (white bars with sparse line pattern) with corresponding cutoff size ranges of the aerodynamic diameter. The gray bar with asterisk is for the“popcorn”particle population.
upon the OPs strongly support this hypothesis. It is, thus, likely that OPs are passively transported by the air masses as humid“clouds”of individual nanomicrometric to submicrometric sized particles able to collect sulfate solutions as well as long range transported soil dust nanoparticles. The ~50 nm diameter resulting from the APS‐SMPS measurements (Figure 2) provides a reasonable estimate of the original geometric dia- meter of OPs.
“Popcorn”particles are another particle type strongly affected by the mismatch betweendaanddg. In this case, however, the particles are not ubiquitary in all the stages as they are only found in Stages 3 and 4 (which correspond to a size range of the aerodynamic diameter of 0.14–0.22μm). Particles on this stage are empty spheres 10 to 20μm large delimited by a 1 to 2μm solid, smooth and fragile shell. Considering that these particles typically belong to the P1 sample, that is, to the direct BB advection event, it is very likely that they represent the original BB particles generated inside the plume and passively transported in the aerosol before being collected“as they were”by the impactor. Assuming a density equal or just below unity for this particle type (which is consistent with those of the organic constituents of TBs), from the empirical relation- ship by Chen and Fryrear (2001), a value of the ratiodg/da~ 30 has been obtained. Assuming this value as a reference value for the particle type, thefine particle modes between ~300 and ~450 nm resulting from the APS‐SMPS measurements (Figure 2) can, thus, be associated to these particles.
Differently from OPs and“popcorn”particles, TBs have adgsize range well in accordance with the cutoff size range of the impaction stages where the particles were found (Figure 9). We can, thus, reasonably assume that they are original long‐range transported atmospheric particles rather than sampling artifacts.
Some discrepancy betweendganddais also apparent for some kind of ISs. In particular, and despite the fact that ASul has a density of 1.77 g/cm3(i.e., almost twice the unitary density of the calibration model of the impactor), ASul particles with a meandgof ~1μm lie on the stages corresponding to 0.14μm <da< 0.22 μm. On the other side the KCl, NaCl and Gy particles, all having a density almost equal or exceeding 2 g/cm3 (i.e., 1.99, 2.17, and 2.31 g/cm3, respectively), are characterized by a meandgranging from 1 to 3μm which is quite in good accordance withda. Such a distinction suggests a different origin of the particle types in the samples. Namely, ASul, whosedgrange is manifestly larger than theda, may have originated by precipitation from oversaturated solutions just upon the impaction stages during sampling, while KCl, NaCl, and Gy, whosedgis equal to relatively smaller thanda, may have precipitated inside the aerosol before entering the impactor column during sampling. Therefore, ASul likely formed upon the stages during sampling due to pressure and/or relative humidity drop, while KCl, NaCl, and Gy were already present in the aerosol when they entered the sampling device.
Thedgsize range of the MD particles is quite in good accordance with thedasize range. We have already noticed the veryfine grain size of the silicate particles found in Stages 3 and 4 of sample P1 which has already been associated with a soil dust source involved in the BBfire event. On the other side, the size ranges from about 1 to about 9–10μm are typically associated to the long‐range transported particles from Siberia.
3.4. Particle Morphology and Mixing State: The Role of Inorganic Salts
From what has been said so far it emerges that inorganic salts (ISs) are present in the samples both asfine‐to coarse‐grained individual crystals with a specific morphology (ASul, NaCl, and Gy), and asfilms of nanopar- ticles deposited on particles of different nature (ASul). We will now look at these two aspects in detail with their implications.
Well recognizable individual crystals of ASul, NaCl, and Gy are a common feature of sample P2. There is a strict morphological relationship between ASul and NaCl crystals. In fact, a large number of NaCl crystals show the typical orthorhombic dipyramidal shape of the ammonium sulfate mascagnite. As mascagnite crystallizes in the orthorhombic crystal system while the sodium chloride halite belongs to the cubic system of symmetry, this is a clear example of pseudomorphism. The total lack of ASul residues and/or substrates beneath the NaCl crystals along with the environmental conditions of crystallization lead us to exclude encrustation and alteration as pseudomorphism processes, and to propose for a process of substitution.
Namely, a rapid process of substitution may have occurred due to the deliquescence of ASul at high ambient relative humidity (the deliquescence relative humidity of mascagnite is ~80%), followed by the prompt pre- cipitation and growth of NaCl from oversaturated atmospheric solutions. The extremely high relative
humidity conditions, the remarkable presence of roundish deliquescing ASul crystals (Figure 8h), and the strong apportionment of sea salt spray occurred from 13 to 14 July (Figure 5) support this hypothesis.
Gy crystals exhibit tabular to acicular shapes. The typical shapes along with the coarse grain size suggest a secondary origin for this mineral spe- cies from sulfate enriched aerosols by rapid crystallization and growth of the crystals with short, if any, transport. On the other hand, the excess sul- fate relative to ammonium, the pattern of the alkali metal ions (Figure 5), and, what's more, the presence of mixed sulfates in the sample (Figure 8n) lead us to conclude that a significant part of the sulfate ion resulting from the BB process reacted with non‐sea salt Ca2+and Na+ions (maybe from the burnt vegetation and/or the upper soil) to give rise to complex alkali sulfates.
Thick layers of ASul deposits typically cover the OPs and their accumu- lations while avoiding TBs. This fact highlights the remarkable abun- dance of ammonium and sulfate ions within the smoke, and the different behavior (hydrophilic vs. hydrophobic) of OPs and TBs. In addition to these facts the presence of small amounts of potassium sul- fate within the layers (Figure 8e) is a clear evidence of aging of the ori- ginal smoke through the aqueous‐phase reaction between KCl and sulfur dioxide in the smoke itself during the transport. Low levels of potassium sulfate are indicative of the existence of a reaction kinetics favoring the formation of ammonium sulfate instead of potassium sulfate. It should not be neglected, however, that the extremely high deliquescence relative humidity of potassium sulfate (~97% at 298°K) may have provoked its dissolution during the direct BB advection event when relative humidity at ground level reached saturation. In the light of this point what we actually see in the samples is the residual phase of this initial step of dissolution.
3.5. Chemical Mass Closure
Based on the results of SEM determinations a mass closure of the constituent phases in the aerosol during the event has been performed in order to estimate the relative abundance of the main particle types in the aerosol.
Starting from the mass concentration of the chemical components in the daily PM10aerosol samples we cal- culatedfirst the % mass fraction of OC (including OPs and TBs) and BC from 8 to 17 July. The BB OC fraction was then obtained by subtracting the background OC value obtained on 8 July from the OC values and further dividing the resulting quantities by the PM10aerosol mass concentration.
Results of the estimation (Figure 10) show that 35% to 40% of the PM10mass of 10 and 11 July consists of OC.
This value rapidly drops to a few % on 12 July, likely due to the growth and deposition of the hygroscopic OPs in the fog layer stationing at ground level on that day. The BB OC fraction increases again to more than 20 wt
% on 14 July andfinally drops down in the subsequent days in coincidence with a progressive increase of the non‐BB OC fraction. Assuming this latter fraction to be represented by secondary organic aerosol this result is in accordance with Hansen et al. (2014), who found elevated secondary organic aerosol tracer amounts at Zeppelin Mountain in periods with air mass transport from northern Eurasia. This further confirms the observed change of air mass origin from Alaskan to Siberian regions occurred after 13 July. The BC fraction ranges from a maximum of 2% to 3% in phase P1 to a minimum of 0.9% to 1% in phase P2 (Figure 10).
Notwithstanding values of the ratio BC/BB‐OC at the beginning of P1 (10–11 July) and P2 (14–15 July) are similar and much lower than those obtained for the rest of the event.
In a second step, we calculated by stoichiometry the ISs (ASul, KSul, KCl, NaCl, and Gy) mass fractions within the aerosol samples based on SEM observations and aerosol mass concentrations of the chemical species within the daily samples. In phase P1 wefirst calculated the % mass fraction of ASul, the sulfate ion excess was then partitioned into KSul and the residual K ion was used to obtain KCl. In phase P2, instead, the sulfate ion excess was recalculated as Gy while the ss‐Na amounts were employed to Figure 10.Percent mass fraction of biomass burning (BB) and nonbiomass
burning (n‐BB) organic carbon (OC), potassium and ammonium sulfate, gypsum (Gy), potassium and sodium chloride (KCl, NaCl) in the daily PM10 samples. Amounts of the black carbon (BC) fraction are also reported inside the OC bars. The white bars (“other”) are for the undetermined phase fraction. The relative uncertainty of the mass fraction determinations is 6%.
calculate the NaCl mass fraction. The results (Figure 10) reveal a few % of KSul and traces of KCl on 11 and 12 July, a few % of Gy on 14 July, 10% to 30% mass fractions of NaCl from 14 to 17 July and an average 8–
9 wt% of ASul in the aerosol during the entire event.
The contribution of the phases under consideration to the mass closure of the aerosol ranges from a minimum of 20 wt % (12 July) to a maximum of 65 wt % (15 July). This means that a variable, but generally a large part of the mass of the aerosol consists of other phases. Mineral dust (MD) is, indeed, the most likely of them. A significant contribution of MD to the total mass despite the generally low particle number concentration of this particle type in the aerosol can be explained considering the (much) higher density and the larger grain size of MD particles with respect to the carbon‐bearing and the inorganic salt fractions. Low molecular weight polar organic acids and nitrates are other possible phases in the aerosols.
The former can account for a significant fraction of the water‐soluble OC in biomass burning aerosol (Falkovich et al., 2004), while nitrates are ubiquitous in the atmosphere and account for a range of inorganic consti- tuents in the particulate matter in polluted environments (Huang et al., 2014). Water‐soluble organic acids can react with nitrates resulting in sig- nificant nitrate depletion and formation of organic salts in mixed organic acids/nitrate particles (Wang & Laskin, 2014). The fact that we could not detect these particles in the samples may be due to the instability of nitrate salts under the electron beam. In any case the nitrate ion amounts in our samples are very low to justify a significant contribution by nitrate particles to the total mass.
3.6. Particle Features Versus Aerosol Optical Properties
We used our in situ data (size distribution from SMPS/APS) and optical data (nephelometer/PSAP) with the method of Riziq et al. (2007) to derive a complex index of refraction for the event. The result is given in Figure 11. Somefluctuations of the refractive index and especially values above 0.01 for the imaginary part can be seen during 10 and 11 July. During P2 the index of refraction is almost constant in time, despite high relative humidity of the surrounding air between 12 and 15 July (Figure 3b). Our refractive index on 10 July is in good agreement to lidar data for that same day in 2 km to 3.4 km altitude (Ritter et al., 2018).
Nevertheless, Wandinger et al. (2002) derived higher values of the complex refractive index, ranging from 1.56–1.66 in real part and from 0.05–0.07iin imaginary part for aged BB aerosol. This discrepancy might be explained by the low fraction of BC with respect to OC in our samples (Kim et al., 2015; see Figure 10).
Still it can be seen from Figure 11 that periods with background aerosol before and after the BB event have an even lower refractive index. As the background aerosol in this season consists of sulfates from marine ori- gin and sea salt (Udisti et al., 2016), it can be seen that the particles in this BB event increase both the real and imaginary part of the refractive index.
As dust alone can probably not explain the found values of absorption and the refractive index (Ritter et al., 2018) it is, thus, very likely that many CPs in the aerosol act as a brown carbon (BrC); that is, a high reflecting material which, compared to BC, is less efficient at light absorption and has a much different wavelength dependence (e.g., Zhang et al., 2017). Optical measurements at ground level of 10 July are in good accor- dance with literature data on similar materials measured in situ or in the laboratory (Bergstrom et al., 2007; Hopkins et al., 2007; Nikonovas et al., 2015; Reid et al., 2005). However, our AAE are on average lower than 1 (see Figure 7c). Markowicz et al. (2016) derived AAE > 1.2 from sun photometry, which indicates a slight variation of particle size or composition with altitude.
Finally, we took our measured size distributions of Figure 2 for the periods P1 and P2 from the GBV together with the derived refractive index of Figure 11. By using Mie theory, it was tested whether the measured values of the single scattering albedo and the absorption Angström exponent could be reproduced. Each 25 step of the refractive index from 1.34 in steps of 0.01 and also 25 steps in the imaginary part from 0 in steps of 0.005 have been employed to calculate SSA and AAE from Mie theory. For P1 we found the closest match between observed and calculated values of both quantities for an index of refractionri= 1.52−i* 0.005, Figure 11.Time series of aerosol imaginary (a) and real part (b) of refractive
index retrieved from in situ surface observations. Data obtained following the method by Riziq et al. (2007). Uncertainties in the retrieved values of the real part and the imaginary part are 3% and 10%, respectively. They were determined as the values which fell within 1σof the minimumχ2, as described by Dinar et al. (2008).
hence similar as for the value of Figure 11. This means that the“closure”, that is,the link between the micro- physical and optical aerosol particles, can be achieved for P1 using Mie theory.
For P2, instead, the closest match between observed and Mie calculated SSA and AAE was found forri= 1.39
−i* 0.005. The real part of this refractive index is clearly lower than the one derived from our measured aerosol species in Figure 11. Hence, Mie theory, which is only valid for spherical particles, is clearly not a good approximation for P2. We can thus argue that during P1 the large TBs and spherical organic particles (see Figures 8 and 9) dominate the scattering, and Mie theory is sufficient to describe the optical properties.
On the other hand, the lower concentration of spherical particles and the higher amount of crystalline salts during P2 lead to a systematic deviation between Mie theory and measured optical properties. Apparently, a lower refractive index would be required to mimic the scattering properties of the aerosol during P2 if the Mie theory was employed.
3.7. Particle Properties and Aerosol Evolution
Results of chemical mass closure reveal an aerosol composition dominated by OC, alone or combined with NaCl, and variable amounts of ASul and MD. Regarding OC, in particular, the remarkable presence of OPs and TBs, which are typically related to smoldering BB combustion involving ponderosa pine boreal forests (Chakrabarty et al., 2010; Hopkins et al., 2007; Posfai et al., 2003), is consistent with the origin and the source of the BB event. According to Posfai et al. (2004), both OPs and TBs originate in thefirst few minutes after the smoke is emitted and, in the presence of significant amounts of biomassfire hygroscopic salts like KCl and K2SO4, they can undergo rapid aging by dissolution, condensation, coagulation, and hydration leading to internally mixed particles. This is what likely occurred on the OPs. Regarding TBs, instead, the presence of dry refractory TBs along with idiomorphic KCl and KSul individual crystals in P1 suggests limited particle aging effects for this particle type. This is quite surprising considering the long‐range transport of the BB advec- tion plume before reaching Ny‐Ålesund. A possible explanation is the low degree of mixing of the smoke plume with ambient and atmospheric aerosol during the event. After the plume had reached Ny‐Ålesund the hygroscopic properties of the OPs may have resulted in a further water uptake at the high relative humidity conditions recorded at Ny‐Ålesund from 11 to 15 July. This fact leads us to hypothesize that some part of OC particle aging may have occurred after entrainment of the BB aerosol in the lower troposphere.
Starting from 14 July the wind regime turned from light to fresh breeze (Markowicz et al., 2016) leading to the entrainment of sea salt spray in the boundary layer during P2. Subsequent evolution of the aerosol involves a strong dilution of the OC particles, the remarkable precipitation of NaCl and, what's more, the transition from direct precipitation and/or deposition of the original KCl‐KSul particles to direct precipita- tion of ASul and Gy. The presence of at least two distinct pulses of the CM after 14 July (Figure 3a) can be explained considering individual particle growth of such particle types.
The results of individual particle analysis, thus, depict a complex advection event characterized by afirst phase (P1) of massive input of BB particulate organic matter (OPs and TBs), and by a second phase (P2) dominated by the strong apportionment of fresh sea salt spray. The mixing state conditions also varied greatly ranging from prevailing internal mixing of ASul coatings upon carbonaceous tarry cored OPs in P1 to prevailing external mixing of IS and MD particles with preexistent TBs and OPs in P2. Massive input of particulate organic matter strongly impacted on the absorption properties of the aerosol as evidenced by the rapid change of the real and the imaginary part of the retrieved refractive index values in thefirst two days of the advection. The peak height modulation in this period can be related to different size and/or density of OPs and TBs arriving on the receptor site. Some kind of a lensing effect due to the internal mixing of BC within OPs can also have taken part to the absorption (Lack et al., 2012). The development of a thick fog cover at ground level registered from 11 to 14 July induced a lowfluctuation of the aerosol refractive index which better marks the transition from P1 to P2. The advection of AM sea salt particles registered from 13 July afternoon (Figure 3a) resulted in rapid decay of the aerosol absorption properties due to the mixing with the particles already present at ground level with few (if any) nucleation and/or growth processes (Moroni et al., 2017).
4. Conclusion
In this paper, we examined the physicochemical and optical properties of a long‐range transported BB aero- sol reaching the Arctic in the light of the chemical‐physical characteristics of the constituent particles. The
aim of the paper was to reconstruct the evolution of the particle characteristics during the advection and to correlate them with the optical properties of the BB aerosol.
Results of the study show that aerosol evolution during the advection resulted from the combination of three distinct occurrences: (a) progressive rotation of air mass circulation toward non‐BB source areas, (b) development of a thick fog layer in the PBL, and (c) sea salt spray direct advection. In particular, the extremely high relative humidity conditions at ground level may have driven the aging of the OPs while leaving the TBs almost unaltered due to their markedly different hygroscopicity. Aging of OPs, and their consequent loss by deposition, may have contributed to the strong decrease of the BB OC frac- tion at the end of thefirst phase of the event. A subsequent change in direction of air mass circulation and local motion may have caused the entrainment of new OC particles stationing in the upper tropo- sphere and their mixing with sea spray and/or non‐sea spray inorganic salts from regional and long range air mass circulation. Therefore, and according to our previous observations (Ferrero et al., 2016; Moroni et al., 2015), some particle aging may be due not only to long‐range transport but also to the stationing of the BB particles at different height inside or above the PBL. The layered structure of the troposphere, seen, for example, by lidar (Ritter et al., 2018), indicates missing vertical mixing and suggests different aerosols properties at different altitudes.
The exceptionality of the present BB event allowed us to properly examine the characteristics and to effec- tively evaluate the influence of distinct particle types on the optical properties of the aerosol during the event. Retrieval of the aerosol optical properties (complex refractive index, SSA, AAE) during the event revealed marked differences between P1 and P2 and an index of refraction consistently lower than the one obtained for an aged boreal BB (e.g., Wandinger et al., 2002). We can thus conclude that“biomass burning aerosol,”even in its aged stage, is a heterogeneous class in itself with specific optical properties depending on the relative abundance and properties of its constituent particle types. Specifically, we found that the spherical organic particles during P1 dominate the scattering and led to a closure between the distribution, chemical composition and the retrieved SSA and AAE obtained by Mie theory, while the abundance of crystalline salts during P2 did not allow Mie calculation.
A second point to consider is the possibility that the aerosol properties recorded at ground level are not the same as those actually present at a different height above it due to stratification and that such heterogeneities may have been maintained for a long time after the end of the event. It is clear however that the most detailed possible characterization of the particles will allow refining the models for aerosol structure and properties retrieved from satellite, optical depth, and sky radiance measurements.
References
Aaltonen, V., Lihavainen, H., Kerminen, V.‐M., Komppula, M., Hatakka, J., Eneroth, K., et al. (2006). Measurements of optical properties of atmospheric aerosols in 15 Northern Finland.Atmospheric Chemistry and Physics,6(5), 1155–1164. https://doi.org/10.5194/acp‐6‐1155‐ 2006
Adachi, K., & Buseck, P. R. (2011). Atmospheric tar balls from biomass burning in Mexico.Journal of Geophysical Research,116, D05204.
https://doi.org/10.1029/2010JD015102
Andreae, M. O., & Gelencser, A. (2006). Black carbon or brown carbon? The nature of light‐absorbing carbonaceous aerosols.Atmospheric Chemistry and Physics,6, 3131–3148.
Bergstrom, R. W., Pilewskie, P., Russell, P. B., Redemann, J., Bond, T. C., Quinn, P. K., & Sierau, B. (2007). Spectral absorption properties of atmospheric aerosols.Atmospheric Chemistry and Physics,7, 5937–5943.
Bowman, D. M. J. S., Williamson, G. J., Abatzoglou, J. T., Kolden, C. A., Cochrane, M. A., & Smith, A. M. S. (2017). Human exposure and sensitivity to globally extreme wildfire events.Nature Ecology & Evolution,1, 0058. https://doi.org/10.1038/s41559‐016‐0058 Buonanno, G., DellIsola, M., Stabile, L., & Viola, A. (2009). Uncertainty budget of the SMPS‐APS system in the measurement of PM10,
PM2.5and PM1.Aerosol Science and Technology,43, 1130–1141.
Chakrabarty, R. K., Moosmüller, H., Chen, L. W. A., Lewis, K., Arnott, W. P., Mazzoleni, C., et al. (2010). Brown carbon in tar balls from smoldering biomass combustion.Atmospheric Chemistry and Physics,10(13), 6363–6370. https://doi.org/10.5194/acp‐10‐6363‐2010 Chen, W.N. & Fryrear, D.W. (2001). Aerodynamic and geometric diameters of airborne particles.Journal of Sedimentary Research,71,
365–371. https://doi.org/10.1306/2DC4094A-0E47-11D7-8643000102C1865D
China, S., Mazzoleni, C., Gorkowski, K., Aiken, A. C., & Dubey, M. K. (2013). Morphology and mixing state of individual freshly emitted wildfire carbonaceous particles.Nature Communications,4(1), 4. https://doi.org/10.1038/ncomms3122
Cooke, W. F., & Wilson, J. J. N. (1996). A global black carbon aerosol model.Journal of Geophysical Research,101, 19,395–19,409.
Diapouli, E., Popovicheva, O., Kister, M., Vratolis, S., Persiantseva, N., Timofeev, M., et al. (2014). Physicochemical characterization of aged biomass burning aerosol after long‐range transport to Greece from large scale wildfires in Russia and surrounding stations, Summer 2010.Atmospheric Environment,96, 393–404. https://doi.org/10.1016/j.atmosenv.2014.07.055
Dinar, E., Riziq, A. A., Spindler, C., Erlick, C., Kiss, G., & Rudich, Y. (2008). The complex refractive index of atmospheric and model humic‐ like substances (HULIS) retrieved by a cavity ringdown aerosol spectrometer (CRD‐AS).Faraday Discussions,137, 279–295.
Acknowledgments
Data reported and discussed in this manuscript are available for download in the PANGAEA World Data Center (https://doi.org/10.1594/
PANGAEA.908189). The MIUR (Ministero dell'Istruzione, dell'Università e della Ricerca) and Università degli Studi di Perugia are acknowledged forfinancial support to the project AMIS, through the program
“Dipartimenti di Eccellenza‐2018‐2022.
Logistic assistance by the Polar Support Unit of the CNR (National Research Council) of Italy, Department of Earth and Environment (POLARNET), in coordinating the activities based at the Dirigibile Italia Arctic station at Ny Ålesund is acknowledged.
Falkovich, A. H., Graber, E. R., Schkolnik, G., Rudich, Y., Maenhaut, W., & Artaxo, P. (2004). Low molecular weight organic acids aerosol particles from Rôndonia, Brazil, during the biomass‐burning, transition and wet periods.Atmospheric Chemistry and Physics Discussions, 4, 6867–6907.
Ferrero, L., Cappelletti, D., Busetto, M., Mazzola, M., Lupi, A., Lanconelli, C., et al. (2016). Vertical profiles of aerosol and black carbon in the Arctic: A seasonal phenomenology along 2 years (2011–2012) offield campaigns.Atmospheric Chemistry and Physics,16(19), 12,601–12,629. https://doi.org/10.5194/acp‐16‐12601‐2016
Forrister, H., Liu, J., Scheuer, E., Dibb, J., Ziemba, L., Thornhill, K. L., et al. (2015). Evolution of brown carbon in wildfire plumes.
Geophysical Research Letters,42, 4623–4630. https://doi.org/10.1002/2015GL063897
Hand, J. L., Malm, W. C., Laskin, A., Day, D., Lee, T., Wang, C., et al. (2005). Optical, physical and chemical properties of tar balls observed during the Yosemite Aerosol Characterisation Study.Journal of Geophysical Research,110, D21210. https://doi.org/10.1029/
2004JD005728
Hansen, A. M. K., Kristensen, K., Nguyen, Q. T., Zare, A., Cozzi, F., Nojgaard, J. K., et al. (2014). Organosulfates and organic acids in Arctic: Annual variation and concentration levels.Atmospheric Chemistry and Physics,14(15), 7807–7823. https://doi.org/10.5194/
acp‐14‐7807‐2014
Haywood, J. M., & Osborne, S. R. (2000).Corrections to be applied to the PSAP and nephelometer for accurate determination of the absorption coefficient, scattering coefficient and single scattering albedo, MRF Technical Note, 31. Hampshire, UK: Meteorological Office.
Haywood, J. M., & Ramaswamy, V. (1998). Global sensitivity studies of the direct radiative forcing due to anthropogenic sulfate and black carbon aerosols.Journal of Geophysical Research,103, 6043–6058.
Hoffer, A., Toth, A., Nyiro‐Kosa, I., Posfai, M., & Gelencser, A. (2016). Light absorption properties of laboratory‐generated tar ball particles.
Atmospheric Chemistry and Physics,16, 239–246.
Hopkins, R. J., Lewis, K., Desyaterik, Y., Wang, Z., Tivanski, A. V., Arnott, W. P., et al. (2007). Correlations between optical, chemical and physical properties of biomass burn aerosols.Geophysical Research Letters,34, L18806. https://doi.org/10.1029/2007GL030502 Huang, R. J., Zhang, Y., Bozzetti, C., Ho, K. F., Cao, J. J., Han, Y., et al. (2014). High secondary aerosol contri‐bution to particulate pollution
during haze events in China.Nature,514(7521), 218–222. https://doi.org/10.1038/nature13774
Jolly, W. M., Cochrane, M. A., Freeborn, P. H., Holden, Z. A., Brown, T. J., Williamson, G. J., & Bowman, D. M. J. S. (2015). Climate‐ induced variations in global wildfire danger from 1979 to 2013.Nature Communications,6, 7537. https://doi.org/10.1038/ncomms8537 Kim, J., Bauer, H., Dobovicnik, T., Hitzenberger, R., Lottin, D., Ferry, D., & Petzold, A. (2015). Assessing optical properties and refractive
index of combustion aerosol particles through combined experimental and modeling studies.Aerosol Science and Technology,49, 340–350.
Lack, D., Langridge, J. M., Bahreini, R., Cappa, C. D., Middlebrook, A. M., & Schwarz, J. P. (2012). Brown carbon and internal mixing in biomass burning particles.PNAS,109(37), 14,802–14,807. https://doi.org/10.1073/pnas.1206575109
Lack, D., Lovejoy, E. R., Baynard, T., Pettersson, A., & Ravishankara, A. R. (2006). Aerosol absorption measurement using photoacoustic spectroscopy: Sensitivity, calibration, and uncertainty developments.Aerosol Science and Technology,40(9), 697–708.
Li, J., Posfai, M., Hobbs, P. V., & Buseck, P. R. (2003). Individual aerosol particles from biomass burning in southern Africa: 2. Compositions and aging of inorganic particles.Journal of Geophysical Research,108(D13), 8484. https://doi.org/10.1029/2002JD002310
Liousse, C., Penner, J. E., Chuang, C., Walton, J. J., Eddleman, H., & Cachler, H. (1996). A global, three‐dimensional model study of carbonaceous aerosols.Journal of Geophysical Research,101, 19,411–19,432.
Lisok, J., Rozwadowska, A., Pedersen, J. G., Markowicz, K. M., Ritter, C., Kaminski, J. W., et al. (2018). Radiative impact of an extreme Arctic biomass‐burning event.Atmospheric Chemistry and Physics,18(12), 8829–8848. https://doi.org/10.5194/acp‐18‐8829‐2018 Liu, C., Chung, C. E., Yin, Y., & Schnaiter, M. (2018). The absorption Ångström exponent of black carbon: From numerical aspects.
Atmospheric Chemistry and Physics,18, 6259–6273.
Liu, Y., Goodrick, S., & Heilman, W. (2014). Wildlandfire emissions, carbon, and climate: Wildfire‐climate interactions.Forest Ecology and Management,317, 80–96.
Markowicz, K. M., Pakszys, P., Ritter, C., Zielinski, T., Udisti, R., Cappelletti, D., et al. (2016). Impact of North American intensefires on aerosol optical properties measured over the European Arctic in July 2015.Journal of Geophysical Research: Atmospheres,121, 14,487–14,512. https://doi.org/10.1002/2016JD025310
McNaughton, C. S., Clarke, A. D., Freitag, S., Kapustin, V. N., Kondo, Y., Moteki, N., et al. (2011). Absorbing aerosol in the troposphere of the Western Arctic during the 2008 ARCTAS/ARCPAC airbornefield campaigns.Atmospheric Chemistry and Physics,11(15), 7561–7582. https://doi.org/10.5194/acp‐11‐7561‐2011
Moroni, B., Becagli, S., Bolzacchini, E., Busetto, M., Cappelletti, D., Crocchianti, S., et al. (2015). Vertical profiles and chemical properties of aerosol particles upon Ny‐Ålesund (Svalbard Island).Advances in Meterology,2015, 292081. https://doi.org/10.1155/2015/292081 Moroni, B., Cappelletti, D., Crocchianti, S., Becagli, S., Caiazzo, L., Traversi, R., et al. (2017). Morphochemical characteristics and mixing
state of long range transported wildfire particles at Ny‐Ålesund (Svalbard Islands).Atmospheric Environment,156, 135–145. https://doi.
org/10.1016/j.atmosenv.2017.02.037
Müller, T., Nowak, A., Wiedensohler, A., Sheridan, P., Laborde, M., Covert, D. S., et al. (2009). Angular illumination and truncation of three different integrating nephelometers: Implications for empirical, size‐based corrections.Aerosol Science and Technology,43(6), 581–586.
https://doi.org/10.1080/02786820902798484
Nikonovas, T., North, P. R. J., & Doerr, S. H. (2015). Smoke aerosol properties and ageing effects for northern temperate and boreal regions derived from AERONET source and age attribution.Atmospheric Chemistry and Physics,15, 7929–7943.
Nikonovas, T., North, P.R.J. and Doerr, S.H. (2016). Particulate emissions from large North American wildfires estimated using a new top‐
down method. Atmospheric Chemistry and Physics Discussions, https://doi.org/10.5194/acp‐2016‐277.
Pakszys, P., & Zielinski, T. (2017). Aerosol optical properties over Svalbard: A comparison between Ny‐Ålesund and Hornsund.
Oceanologia,59(4), 431–444. https://doi.org/10.1016/j.oceano.2017.05.002
Ponomarev, E. I., Kharuk, V. I., & Ranson, K. J. (2016). Wildfires dynamics in Siberian larch forests.Forests,7, 125. https://doi.org/10.3390/
f7060125
Popovicheva, O. B., Kozlov, V. S., Engling, G., Diapouli, E., Persiantseva, N. M., Timofeev, M. A., et al. (2015). Small‐scale study of Siberian biomass burning: I. Smoke microstructure.Aerosol and Air Quality Research,15(1), 117–128. https://doi.org/10.4209/aaqr.2014.09.0206 Posfai, M., Gelencsér, A., Simonics, R., Arató, K., Li, J., Hobbs, P. V., & Buseck, P. R. (2004). Atmospheric tar balls: Particles from biomass
and biofuel burning.Journal of Geophysical Research,109, D06213. https://doi.org/10.1029/2003JD004169
Posfai, M., Simonics, R., Li, J., Hobbs, P. V., & Buseck, P. R. (2003). Individual aerosol particles from biomass burning in southern Africa: 1.
Compositions and size distributions of carbonaceous particles.Journal of Geophysical Research,108(D13), 8483. https://doi.org/10.1029/
2002JD002291